Denver and Fort Collins are two vibrant cities in Colorado attracting both prospective residents and tourists. Denver, being a cosmopolitan hub, offers a bustling city life with a more diverse economy, while Fort Collins, home to Colorado State University, has a collegial, family-friendly atmosphere but still maintains a robust economic landscape. Though there are commonalities in culture and geographical features, each city has its own distinct characteristics, and contrasting elements are evident in terms of crime and safety, weather, cost of living, education, and many others.
Distance between
Denver, CO and
Fort Collins, CO : 57.9 miles
Denver's population is larger by 322%. Its population has grown by 156,827 people (28.3%) since 2000. The population of Fort Collins has grown by 49,886 people (42.0%) during that time.
Denver, as a larger city, experiences higher crime rates than Fort Collins. While both cities have made strides in enhancing safety, prospective residents and tourists should be aware of this disparity. However, it's important to note that neighborhood crime rates within these cities can vary significantly, with some areas being safer than others.
City-data.com crime index counts serious crimes and violent crime more heavily. It adjusts for the number of visitors and daily workers commuting into cities. (higher means more crime, U.S. average = 301.1)
City-data.com crime index counts serious crimes and violent crime more heavily. It adjusts for the number of visitors and daily workers commuting into cities. (higher means more crime, U.S. average = 301.1)
Sex Offenders
According to our data, there are 1,928 registered sex offenders living in Denver and 335 registered sex offenders living in . The ratio of residents to sex offenders in Denver is 359 to 1; the ratio in Fort Collins is 490 to 1. The number of registered sex offenders compared to the number of residents is larger in Denver than in Fort Collins.
Cost of Living
Denver, due to its status as Colorado's largest city and capital, has a higher cost of living compared to Fort Collins. Things like groceries, housing, and entertainment generally cost more in Denver. Fort Collins, while not cheap, is more affordable in comparison.
Income Tax
Colorado applies a flat income tax rate to all residents, so regardless of whether you live in Denver or Fort Collins, your state income tax rating will be the same.
Property Tax
Denver has a higher average property tax rate than Fort Collins. However, due to the considerably higher property values in Denver, homeowners pay more in absolute terms.
Sales Tax
Both Denver and Fort Collins have state sales tax rates, but Denver maintains a slightly higher city sales tax. As a result, certain goods and services might be slightly more expensive in Denver.
Income
Type
Denver
Fort Collins
Estimated median household income
$81,630
$73,945
Estimated per capita income
$52,690
$41,119
Cost of living index (U.S. average is 100)
111.3
100.4
If you make $50,000 in Fort Collins, you will have to make $55,428 in Denver to maintain the same standard of living.
Geographical Conditions
Both cities are slightly over a mile above sea level and located near the foothills of the Rocky Mountains, ensuring beautiful vistas and a range of outdoor activities. However, Denver is larger and more urbanized while Fort Collins offers a smaller-town feel and easier access to open natural spaces.
Both cities are heralded for their education opportunities. Denver offers a multitude of schools with numerous magnet and charters, alongside traditional public schools. Fort Collins is home to Colorado State University and offers quality education from elementary to university level.
Denver has a wider array of job opportunities across diverse sectors, including aerospace, telecommunications, and healthcare. Fort Collins, while it has a robust economy, is more concentrated around education, manufacturing, and healthcare sectors. Unemployment rates in both cities are relatively low, with Denver slightly higher than Fort Collins.
Biggest Employers
Both cities host various health systems, universities, and government agencies as major employers. Denver's largest employers include Denver Health, the University of Colorado, and Lockheed Martin. In Fort Collins, major employers include Colorado State University, HP Inc., and UCHealth.
There were 1,550 building permits issued in Denver in 2012 (847 more than in 2011) compared to 381 building permits issued in Fort Collins in 2012 (123 more than in 2011).
In Denver (Denver County), 73.9% voted for Democrats and 24.3% for Republicans in 2012 Presidential Election. In Fort Collins (Larimer County), 51.7% voted for Democrats and 45.9% for Republicans.
Elections
Type
Democrats
Republicans
Other
Year
Denver
Fort Collins
Denver
Fort Collins
Denver
Fort Collins
2020
80.1%
56.7%
18.3%
41.1%
1.6%
2.2%
2016
74.2%
47.8%
19.0%
42.8%
6.8%
9.4%
2012
73.9%
51.7%
24.3%
45.9%
1.7%
2.4%
2008
75.8%
54.2%
23.2%
44.4%
1.0%
1.4%
2004
69.7%
46.8%
29.3%
52.0%
0.9%
1.1%
2000
62.0%
39.0%
30.9%
52.8%
7.0%
8.2%
1996
61.8%
42.0%
30.0%
47.1%
8.2%
10.8%
Breakdown of population affiliated with a religious congregation
Type
Adherents
Congregations
Religion
Denver
Fort Collins
Denver
Fort Collins
CATHOLIC CHURCH
26.6%
11.8%
8.7%
3.0%
AMERICAN BAPTIST CHURCHES IN THE USA
2.1%
0.1%
4.3%
0.9%
EPISCOPAL CHURCH
1.1%
0.6%
3.2%
1.7%
SALVATION ARMY
1.1%
0.1%
0.7%
0.4%
SOUTHERN BAPTIST CONVENTION
0.9%
0.7%
6.8%
6.9%
SEVENTH DAY ADVENTIST CHURCH
0.7%
0.5%
3.0%
2.2%
MUSLIM ESTIMATE
0.5%
0.1%
0.9%
0.4%
EVANGELICAL LUTHERAN CHURCH IN AMERICA
0.4%
1.6%
2.7%
3.5%
LUTHERAN CHURCH
0.3%
1.7%
2.3%
2.6%
VINEYARD USA
0.0%
1.2%
0.2%
0.9%
Weather
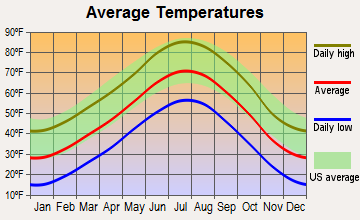
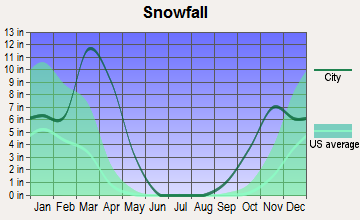
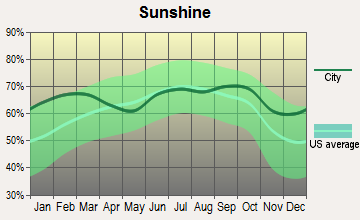
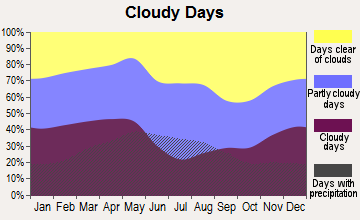
In terms of weather, both cities experience a typical Colorado climate, which includes cold, snowy winters and warm, sunny summers. However, Denver, being located in a semi-arid region, gets less snow and experiences slightly more sunshine than Fort Collins.
Weather and climate
Type
Denver
Fort Collins
Temperature - Average
49.5°F
48.9°F
Humidity - Average morning or afternoon humidity
50.6%
55%
Humidity - Differences between morning and afternoon humidity
20%
26.4%
Humidity - Maximum monthly morning or afternoon humidity
55%
63.3%
Humidity - Minimum monthly morning or afternoon humidity
35%
36.9%
Precipitation - Yearly average
17 in
16.3 in
Snowfall - Yearly average
114 in
113.7 in
Clouds - Number of days clear of clouds
19.2%
18.4%
Sunshine amount - Average
75.6%
71.9%
Sunshine amount - Differences during a year
10%
12.5%
Sunshine amount - Maximum monthly
74%
71.6%
Sunshine amount - Minimum monthly
64%
59.1%
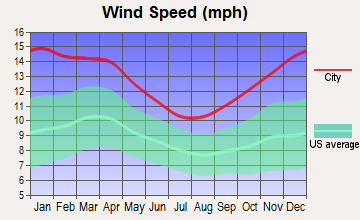
Wind speed - Average
8.6 mph
11.5 mph
Average climate in Denver, Colorado
Average climate in Fort Collins, Colorado
Air pollution
Type
AQI
CO
NO2
OZONE
PB
PM10
PM25
SO2
Year
Denver
Fort Collins
Denver
Fort Collins
Denver
Denver
Fort Collins
Denver
Denver
Fort Collins
Denver
Fort Collins
Denver
2018
100
90
0.50
0.30
25.4
N/A
27.9
29.3
N/A
N/A
29.2
N/A
8.6
7.8
0.7
N/A
2017
95
91
0.49
0.29
25.9
N/A
27.6
28.0
N/A
N/A
22.0
N/A
8.4
7.4
0.8
N/A
2016
90
77
0.53
0.33
27.7
N/A
27.2
26.4
N/A
N/A
22.6
N/A
8.7
6.8
1.0
N/A
2015
101
75
0.53
0.37
27.8
N/A
25.2
26.7
N/A
N/A
21.0
N/A
10.4
8.6
1.0
N/A
2014
94
65
0.53
0.34
25.4
N/A
24.6
28.1
N/A
N/A
25.1
17.9
10.1
N/A
1.3
N/A
2013
85
75
0.45
0.27
21.9
N/A
24.0
27.9
N/A
N/A
24.4
18.8
N/A
N/A
1.5
N/A
2012
91
83
0.33
0.26
18.9
N/A
26.2
29.1
N/A
N/A
24.9
24.4
N/A
N/A
1.4
N/A
2011
91
72
0.34
0.32
18.1
N/A
25.8
27.4
N/A
N/A
23.7
16.7
N/A
N/A
1.6
N/A
2010
82
69
0.43
0.32
16.3
N/A
23.6
26.0
N/A
N/A
26.4
20.5
N/A
N/A
1.0
N/A
2009
79
60
0.41
0.29
14.1
N/A
23.1
25.0
0.005
N/A
22.2
N/A
N/A
N/A
1.3
N/A
2008
85
65
0.43
0.23
17.3
N/A
26.0
27.4
0.008
N/A
25.2
N/A
N/A
N/A
1.6
N/A
2007
96
66
0.37
0.34
20.6
N/A
21.9
26.3
0.007
N/A
30.2
N/A
N/A
N/A
1.2
N/A
2006
89
68
0.51
0.49
19.0
N/A
22.1
28.6
0.008
N/A
28.0
N/A
N/A
N/A
1.4
N/A
2005
86
68
0.57
0.52
21.3
N/A
20.9
26.4
0.068
N/A
30.9
N/A
N/A
N/A
1.5
N/A
2004
82
62
0.60
0.56
21.2
N/A
19.2
22.5
0.012
N/A
28.6
N/A
N/A
N/A
1.8
N/A
2003
106
75
0.60
0.56
21.2
N/A
20.8
24.2
0.015
N/A
32.6
N/A
N/A
N/A
1.9
N/A
2002
86
66
0.65
0.46
19.2
N/A
20.4
23.0
0.014
N/A
35.7
N/A
N/A
N/A
2.5
N/A
2001
95
62
0.86
0.37
23.6
N/A
18.6
20.2
0.012
N/A
32.6
N/A
N/A
N/A
2.6
N/A
2000
93
62
0.81
0.58
13.4
N/A
19.2
21.8
0.013
N/A
12.2
N/A
N/A
N/A
2.1
N/A
Natural disasters
Type
Denver
Fort Collins
Tornado activity compared to U.S. average
129.5%
102.2%
Earthquake activity compared to U.S. average
811.7%
752%
Natural disasters compared to U.S. average
10%
25%
Transportation
Denver has a more robust public transportation system, including buses, rail services, and extensive bike lanes throughout the city. Fort Collins also offers bus and bicycle transit options, but its smaller size makes commuting less of a challenge.
Transport
Type
Denver
Fort Collins
Amtrak stations
2
1
Amtrak stations nearby
2
2
FAA registered aircraft
602
203
FAA registered aircraft manufacturers and dealers
28
18
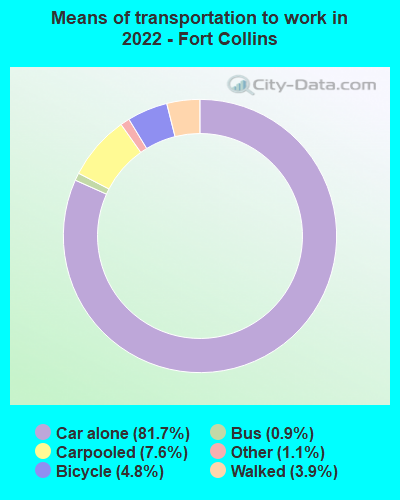
Means of transportation to work
Type
Denver
Fort Collins
Bicycle
1.5%
3.1%
Bus
2.6%
1.1%
Carpooled
8.8%
7.3%
Car alone
81.1%
82.4%
Motorcycle
0.1%
0.2%
Railroad
1.2%
0%
Streetcar
0.2%
0%
Taxicab
0.1%
0%
Walked
2.8%
4.3%
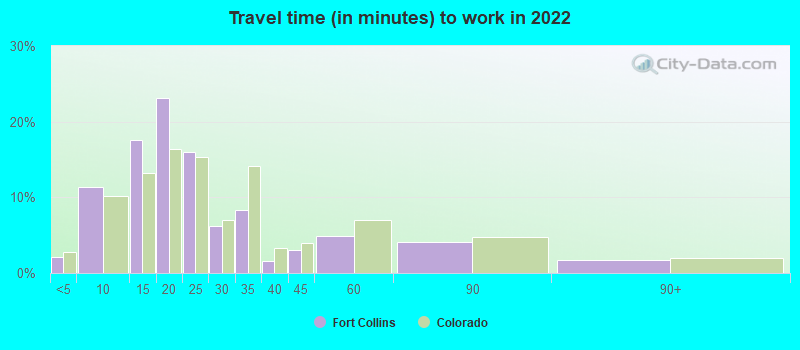
Average travel time to work
Type
Denver
Fort Collins
Average
29.4 min
23.5 min
Other means
24.2 min
20.6 min
Public transportation
38 min
26 min
Private vehicle occupancy
Type
Denver
Fort Collins
Average
1.1
1.1
Drove alone
90.6%
91.2%
In 2 person carpool
7.3%
6.4%
In 3 person carpool
1.3%
2%
In 4 person carpool
0.5%
0.3%
In 5-6 person carpool
0.2%
0.1%
How many people usually rode to work in the car, truck or van.
Real Estate
Due to higher demand and larger population, Denver's real estate market tends to be more expensive than that of Fort Collins. However, both cities have experienced growth in their real estate markets, and property values are forecasted to continue rising.
Neighborhoods
Denver offers a variety of neighborhoods, ranging from bustling downtown areas to quieter suburban communities. Fort Collins is known for its family-friendly neighborhoods, many of which are located near parks and schools.
Houses and residents
Type
Denver
Fort Collins
Houses
351,829
73,397
Average household size (people)
2.2
2.4
Median year apartment built
1981
1991
Median year house/condo built
1966
1991
Length of stay in the house since moving in
11.3 years
11.2 years
Houses occupied
326,634 (92.8%)
70,686 (96.3%)
Houses occupied by owners
164,429 (50.3%)
37,255 (52.7%)
Houses occupied by renters
162,205 (49.7%)
33,431 (47.3%)
Median rent asked for vacant for-rent units
$1,674
$1,281
Median monthly housing costs
$1,626
$1,477
Median price asked for vacant for-sale houses and condos
$970,375
$663,993
Estimated median house or condo value
$541,500
$485,500
Median numbers of rooms
4.6
5.6
Median number of rooms in apartments
3.5
4.2
Median number of rooms in houses and condos
6.4
7.2
Median house price - detached houses
$690,450
$560,385
Median house price - in 2-unit structures
$668,727
$520,131
Median house price - in 3-to-4-unit structures
$410,273
$307,071
Median house price - in 5 or more unit structures
$487,647
$336,025
Median house price - mobile homes
$174,140
$47,532
Median house price - Townhouses or other attached units
$568,100
Over $1,000,000
Median house price - All housing units
$644,007
$565,242
Median house age
47
30
Renting percentage
50%
44.9%
Housing density (houses/condos per square mile)
2,294.3
1,577
House value disparities
26.4%
23.4%
Household income disparities
44%
42.9%
Median household income for houses/condes with a mortgage
$120,615
$122,248
Median household income for apartments without a mortgage
$77,011
$84,636
Housing units without a mortgage
2,112 (1.7%)
358 (1.4%)
Housing units with both a second mortgage and home equity loan
9,615 (7.6%)
2,275 (8.6%)
Housing units with a mortgage
123,690 (98.3%)
26,080 (98.6%)
Housing units with a home equity loan
273 (0.2%)
0 (0%)
Housing units with a second mortgage
12,819 (10.2%)
2,740 (10.4%)
House/condo owner moved in on average (years ago)
7
9
House/condo renter moved in on average (years ago)
1
1
Housing units lacking complete kitchen facilities
1.3%
1.2%
Housing units lacking complete plumbing facilities
0.8%
1%
Housing units in structures
Housing units in structures
Denver
Fort Collins
One, detached
42.9%
52.5%
One, attached
8.3%
7.6%
Two
2.1%
2.4%
3 or 4
3.1%
6.3%
5 to 9
3.6%
8.8%
10 to 19
7.0%
7.8%
20 to 49
10.4%
7.0%
50 or more
22.0%
5.4%
Mobile homes
0.4%
2.1%
Boats, RVs, vans, etc.
0.1%
0.1%
Median real estate property taxes paid for housing units
Self-employed workers in own not incorporated business
24,661
6,094
State government workers
15,204
7,611
Unpaid family workers
763
42
Industries and Occupations
Key industries in Denver include aerospace, telecommunications, healthcare, and technology. In contrast, Fort Collins is dominated by the education, healthcare, and manufacturing industries. This results in a wider array of job opportunities in Denver, while Fort Collins has more of a concentration in certain sectors.
Both cities have access to high-quality healthcare systems. Denver boasts many reputable hospitals, including the University of Colorado Hospital. Fort Collins is home to UCHealth Poudre Valley Hospital, which is consistently rated as one of the top hospitals in the state.
Health (county statistics)
Type
Denver
Fort Collins
General health status score of residents in this county from 1 (poor) to 5 (excellent)
Denver boasts a more extensive infrastructure, complete with a comprehensive public transit system, international airport, and a smart city technology initiative. Fort Collins, while smaller, also has reliable infrastructure, including a strong public transit system and a regional airport.
Infrastructure
Type
Denver
Fort Collins
Hospitals
16
1
TV stations
17
8
Arenas or stadiums
4
1
Bank branches located here
205
62
Bank institutions located here
43
24
Main business address for public companies
58
2
Drinking water stations with no reported violations in the past
8
1
Drinking water stations with reported violations in the past
HMDA - Conventional home purchase loans - Applications denied
Year
Denver
Fort Collins
1999
2,727
937
2000
2,698
423
2001
1,996
317
2002
1,591
247
2003
2,472
506
2004
3,789
460
2005
5,168
464
2006
5,506
380
2007
3,599
251
2008
1,902
142
2009
768
97
Culture and Food
Both cities are celebrated for their food and culture. Denver, with its larger population and diversity, supports a wider variety of culinary options. Meanwhile, Fort Collins is nationally recognized for its local breweries and farm-to-table restaurants.
Sports Teams
Denver is home to several professional sports teams, including the Denver Broncos (NFL), Denver Nuggets (NBA), and Colorado Rockies (MLB). Fort Collins does not have any professional teams, although Colorado State University offers a variety of collegiate sports.


 Denver, CO
 Fort Collins, CO