The comparison between living in Denver, CO, and Henderson, NV, reveals distinct differences and similarities across a variety of factors ranging from the crime rate, cost of living to work economy and geographical conditions. Both cities present unique opportunities and challenges to both residents and visitors alike. Ultimately, individual preferences around weather, community size, tax policies, and lifestyle may determine which city is the better fit.
Distance between
Denver, CO and
Henderson, NV : 604.7 miles
Denver's population is larger by 121%. Its population has grown by 156,827 people (28.3%) since 2000. The population of Henderson has grown by 146,797 people (83.7%) during that time.
Denver, Colorado, has a higher crime rate than Henderson, Nevada. While Denver's overall crime rate is 30% higher than the national average, Henderson boasts a rate that's 34% below the national average, making it one of the safest cities in the state of Nevada. Visitor safety can usually be assured by taking general precautions in both cities. However, specific neighborhoods in Denver may have higher crime rates, so planning visits accordingly are advised.
City-data.com crime index counts serious crimes and violent crime more heavily. It adjusts for the number of visitors and daily workers commuting into cities. (higher means more crime, U.S. average = 301.1)
City-data.com crime index counts serious crimes and violent crime more heavily. It adjusts for the number of visitors and daily workers commuting into cities. (higher means more crime, U.S. average = 301.1)
Sex Offenders
According to our data, there are 1,932 registered sex offenders living in Denver and 531 registered sex offenders living in . The ratio of residents to sex offenders in Denver is 359 to 1; the ratio in Henderson is 552 to 1. The number of registered sex offenders compared to the number of residents is larger in Denver than in Henderson.
Cost of Living
Denver is more expensive to live in than Henderson. The cost of essentials like housing, groceries, and health care is significantly higher in Denver. However, Henderson's cost of living is slightly above the national average, due primarily to housing costs, but still falls well below Denver. For tourists, daily expenses in Denver could be higher based on accommodation and dining costs.
Income Tax
Nevada, including Henderson, does not impose a state income tax. Denver residents, in contrast, are subject to Colorado's flat income tax rate of 4.63%.
Property Tax
Denver's average property tax rate is 0.5%, which is lower than the national average. Henderson's property tax rates vary by location but are generally lower than most of the country, with an average rate of about 0.7%.
Sales Tax
The combined sales tax in Denver is 8.31%, while in Henderson it's 8.375%. These rates are quite comparable, with Henderson having a slightly higher rate.
Income
Type
Denver
Henderson
Estimated median household income
$81,630
$77,924
Estimated per capita income
$52,690
$41,771
Cost of living index (U.S. average is 100)
111.3
99.2
If you make $50,000 in Henderson, you will have to make $56,099 in Denver to maintain the same standard of living.
Geographical Conditions
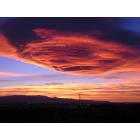
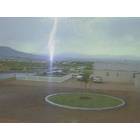
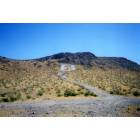
Denver, known as the 'Mile High City', is located on high rolling plains, a mile above sea level. It is surrounded by scenic mountains and rivers. Henderson is located in the Mojave Desert, and offers a stark desert landscape with palm trees and close proximity to the Hoover Dam and Lake Mead.
Denver and Henderson both have reputable education systems however, Denver is home to more renowned universities including Colorado State University, and University of Denver. Henderson also offers solid educational opportunities, including Nevada State College and numerous public and private schools. Both cities provide quality education but Denver offers more post-secondary choices.
Both cities have robust economies with a low unemployment rate. Denver's economy is diversified with significant employment in the aerospace, telecommunications, and technology industries. Henderson's economy is tied into the Las Vegas economy, with a focus on tourism, entertainment, gambling, and construction industries.
Biggest Employers
Denver's biggest employers include the U.S. Government, State of Colorado, and the University of Colorado System. In Henderson, the main employers include the Clark County School District, City of Henderson, and several casino resorts and retail outlets.
There were 1,550 building permits issued in Denver in 2012 (847 more than in 2011) compared to 3,356 building permits issued in Henderson in 2012 (2604 more than in 2011).
In Denver (Denver County), 73.9% voted for Democrats and 24.3% for Republicans in 2012 Presidential Election. In Henderson (Clark County), 56.4% voted for Democrats and 41.8% for Republicans.
Elections
Type
Democrats
Republicans
Other
Year
Denver
Henderson
Denver
Henderson
Denver
Henderson
2020
80.1%
53.7%
18.3%
44.3%
1.6%
2.0%
2016
74.2%
52.4%
19.0%
41.7%
6.8%
5.8%
2012
73.9%
56.4%
24.3%
41.8%
1.7%
1.8%
2008
75.8%
58.5%
23.2%
39.5%
1.0%
2.0%
2004
69.7%
51.8%
29.3%
46.9%
0.9%
1.3%
2000
62.0%
51.4%
30.9%
44.8%
7.0%
3.8%
1996
61.8%
75.5%
30.0%
18.8%
8.2%
5.7%
Breakdown of population affiliated with a religious congregation
Type
Adherents
Congregations
Religion
Denver
Henderson
Denver
Henderson
CATHOLIC CHURCH
26.6%
18.1%
8.7%
4.0%
AMERICAN BAPTIST CHURCHES IN THE USA
2.1%
0.2%
4.3%
1.4%
EPISCOPAL CHURCH
1.1%
0.1%
3.2%
1.1%
SALVATION ARMY
1.1%
0.1%
0.7%
0.5%
SOUTHERN BAPTIST CONVENTION
0.9%
1.6%
6.8%
11.2%
SEVENTH DAY ADVENTIST CHURCH
0.7%
0.2%
3.0%
1.6%
MUSLIM ESTIMATE
0.5%
0.1%
0.9%
0.6%
EVANGELICAL LUTHERAN CHURCH IN AMERICA
0.4%
0.4%
2.7%
1.6%
LUTHERAN CHURCH
0.3%
0.2%
2.3%
1.2%
Weather
Weather-wise, Denver generally experiences a more diverse four-season climate with mild summers, colorful falls, and cold winters marked by substantial snowfall. Henderson, positioned in the Mojave Desert, observes a desert climate, with very hot summers, mild winters, and little rainfall. The choice of the city would greatly depend upon personal weather preferences.
Weather and climate
Type
Denver
Henderson
Temperature - Average
49.5°F
67.8°F
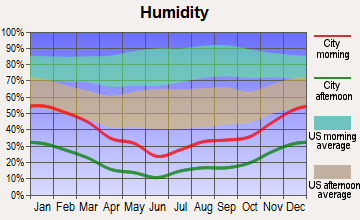
Humidity - Average morning or afternoon humidity
50.6%
30.7%
Humidity - Differences between morning and afternoon humidity
20%
42%
Humidity - Maximum monthly morning or afternoon humidity
55%
52%
Humidity - Minimum monthly morning or afternoon humidity
35%
10%
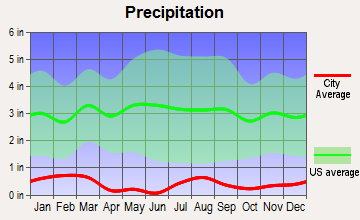
Precipitation - Yearly average
17 in
5.1 in
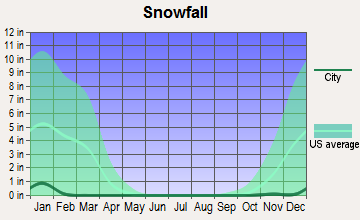
Snowfall - Yearly average
114 in
1.6 in
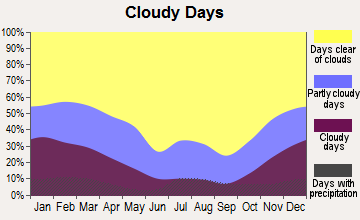
Clouds - Number of days clear of clouds
19.2%
35.1%
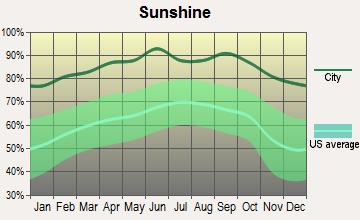
Sunshine amount - Average
75.6%
91.8%
Sunshine amount - Differences during a year
10%
16%
Sunshine amount - Maximum monthly
74%
92%
Sunshine amount - Minimum monthly
64%
76%
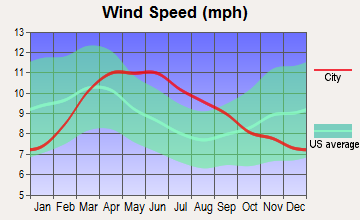
Wind speed - Average
8.6 mph
9.2 mph
Average climate in Denver, Colorado
Average climate in Henderson, Nevada
Air pollution
Type
AQI
CO
NO2
OZONE
PB
PM10
PM25
SO2
Year
Denver
Henderson
Denver
Henderson
Denver
Henderson
Denver
Henderson
Denver
Denver
Henderson
Denver
Henderson
Denver
Henderson
2018
100
99
0.50
0.42
25.4
15.3
27.9
35.1
N/A
N/A
29.2
27.9
8.6
6.1
0.7
0.7
2017
95
89
0.49
0.34
25.9
15.5
27.6
33.9
N/A
N/A
22.0
22.1
8.4
6.7
0.8
0.8
2016
90
91
0.53
0.39
27.7
13.4
27.2
32.3
N/A
N/A
22.6
22.5
8.7
7.5
1.0
0.8
2015
101
87
0.53
0.39
27.8
14.2
25.2
32.5
N/A
N/A
21.0
20.4
10.4
7.8
1.0
1.2
2014
94
88
0.53
0.43
25.4
12.4
24.6
31.3
N/A
N/A
25.1
23.1
10.1
8.2
1.3
1.4
2013
85
95
0.45
0.43
21.9
12.1
24.0
32.0
N/A
N/A
24.4
22.8
N/A
6.7
1.5
1.5
2012
91
96
0.33
0.47
18.9
6.4
26.2
36.0
N/A
N/A
24.9
23.8
N/A
7.0
1.4
1.4
2011
91
84
0.34
0.45
18.1
5.3
25.8
34.8
N/A
N/A
23.7
17.8
N/A
6.2
1.6
1.2
2010
82
81
0.43
0.50
16.3
5.7
23.6
32.9
N/A
N/A
26.4
16.2
N/A
5.6
1.0
N/A
2009
79
83
0.41
0.58
14.1
6.0
23.1
31.5
0.005
N/A
22.2
21.2
N/A
6.6
1.3
N/A
2008
85
81
0.43
0.64
17.3
8.2
26.0
31.6
0.008
N/A
25.2
N/A
N/A
6.4
1.6
N/A
2007
96
96
0.37
0.54
20.6
15.2
21.9
32.7
0.007
N/A
30.2
N/A
N/A
5.6
1.2
0.1
2006
89
102
0.51
0.71
19.0
17.0
22.1
31.8
0.008
N/A
28.0
N/A
N/A
6.2
1.4
0.8
2005
86
99
0.57
0.69
21.3
18.2
20.9
30.0
0.068
N/A
30.9
N/A
N/A
6.3
1.5
5.3
2004
82
86
0.60
0.67
21.2
18.1
19.2
31.9
0.012
N/A
28.6
N/A
N/A
N/A
1.8
1.6
2003
106
98
0.60
0.51
21.2
17.3
20.8
30.2
0.015
N/A
32.6
N/A
N/A
N/A
1.9
0.9
2002
86
92
0.65
0.16
19.2
14.5
20.4
31.0
0.014
N/A
35.7
N/A
N/A
N/A
2.5
0.5
2001
95
94
0.86
0.22
23.6
15.0
18.6
30.5
0.012
N/A
32.6
N/A
N/A
N/A
2.6
0.9
2000
93
94
0.81
0.22
13.4
15.1
19.2
29.9
0.013
N/A
12.2
N/A
N/A
N/A
2.1
0.4
Natural disasters
Type
Denver
Henderson
Tornado activity compared to U.S. average
129.5%
2.4%
Earthquake activity compared to U.S. average
811.7%
5,903.3%
Natural disasters compared to U.S. average
10%
12%
Transportation
Denver offers robust public transportation with an extensive network of buses and trains, making it commuter-friendly. Henderson, though not as extensive, has improved its public transportation in recent years, but a car is still recommended for a more convenient commute.
Transport
Type
Denver
Henderson
Amtrak stations
2
0
Amtrak stations nearby
2
1
FAA registered aircraft
602
469
FAA registered aircraft manufacturers and dealers
28
31
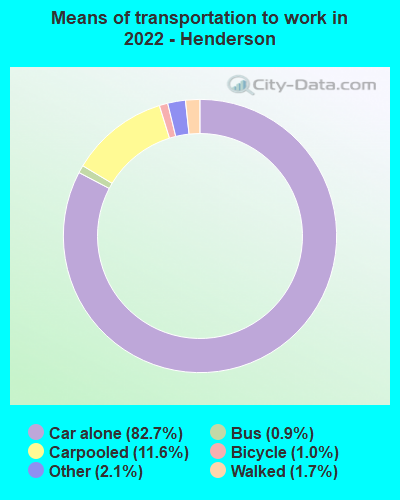
Means of transportation to work
Type
Denver
Henderson
Bicycle
1.5%
0.1%
Bus
2.6%
1%
Carpooled
8.8%
12.1%
Car alone
81.1%
82.2%
Motorcycle
0.1%
0.3%
Railroad
1.2%
0%
Streetcar
0.2%
0%
Taxicab
0.1%
0%
Walked
2.8%
1.3%
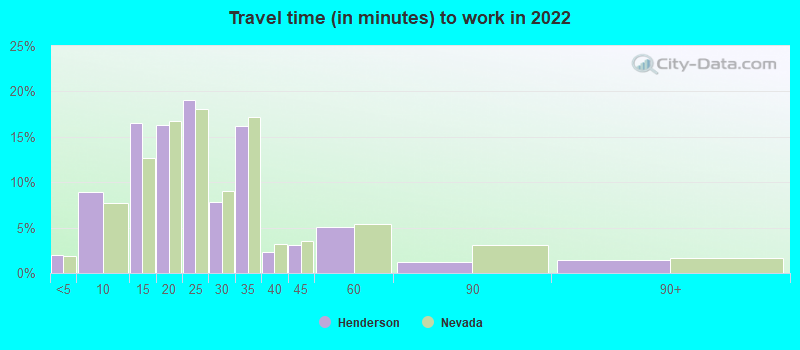
Average travel time to work
Type
Denver
Henderson
Average
29.4 min
24.1 min
Other means
24.2 min
22.6 min
Public transportation
38 min
55 min
Private vehicle occupancy
Type
Denver
Henderson
Average
1.1
1.1
Drove alone
90.6%
91.8%
In 2 person carpool
7.3%
6.4%
In 3 person carpool
1.3%
0.7%
In 4 person carpool
0.5%
0.6%
In 5-6 person carpool
0.2%
0.4%
In 7+ person carpool
0%
0.1%
How many people usually rode to work in the car, truck or van.
Real Estate
Denver's real estate is more expensive than Henderson's. The average home price in Denver exceeds $400,000, while in Henderson, it’s around $300,000. For tourists, accommodations can also be cheaper in Henderson.
Neighborhoods
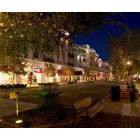
Denver has a diverse mix of neighborhoods each with its own unique flavor, ranging from the artsy RiNo to the elegant Cherry Creek. Henderson is home to master-planned communities like Green Valley and Anthem, which are known for their safety, cleanliness, and family-friendly environment.
Houses and residents
Type
Denver
Henderson
Houses
351,829
132,088
Average household size (people)
2.2
2.5
Median year apartment built
1981
2000
Median year house/condo built
1966
2001
Length of stay in the house since moving in
11.3 years
9.1 years
Houses occupied
326,634 (92.8%)
124,470 (94.2%)
Houses occupied by owners
164,429 (50.3%)
80,562 (64.7%)
Houses occupied by renters
162,205 (49.7%)
43,908 (35.3%)
Median rent asked for vacant for-rent units
$1,674
$1,561
Median monthly housing costs
$1,626
$1,453
Median price asked for vacant for-sale houses and condos
$970,375
$213,031
Estimated median house or condo value
$541,500
$421,300
Median numbers of rooms
4.6
5.5
Median number of rooms in apartments
3.5
4.3
Median number of rooms in houses and condos
6.4
6.2
Median house price - detached houses
$690,450
$515,301
Median house price - in 2-unit structures
$668,727
$196,654
Median house price - in 3-to-4-unit structures
$410,273
$349,610
Median house price - in 5 or more unit structures
$487,647
$274,594
Median house price - mobile homes
$174,140
$108,860
Median house price - Townhouses or other attached units
$568,100
$352,030
Median house price - All housing units
$644,007
$493,824
Median house age
47
20
Renting percentage
50%
34.2%
Housing density (houses/condos per square mile)
2,294.3
1,657.6
House value disparities
26.4%
23.8%
Household income disparities
44%
42.4%
Median household income for houses/condes with a mortgage
$120,615
$104,873
Median household income for apartments without a mortgage
$77,011
$77,944
Housing units without a mortgage
2,112 (1.7%)
682 (1.2%)
Housing units with both a second mortgage and home equity loan
9,615 (7.6%)
2,162 (3.8%)
Housing units with a mortgage
123,690 (98.3%)
55,593 (98.8%)
Housing units with a home equity loan
273 (0.2%)
74 (0.1%)
Housing units with a second mortgage
12,819 (10.2%)
3,197 (5.7%)
House/condo owner moved in on average (years ago)
7
6
House/condo renter moved in on average (years ago)
1
1
Housing units lacking complete kitchen facilities
1.3%
1.6%
Housing units lacking complete plumbing facilities
0.8%
0.4%
Housing units in structures
Housing units in structures
Denver
Henderson
One, detached
42.9%
68.4%
One, attached
8.3%
6.5%
Two
2.1%
0.6%
3 or 4
3.1%
4.2%
5 to 9
3.6%
6.7%
10 to 19
7.0%
5.1%
20 to 49
10.4%
1.9%
50 or more
22.0%
5.0%
Mobile homes
0.4%
1.6%
Boats, RVs, vans, etc.
0.1%
0.1%
Median real estate property taxes paid for housing units
Self-employed workers in own not incorporated business
24,661
9,395
State government workers
15,204
3,866
Unpaid family workers
763
217
Industries and Occupations
Denver has a diversified economy with industries like aerospace, telecommunications, healthcare, and manufacturing offering various employment opportunities. Henderson's most dominating industry is tourism, but it also features opportunities in retail, healthcare, and public administration.
Both Denver and Henderson have quality healthcare systems. Denver hosts some nationally ranked hospitals like UCHealth University of Colorado Hospital. Henderson boasts St. Rose Dominican Hospitals, providing comprehensive care.
Health (county statistics)
Type
Denver
Henderson
General health status score of residents in this county from 1 (poor) to 5 (excellent)
Denver possesses a more developed infrastructure with a plethora of historical buildings, modern facilities, and an advanced public transport system. Henderson, though smaller and less mature in development, has efficiently planned infrastructure with recent developments in public transit and healthcare facilities.
Infrastructure
Type
Denver
Henderson
Hospitals
16
5
TV stations
17
20
Bank branches located here
205
62
Bank institutions located here
43
12
Main business address for public companies
58
1
Drinking water stations with no reported violations in the past
8
2
Drinking water stations with reported violations in the past
HMDA - Conventional home purchase loans - Applications denied
Year
Denver
Henderson
1999
2,727
1,031
2000
2,698
15
2001
1,996
14
2002
1,591
26
2003
2,472
1,186
2004
3,789
2,198
2005
5,168
2,995
2006
5,506
2,465
2007
3,599
1,632
2008
1,902
581
2009
768
317
Culture and Food
Denver's culture is a blend of Western tradition and modern innovation with a vibrant arts scene and a burgeoning food culture. Henderson offers a mix of cultural influences from Las Vegas and has an excellent food scene, with diverse cuisines available.
Sports Teams
Denver residents can root for local teams like the Denver Broncos (NFL), Colorado Rockies (MLB), or Denver Nuggets (NBA). Henderson does not have its own major professional sports teams but does offer tailgating for Las Vegas teams – an enjoyable pastime for locals and tourists alike.


 Denver, CO
 Henderson, NV