Denver and Omaha offer varied experiences, shaped by their unique geographical location, cultural scenes, and economies. Denver, located in Colorado, stands out for its stunning Rocky Mountain views, bustling city life, and a climate with distinct seasons. Omaha, located in Nebraska, brims with mid-west charm, agricultural prosperity, and a more intimate city experience. Both cities have their particular appeals whether tourism, relocation, or general lifestyle is the focus.
Distance between
Denver, CO and
Omaha, NE : 481.9 miles
Denver's population is larger by 46%. Its population has grown by 156,827 people (28.3%) since 2000. The population of Omaha has grown by 97,293 people (24.9%) during that time.
Denver and Omaha show differences in terms of safety and crime. Denver, due to its larger population and metropolitan nature, has higher crime rates compared to the national average. It's important for locals and tourists alike to stay mindful of their surroundings, especially in densely populated areas. Omaha, on the other hand, experiences lower crime rates overall, but certain areas do see more activity than others. Both cities have implemented community-oriented police strategies in an effort to prevent crime and increase safety.
City-data.com crime index counts serious crimes and violent crime more heavily. It adjusts for the number of visitors and daily workers commuting into cities. (higher means more crime, U.S. average = 301.1)
City-data.com crime index counts serious crimes and violent crime more heavily. It adjusts for the number of visitors and daily workers commuting into cities. (higher means more crime, U.S. average = 301.1)
Sex Offenders
According to our data, there are 1,932 registered sex offenders living in Denver and 1,375 registered sex offenders living in . The ratio of residents to sex offenders in Denver is 359 to 1; the ratio in Omaha is 325 to 1. The number of registered sex offenders compared to the number of residents in Denver is near to than in Omaha.
Cost of Living
The cost of living in Denver is significantly higher than in Omaha. Everything from housing, groceries, to healthcare costs more in Denver. The increased costs often correspond with a higher income level in Denver. On the contrary, Omaha is recognized for its affordability, making it an attractive location for people looking for a lower cost of living.
Income Tax
Another distinction between the two is the income tax rate. Denver residents pay progressive state income tax, while Nebraska, where Omaha is located, has a series of income tax brackets.
Property Tax
Property taxes are generally higher in Omaha, partly due to its lower housing costs. In Denver, property taxes are generally lower, though higher housing prices may balance this out.
Sales Tax
Denver's sales tax rate is higher than Omaha's. Combining city and state sales tax, Denver sits at 8.31%, while Omaha has a combined rate of 7.0%.
Income
Type
Denver
Omaha
Estimated median household income
$81,630
$62,948
Estimated per capita income
$52,690
$38,062
Cost of living index (U.S. average is 100)
111.3
89.4
If you make $50,000 in Omaha, you will have to make $62,248 in Denver to maintain the same standard of living.
Geographical Conditions
Denver's location at the foothills of the Rocky Mountains offers stunning landscapes and outdoor recreational opportunities. Omaha, nestled on the Missouri River, also provides ample green spaces and recreational activities.
Both Denver and Omaha value education, though their key areas of strength differ. Denver is home to several prestigious universities and has a strong job market for educators. Omaha's public school system is highly regarded, and the city is also home to the esteemed University of Nebraska.
Denver has a thriving economy with strong job markets in tech, aerospace, and healthcare. Omaha, being an agricultural powerhouse, has a robust economy with strengths in finance, insurance, and trade. Unemployment rates in both cities tend to mirror the national average.
Biggest Employers
Denver's biggest employers come from diverse sectors including healthcare (Denver Health), education (Denver Public Schools), technology and aerospace (Lockheed Martin). In Omaha, the biggest employers are job-rich sectors like finance (Berkshire Hathaway), military (Offutt Air Force base), and healthcare (Nebraska Medicine).
There were 1,550 building permits issued in Denver in 2012 (847 more than in 2011) compared to 1,620 building permits issued in Omaha in 2012 (460 more than in 2011).
In Denver (Denver County), 73.9% voted for Democrats and 24.3% for Republicans in 2012 Presidential Election. In Omaha (Douglas County), 47.5% voted for Democrats and 50.6% for Republicans.
Elections
Type
Democrats
Republicans
Other
Year
Denver
Omaha
Denver
Omaha
Denver
Omaha
2020
80.1%
54.4%
18.3%
43.1%
1.6%
2.5%
2016
74.2%
47.3%
19.0%
45.0%
6.8%
7.7%
2012
73.9%
47.5%
24.3%
50.6%
1.7%
1.9%
2008
75.8%
51.7%
23.2%
47.0%
1.0%
1.3%
2004
69.7%
40.4%
29.3%
58.6%
0.9%
1.0%
2000
62.0%
40.1%
30.9%
55.2%
7.0%
4.7%
1996
61.8%
39.3%
30.0%
51.4%
8.2%
9.3%
Breakdown of population affiliated with a religious congregation
Type
Adherents
Congregations
Religion
Denver
Omaha
Denver
Omaha
CATHOLIC CHURCH
26.6%
24.0%
8.7%
11.8%
AMERICAN BAPTIST CHURCHES IN THE USA
2.1%
0.5%
4.3%
2.8%
EPISCOPAL CHURCH
1.1%
0.5%
3.2%
1.4%
SALVATION ARMY
1.1%
0.4%
0.7%
0.9%
SOUTHERN BAPTIST CONVENTION
0.9%
1.5%
6.8%
5.2%
SEVENTH DAY ADVENTIST CHURCH
0.7%
0.3%
3.0%
1.7%
MUSLIM ESTIMATE
0.5%
0.9%
0.9%
0.7%
EVANGELICAL LUTHERAN CHURCH IN AMERICA
0.4%
4.1%
2.7%
6.6%
LUTHERAN CHURCH
0.3%
2.5%
2.3%
4.3%
Weather
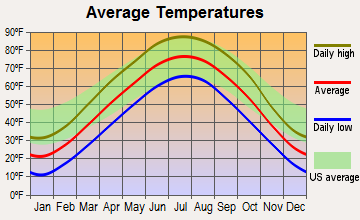
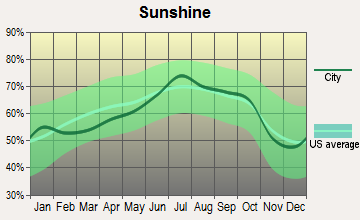
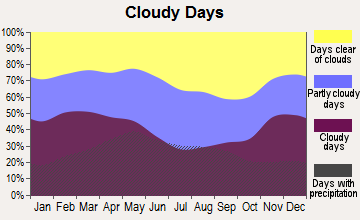
Climate between the two cities varies greatly. Denver offers a semi-arid continental climate with four distinct seasons. While winters can be snowy, Denver boasts 300 days of sunshine per year. Omaha's climate is classified as humid continental, experiencing cold, snowy winters and hot, humid summers. It's ideal for those who appreciate a rich variety of seasonal experiences.
Weather and climate
Type
Denver
Omaha
Temperature - Average
49.5°F
50.6°F
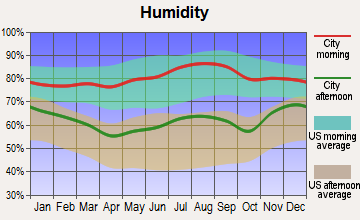
Humidity - Average morning or afternoon humidity
50.6%
75.9%
Humidity - Differences between morning and afternoon humidity
20%
35%
Humidity - Maximum monthly morning or afternoon humidity
55%
87%
Humidity - Minimum monthly morning or afternoon humidity
35%
52%
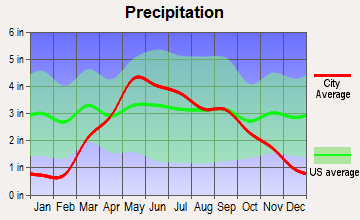
Precipitation - Yearly average
17 in
30 in
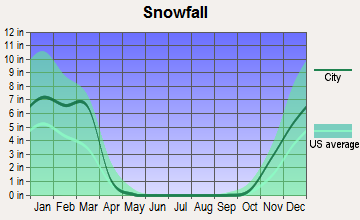
Snowfall - Yearly average
114 in
57.2 in
Clouds - Number of days clear of clouds
19.2%
18.4%
Sunshine amount - Average
75.6%
66.7%
Sunshine amount - Differences during a year
10%
27%
Sunshine amount - Maximum monthly
74%
74%
Sunshine amount - Minimum monthly
64%
47%
Wind speed - Average
8.6 mph
10.8 mph
Average climate in Denver, Colorado
Average climate in Omaha, Nebraska
Air pollution
Type
AQI
CO
NO2
OZONE
PB
PM10
PM25
SO2
Year
Denver
Omaha
Denver
Omaha
Denver
Denver
Omaha
Denver
Omaha
Denver
Omaha
Denver
Omaha
Denver
Omaha
2018
100
75
0.50
0.18
25.4
N/A
27.9
26.7
N/A
N/A
29.2
19.3
8.6
8.4
0.7
0.5
2017
95
76
0.49
0.19
25.9
N/A
27.6
26.3
N/A
N/A
22.0
21.6
8.4
9.6
0.8
0.9
2016
90
80
0.53
0.18
27.7
N/A
27.2
26.3
N/A
N/A
22.6
19.3
8.7
8.1
1.0
0.7
2015
101
79
0.53
0.20
27.8
N/A
25.2
26.9
N/A
N/A
21.0
20.3
10.4
9.3
1.0
0.9
2014
94
80
0.53
0.23
25.4
N/A
24.6
27.9
N/A
N/A
25.1
23.5
10.1
8.8
1.3
1.2
2013
85
79
0.45
0.20
21.9
N/A
24.0
28.0
N/A
N/A
24.4
26.9
N/A
9.3
1.5
1.4
2012
91
100
0.33
0.21
18.9
N/A
26.2
27.1
N/A
N/A
24.9
39.0
N/A
8.4
1.4
1.6
2011
91
96
0.34
0.21
18.1
N/A
25.8
25.4
N/A
N/A
23.7
32.9
N/A
9.2
1.6
1.6
2010
82
102
0.43
N/A
16.3
N/A
23.6
28.0
N/A
N/A
26.4
43.2
N/A
10.5
1.0
2.1
2009
79
73
0.41
N/A
14.1
N/A
23.1
24.3
0.005
N/A
22.2
28.7
N/A
N/A
1.3
1.8
2008
85
104
0.43
N/A
17.3
N/A
26.0
26.9
0.008
N/A
25.2
45.0
N/A
18.9
1.6
1.1
2007
96
109
0.37
0.51
20.6
N/A
21.9
29.0
0.007
N/A
30.2
N/A
N/A
16.5
1.2
1.7
2006
89
86
0.51
0.50
19.0
N/A
22.1
30.0
0.008
N/A
28.0
N/A
N/A
13.0
1.4
1.3
2005
86
78
0.57
0.47
21.3
N/A
20.9
32.8
0.068
N/A
30.9
N/A
N/A
12.9
1.5
2.8
2004
82
51
0.60
0.44
21.2
N/A
19.2
30.9
0.012
N/A
28.6
N/A
N/A
N/A
1.8
1.5
2003
106
50
0.60
0.43
21.2
N/A
20.8
26.6
0.015
N/A
32.6
N/A
N/A
N/A
1.9
0.7
2002
86
48
0.65
0.38
19.2
N/A
20.4
27.6
0.014
0.030
35.7
N/A
N/A
N/A
2.5
1.1
2001
95
39
0.86
0.35
23.6
N/A
18.6
25.0
0.012
0.038
32.6
N/A
N/A
N/A
2.6
0.4
2000
93
44
0.81
0.50
13.4
N/A
19.2
26.1
0.013
0.049
12.2
N/A
N/A
N/A
2.1
0.5
Natural disasters
Type
Denver
Omaha
Tornado activity compared to U.S. average
129.5%
191.9%
Earthquake activity compared to U.S. average
811.7%
415.1%
Natural disasters compared to U.S. average
10%
21%
Transportation
Denver has a comprehensive public transit system, including buses, light rail, and commuter train services. Omaha's public transit options are more limited, primarily consisting of bus services, but there are ongoing efforts to expand.
Transport
Type
Denver
Omaha
Amtrak stations
2
1
Amtrak stations nearby
2
1
FAA registered aircraft
602
405
FAA registered aircraft manufacturers and dealers
28
24
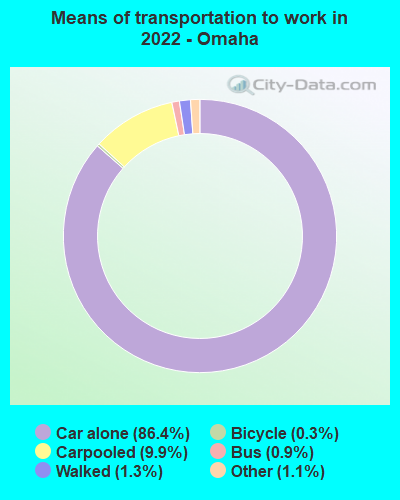
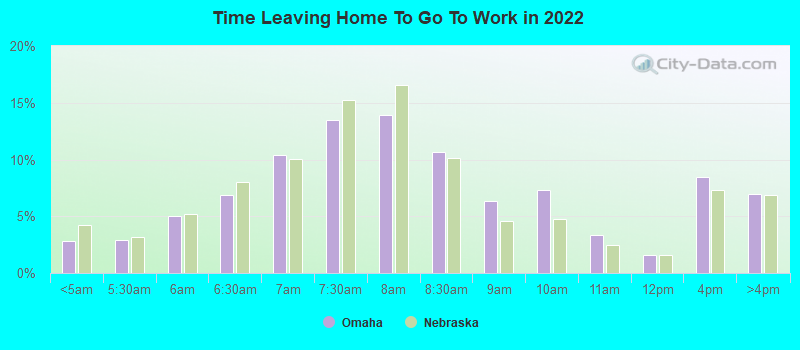
Means of transportation to work
Type
Denver
Omaha
Bicycle
1.5%
0.2%
Bus
2.6%
0.7%
Carpooled
8.8%
8.2%
Car alone
81.1%
87.8%
Railroad
1.2%
0%
Streetcar
0.2%
0%
Taxicab
0.1%
0.1%
Walked
2.8%
2%
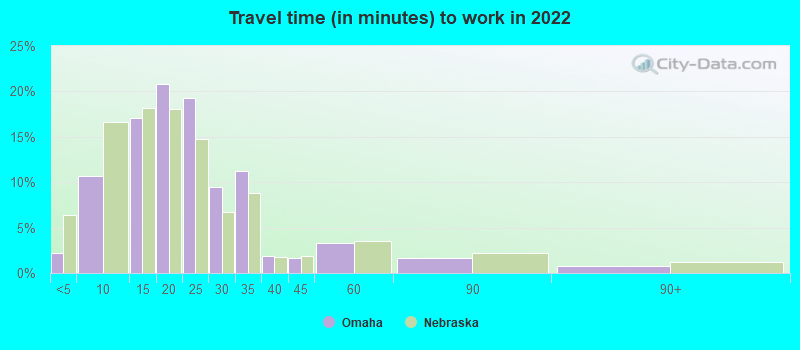
Average travel time to work
Type
Denver
Omaha
Average
29.4 min
22.5 min
Other means
24.2 min
18.8 min
Public transportation
38 min
39 min
Private vehicle occupancy
Type
Denver
Omaha
Average
1.1
1.1
Drove alone
90.6%
90.4%
In 2 person carpool
7.3%
6.9%
In 3 person carpool
1.3%
1.4%
In 4 person carpool
0.5%
0.7%
In 5-6 person carpool
0.2%
0.6%
How many people usually rode to work in the car, truck or van.
Real Estate
Real estate prices in Denver are significantly higher than in Omaha, reflecting its popularity and thriving economic growth. Omaha offers more affordable housing options, making it an appealing destination for those seeking homeownership without the hefty price tag.
Neighborhoods
Denver offers diverse neighborhoods ranging from hip locales like Capitol Hill to family-friendly suburbs such as Cherry Creek. Omaha's neighborhoods also vary from the historic and artsy Old Market to the upscale Midtown Crossing.
Houses and residents
Type
Denver
Omaha
Houses
351,829
212,802
Average household size (people)
2.2
2.5
Median year apartment built
1981
1976
Median year house/condo built
1966
1970
Length of stay in the house since moving in
11.3 years
13.3 years
Houses occupied
326,634 (92.8%)
201,469 (94.7%)
Houses occupied by owners
164,429 (50.3%)
117,404 (58.3%)
Houses occupied by renters
162,205 (49.7%)
84,065 (41.7%)
Median rent asked for vacant for-rent units
$1,674
$892.09
Median monthly housing costs
$1,626
$1,119
Median price asked for vacant for-sale houses and condos
$970,375
$261,376
Estimated median house or condo value
$541,500
$211,900
Median numbers of rooms
4.6
5.8
Median number of rooms in apartments
3.5
4
Median number of rooms in houses and condos
6.4
7.1
Median house price - detached houses
$690,450
$249,098
Median house price - in 2-unit structures
$668,727
$191,723
Median house price - in 3-to-4-unit structures
$410,273
$100,661
Median house price - in 5 or more unit structures
$487,647
$319,464
Median house price - mobile homes
$174,140
$35,876
Median house price - Townhouses or other attached units
$568,100
$186,544
Median house price - All housing units
$644,007
$246,177
Median house age
47
49
Renting percentage
50%
41.7%
Housing density (houses/condos per square mile)
2,294.3
1,839.2
House value disparities
26.4%
33.1%
Household income disparities
44%
45.6%
Median household income for houses/condes with a mortgage
$120,615
$98,149
Median household income for apartments without a mortgage
$77,011
$71,454
Housing units without a mortgage
2,112 (1.7%)
2,417 (2.9%)
Housing units with both a second mortgage and home equity loan
9,615 (7.6%)
7,375 (8.9%)
Housing units with a mortgage
123,690 (98.3%)
80,503 (97.1%)
Housing units with a home equity loan
273 (0.2%)
335 (0.4%)
Housing units with a second mortgage
12,819 (10.2%)
9,200 (11.1%)
House/condo owner moved in on average (years ago)
7
12
House/condo renter moved in on average (years ago)
1
1
Housing units lacking complete kitchen facilities
1.3%
1.6%
Housing units lacking complete plumbing facilities
0.8%
0.7%
Housing units in structures
Housing units in structures
Denver
Omaha
One, detached
42.9%
63.2%
One, attached
8.3%
3.9%
Two
2.1%
1.5%
3 or 4
3.1%
2.2%
5 to 9
3.6%
6.8%
10 to 19
7.0%
8.3%
20 to 49
10.4%
5.3%
50 or more
22.0%
8.1%
Mobile homes
0.4%
0.6%
Boats, RVs, vans, etc.
0.1%
0.0%
Median real estate property taxes paid for housing units
Self-employed workers in own not incorporated business
24,661
11,886
State government workers
15,204
7,835
Unpaid family workers
763
205
Industries and Occupations
Denver's major industries include technology, aerospace, and healthcare, while Omaha's economy leans more towards finance, insurance, and trade. This difference in industries leads to similarly varied occupations between the two cities.
Denver has an advanced healthcare sector, featuring some of the top hospitals in the country. Omaha is no stranger to quality healthcare either, with the renowned Nebraska Medicine Hospital based in the city.
Health (county statistics)
Type
Denver
Omaha
General health status score of residents in this county from 1 (poor) to 5 (excellent)
Denver's infrastructure is designed for a larger population, with a comprehensive public transit system, extensive freeway network, and large public spaces. Omaha's infrastructure, while not as extensive, is effective for its more intimate population and includes freeways and a bus transit system. Both cities have international airports and freight rail services.
Infrastructure
Type
Denver
Omaha
Hospitals
16
23
TV stations
17
19
Arenas or stadiums
4
2
Bank branches located here
205
183
Bank institutions located here
43
31
Main business address for public companies
58
30
Nuclear power plants nearby
0
1
Drinking water stations with no reported violations in the past
8
8
Drinking water stations with reported violations in the past
HMDA - Conventional home purchase loans - Applications denied
Year
Denver
Omaha
1999
2,727
1,177
2000
2,698
545
2001
1,996
390
2002
1,591
441
2003
2,472
747
2004
3,789
1,022
2005
5,168
1,055
2006
5,506
1,083
2007
3,599
646
2008
1,902
318
2009
768
220
Culture and Food
Denver is known for its outdoorsy culture coupled with a bustling arts and music scene. It's a city of microbreweries, gourmet food trucks, and diverse eateries. Omaha blends Midwestern warmth with an energetic cultural scene, renowned for its world-class steakhouses and comfort food.
Sports Teams
Denver, home to NFL's Broncos, MLB's Rockies, NBA's Nuggets, and NHL's Avalanche, is a vibrant sports city. Omaha may not have any major league teams, but it does host the annual College World Series and boasts a devoted following for its local minor league and college teams.


 Denver, CO
 Omaha, NE