Denver, the Mile-High City, and Salt Lake City, the Crossroads of the West, both offer unique experiences and lifestyle opportunities. With the Rocky Mountains as their backdrop, these cities share similarities while maintaining distinct cultural atmospheres. Here's a detailed comparison of living in Denver and Salt Lake City across myriad factors, including crime rates, cost of living, education, and more.
Distance between
Denver, CO and
Salt Lake City, UT : 372.1 miles
Denver's population is larger by 255%. Its population has grown by 156,827 people (28.3%) since 2000. The population of Salt Lake City has grown by 18,735 people (10.3%) during that time.
Denver and Salt Lake City show similarities in crime rates, both somewhat higher on a national scale. However, it depends heavily on specific neighborhood conditions. In Denver, crime rates tend to higher downtown while suburban areas of the city are safer. Similarly, in Salt Lake City, crime rates are lower in the suburban areas compared to the city center.
City-data.com crime index counts serious crimes and violent crime more heavily. It adjusts for the number of visitors and daily workers commuting into cities. (higher means more crime, U.S. average = 301.1)
City-data.com crime index counts serious crimes and violent crime more heavily. It adjusts for the number of visitors and daily workers commuting into cities. (higher means more crime, U.S. average = 301.1)
Sex Offenders
According to our data, there are 1,937 registered sex offenders living in Denver and 977 registered sex offenders living in . The ratio of residents to sex offenders in Denver is 358 to 1; the ratio in Salt Lake City is 198 to 1. The number of registered sex offenders compared to the number of residents is a smaller in Denver than in Salt Lake City.
Cost of Living
Denver's cost of living is higher than the national average, given the higher housing costs. Salt Lake City, while still higher than the national average, is comparatively cheaper, particularly in housing, making it more attractive for potential relocations.
Income Tax
Denver's state income tax is a flat 4.63%, while Salt Lake City, Utah, has a slightly higher flat rate of 4.95%.
Property Tax
Property taxes are lower in Denver with an effective rate of 0.54%, while Salt Lake City's is slightly higher at 0.68%.
Sales Tax
The sales tax in Denver is higher, at 8.31%, compared to Salt Lake City's 7.75%. Both cities' sales taxes are higher than the national average.
Income
Type
Denver
Salt Lake City
Estimated median household income
$81,630
$66,658
Estimated per capita income
$52,690
$44,033
Cost of living index (U.S. average is 100)
111.3
94.9
If you make $50,000 in Salt Lake City, you will have to make $58,641 in Denver to maintain the same standard of living.
Geographical Conditions
Both cities are situated near mountains, giving residents easy access to outdoor activities. Denver's altitude (one mile above sea level) sometimes causes mild altitude sickness. Salt Lake City is known for the Great Salt Lake and its ski-friendly mountains.
Both cities boast high-quality educational institutions. Denver has renowned school districts and hosts top ranking universities like the University of Denver. Salt Lake City is home to the University of Utah and other reputable schools. In terms of public schooling, both cities offer quality education, although Salt Lake City outranks Denver slightly.
Denver's growing economy boasts booming sectors like technology, aerospace, and healthcare; Denver is also a substantial hub for the telecom industry. Conversely, Salt Lake City's economy is stronger in sectors like information technology, healthcare, and finance. Both cities maintain low unemployment rates, showing robust local economies.
Biggest Employers
Denver's top employers include the University of Colorado system and HealthONE Corporation. In Salt Lake City, Intermountain Healthcare and the University of Utah are prominent employers.
There were 1,550 building permits issued in Denver in 2012 (847 more than in 2011) compared to 172 building permits issued in Salt Lake City in 2012 (144 more than in 2011).
In Denver (Denver County), 73.9% voted for Democrats and 24.3% for Republicans in 2012 Presidential Election. In Salt Lake City (Salt Lake County), 38.1% voted for Democrats and 58.4% for Republicans.
Elections
Type
Democrats
Republicans
Other
Year
Denver
Salt Lake City
Denver
Salt Lake City
Denver
Salt Lake City
2020
80.1%
53.3%
18.3%
42.3%
1.6%
4.4%
2016
74.2%
41.7%
19.0%
32.7%
6.8%
25.6%
2012
73.9%
38.1%
24.3%
58.4%
1.7%
3.5%
2008
75.8%
48.2%
23.2%
48.2%
1.0%
3.6%
2004
69.7%
37.6%
29.3%
59.7%
0.9%
2.7%
2000
62.0%
35.1%
30.9%
55.9%
7.0%
9.0%
1996
61.8%
41.9%
30.0%
45.5%
8.2%
12.5%
Breakdown of population affiliated with a religious congregation
Type
Adherents
Congregations
Religion
Denver
Salt Lake City
Denver
Salt Lake City
CATHOLIC CHURCH
26.6%
8.2%
8.7%
1.4%
AMERICAN BAPTIST CHURCHES IN THE USA
2.1%
0.1%
4.3%
0.2%
EPISCOPAL CHURCH
1.1%
0.3%
3.2%
0.4%
SALVATION ARMY
1.1%
0.0%
0.7%
0.1%
SOUTHERN BAPTIST CONVENTION
0.9%
0.5%
6.8%
1.3%
SEVENTH DAY ADVENTIST CHURCH
0.7%
0.1%
3.0%
0.4%
MUSLIM ESTIMATE
0.5%
0.4%
0.9%
0.4%
EVANGELICAL LUTHERAN CHURCH IN AMERICA
0.4%
0.1%
2.7%
0.3%
LUTHERAN CHURCH
0.3%
0.2%
2.3%
0.3%
Weather
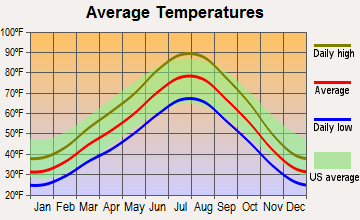
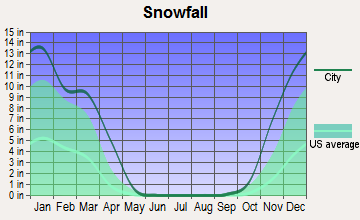
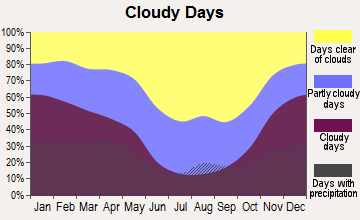
Moderate climates are common to both cities, though Denver experiences more extreme temperatures. Known for its 300 sunny days, Denver has hot summers and cold winters, while Salt Lake City has moderately hot summers and cold, snowy winters. Salt Lake City experiences more snowy days than Denver, which may appeal to winter enthusiasts.
Weather and climate
Type
Denver
Salt Lake City
Temperature - Average
49.5°F
54.1°F
Humidity - Average morning or afternoon humidity
50.6%
57.5%
Humidity - Differences between morning and afternoon humidity
20%
57%
Humidity - Maximum monthly morning or afternoon humidity
55%
78%
Humidity - Minimum monthly morning or afternoon humidity
35%
21%
Precipitation - Yearly average
17 in
17.8 in
Snowfall - Yearly average
114 in
117.2 in
Clouds - Number of days clear of clouds
19.2%
20.8%
Sunshine amount - Average
75.6%
72.4%
Sunshine amount - Differences during a year
10%
46%
Sunshine amount - Maximum monthly
74%
85%
Sunshine amount - Minimum monthly
64%
39%
Wind speed - Average
8.6 mph
9.1 mph
Average climate in Denver, Colorado
Average climate in Salt Lake City, Utah
Air pollution
Type
AQI
CO
NO2
OZONE
PB
PM10
PM25
SO2
Year
Denver
Salt Lake City
Denver
Salt Lake City
Denver
Salt Lake City
Denver
Salt Lake City
Denver
Salt Lake City
Denver
Denver
Salt Lake City
Denver
Salt Lake City
2018
100
98
0.50
0.21
25.4
15.6
27.9
29.9
N/A
N/A
29.2
N/A
8.6
8.5
0.7
0.4
2017
95
102
0.49
0.30
25.9
13.8
27.6
31.6
N/A
N/A
22.0
N/A
8.4
8.0
0.8
0.3
2016
90
99
0.53
N/A
27.7
17.2
27.2
29.1
N/A
N/A
22.6
N/A
8.7
8.2
1.0
N/A
2015
101
85
0.53
0.35
27.8
14.9
25.2
29.2
N/A
N/A
21.0
N/A
10.4
7.4
1.0
0.3
2014
94
82
0.53
0.36
25.4
15.1
24.6
26.8
N/A
N/A
25.1
N/A
10.1
7.5
1.3
0.5
2013
85
95
0.45
0.36
21.9
18.0
24.0
27.4
N/A
N/A
24.4
N/A
N/A
10.7
1.5
1.4
2012
91
89
0.33
0.35
18.9
16.2
26.2
29.5
N/A
N/A
24.9
N/A
N/A
7.3
1.4
1.5
2011
91
87
0.34
0.34
18.1
18.1
25.8
27.5
N/A
N/A
23.7
N/A
N/A
7.9
1.6
1.5
2010
82
106
0.43
N/A
16.3
16.1
23.6
26.4
N/A
N/A
26.4
N/A
N/A
10.9
1.0
4.1
2009
79
105
0.41
0.47
14.1
18.3
23.1
26.0
0.005
N/A
22.2
N/A
N/A
12.5
1.3
4.0
2008
85
102
0.43
0.56
17.3
21.8
26.0
24.6
0.008
N/A
25.2
N/A
N/A
12.0
1.6
2.3
2007
96
108
0.37
0.63
20.6
23.4
21.9
25.4
0.007
N/A
30.2
N/A
N/A
13.2
1.2
1.8
2006
89
100
0.51
0.55
19.0
22.1
22.1
27.0
0.008
N/A
28.0
N/A
N/A
9.6
1.4
2.2
2005
86
91
0.57
0.64
21.3
23.5
20.9
N/A
0.068
0.039
30.9
N/A
N/A
N/A
1.5
3.0
2004
82
78
0.60
0.64
21.2
25.4
19.2
N/A
0.012
0.043
28.6
N/A
N/A
N/A
1.8
4.2
2003
106
80
0.60
0.80
21.2
24.2
20.8
N/A
0.015
0.035
32.6
N/A
N/A
N/A
1.9
4.8
2002
86
92
0.65
0.70
19.2
27.1
20.4
N/A
0.014
0.016
35.7
N/A
N/A
N/A
2.5
3.6
2001
95
88
0.86
0.82
23.6
26.5
18.6
N/A
0.012
0.029
32.6
N/A
N/A
N/A
2.6
4.0
2000
93
96
0.81
0.94
13.4
26.5
19.2
N/A
0.013
0.044
12.2
N/A
N/A
N/A
2.1
4.2
Natural disasters
Type
Denver
Salt Lake City
Tornado activity compared to U.S. average
129.5%
10%
Earthquake activity compared to U.S. average
811.7%
2,272.3%
Natural disasters compared to U.S. average
10%
9%
Transportation
Both cities offer robust public transportation. Denver boasts a light-rail system and buses, while Salt Lake City operates a light rail system, commuter trains, and buses. Traffic tends to be less congested in Salt Lake City compared to Denver.
Transport
Type
Denver
Salt Lake City
Amtrak stations
2
1
Amtrak stations nearby
2
1
FAA registered aircraft
602
0
FAA registered aircraft manufacturers and dealers
28
0
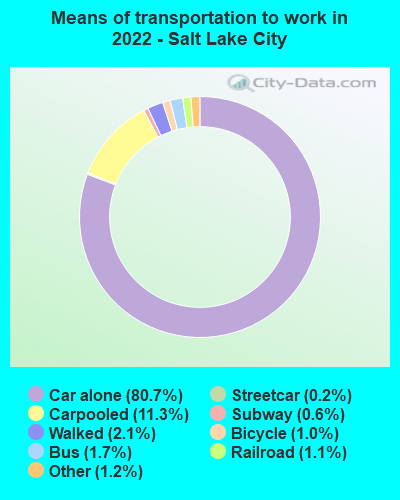
Means of transportation to work
Type
Denver
Salt Lake City
Bicycle
1.5%
1.2%
Bus
2.6%
2.3%
Carpooled
8.8%
9.9%
Car alone
81.1%
81%
Ferryboat
0%
0.1%
Motorcycle
0.1%
0.2%
Railroad
1.2%
1.1%
Streetcar
0.2%
0.2%
Subway
0.1%
0.6%
Taxicab
0.1%
0.1%
Walked
2.8%
2.4%
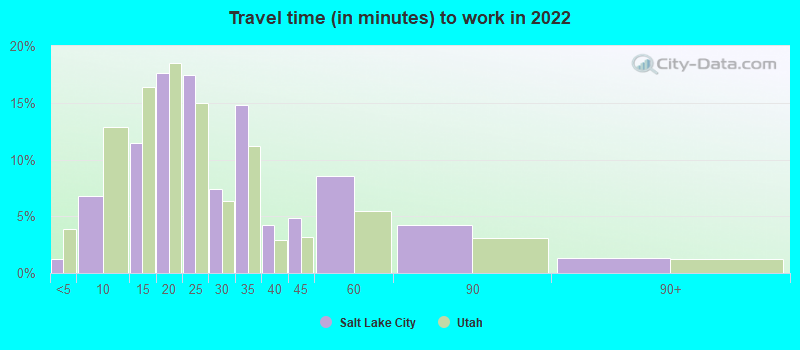
Average travel time to work
Type
Denver
Salt Lake City
Average
29.4 min
27.8 min
Other means
24.2 min
19.7 min
Public transportation
38 min
34.7 min
Private vehicle occupancy
Type
Denver
Salt Lake City
Average
1.1
1.2
Drove alone
90.6%
90.2%
In 2 person carpool
7.3%
7.1%
In 3 person carpool
1.3%
1.8%
In 4 person carpool
0.5%
0.3%
In 5-6 person carpool
0.2%
0.2%
In 7+ person carpool
0%
0.3%
How many people usually rode to work in the car, truck or van.
Real Estate
Real estate in Denver is more expensive than Salt Lake City, reflecting its higher cost of living. Salt Lake City offers more affordable housing options, but prices have been steadily increasing, driven by high demand and lower inventory.
Neighborhoods
Denver neighborhoods offer distinctive vibes, from the artsy Capitol Hill to the hip LoHi neighborhood. Salt Lake City is known for its family-friendly neighborhoods, such as Sugar House and The Avenues, each offering unique architectural styles.
Houses and residents
Type
Denver
Salt Lake City
Houses
351,829
99,551
Average household size (people)
2.2
2.4
Median year apartment built
1981
1974
Median year house/condo built
1966
1948
Length of stay in the house since moving in
11.3 years
13.4 years
Houses occupied
326,634 (92.8%)
89,839 (90.2%)
Houses occupied by owners
164,429 (50.3%)
42,681 (47.5%)
Houses occupied by renters
162,205 (49.7%)
47,158 (52.5%)
Median rent asked for vacant for-rent units
$1,674
$1,183
Median monthly housing costs
$1,626
$1,212
Median price asked for vacant for-sale houses and condos
$970,375
$1,040,755
Estimated median house or condo value
$541,500
$459,800
Median numbers of rooms
4.6
4.6
Median number of rooms in apartments
3.5
3.5
Median number of rooms in houses and condos
6.4
6.8
Median house price - detached houses
$690,450
$670,211
Median house price - in 2-unit structures
$668,727
$557,731
Median house price - in 3-to-4-unit structures
$410,273
$286,131
Median house price - in 5 or more unit structures
$487,647
$392,695
Median house price - mobile homes
$174,140
$16,446
Median house price - Townhouses or other attached units
$568,100
$508,996
Median house price - All housing units
$644,007
$618,525
Median house age
47
60
Renting percentage
50%
51.6%
Housing density (houses/condos per square mile)
2,294.3
912.6
House value disparities
26.4%
28.9%
Household income disparities
44%
45.4%
Median household income for houses/condes with a mortgage
$120,615
$104,234
Median household income for apartments without a mortgage
$77,011
$76,183
Housing units without a mortgage
2,112 (1.7%)
515 (1.8%)
Housing units with both a second mortgage and home equity loan
9,615 (7.6%)
2,740 (9.6%)
Housing units with a mortgage
123,690 (98.3%)
28,000 (98.2%)
Housing units with a home equity loan
273 (0.2%)
0 (0%)
Housing units with a second mortgage
12,819 (10.2%)
3,493 (12.2%)
House/condo owner moved in on average (years ago)
7
10
House/condo renter moved in on average (years ago)
1
1
Housing units lacking complete kitchen facilities
1.3%
1.8%
Housing units lacking complete plumbing facilities
0.8%
1.8%
Housing units in structures
Housing units in structures
Denver
Salt Lake City
One, detached
42.9%
46.3%
One, attached
8.3%
3.4%
Two
2.1%
5.2%
3 or 4
3.1%
5.4%
5 to 9
3.6%
4.0%
10 to 19
7.0%
5.9%
20 to 49
10.4%
10.8%
50 or more
22.0%
17.7%
Mobile homes
0.4%
1.2%
Boats, RVs, vans, etc.
0.1%
0.0%
Median real estate property taxes paid for housing units
Self-employed workers in own not incorporated business
24,661
4,972
State government workers
15,204
11,071
Unpaid family workers
763
177
Industries and Occupations
In Denver, prominent industries are technology, aerospace, telecommunications, and healthcare. Salt Lake City features a similar landscape with thriving tech, healthcare, and finance sectors.
Both cities have top-notch healthcare facilities. Denver is home to the renowned University of Colorado Hospital, and Salt Lake City houses the University of Utah Hospital.
Health (county statistics)
Type
Denver
Salt Lake City
General health status score of residents in this county from 1 (poor) to 5 (excellent)
Denver's infrastructure is highly developed, with a focus on green spaces and walkability. It has more parks per resident compared to other U.S. cities. Salt Lake City, on the other hand, is also well-planned but is known for its wide streets and grid-like structure.
Infrastructure
Type
Denver
Salt Lake City
Hospitals
16
21
TV stations
17
15
Arenas or stadiums
4
3
Bank branches located here
205
141
Bank institutions located here
43
37
Main business address for public companies
58
30
Drinking water stations with no reported violations in the past
8
10
Drinking water stations with reported violations in the past
HMDA - Conventional home purchase loans - Applications denied
Year
Denver
Salt Lake City
1999
2,727
830
2000
2,698
716
2001
1,996
562
2002
1,591
478
2003
2,472
664
2004
3,789
1,123
2005
5,168
1,518
2006
5,506
1,480
2007
3,599
1,064
2008
1,902
434
2009
768
189
Culture and Food
Denver and Salt Lake City both offer vibrant cultures. Denver is famed for its breweries and culinary scene, and Salt Lake City is known for its outdoor recreational activities, museums, and family-friendly attractions. Both cities have a growing foodie culture with wide-ranging cuisines.
Sports Teams
Denver is home to four major league sports teams, including the Broncos (NFL), Nuggets (NBA), Rockies (MLB), and Avalanche (NHL). Salt Lake City has the Jazz (NBA) and Real Salt Lake (MLS).


 Denver, CO
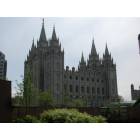
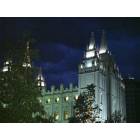
 Salt Lake City, UT