Comparing Detroit, MI to Norfolk, VA, there's a notable difference in the atmosphere, cost of living, and general lifestyle. These contrasting cities offer diverse experiences whether as a resident or a tourist, presenting a broad range of conditions from the economic climate to the physical environment. This comprehensive comparison of these cities will provide insights into life, work, education and leisure in both locations.
Distance between
Detroit, MI and
Norfolk, VA : 526.0 miles
Detroit's population is larger by 169%. Its population has decreased by 318,806 people (33.5%) since 2000. The population of Norfolk has grown by 686 people (0.3%) during that time.
Detroit has experienced high crime rates but concerted efforts have brought about a measure of improvement in recent times. However, safety issues still exist, considerably higher than the national average. In contrast, Norfolk, VA exhibits a lower crime rate, although it's also above the national average, it’s safer compared to Detroit.
City-data.com crime index counts serious crimes and violent crime more heavily. It adjusts for the number of visitors and daily workers commuting into cities. (higher means more crime, U.S. average = 301.1)
City-data.com crime index counts serious crimes and violent crime more heavily. It adjusts for the number of visitors and daily workers commuting into cities. (higher means more crime, U.S. average = 301.1)
Sex Offenders
According to our data, there are 3,446 registered sex offenders living in Detroit and 868 registered sex offenders living in . The ratio of residents to sex offenders in Detroit is 195 to 1; the ratio in Norfolk is 282 to 1. The number of registered sex offenders compared to the number of residents is larger in Detroit than in Norfolk.
Cost of Living
The cost of living is moderately lower in Detroit compared to Norfolk, mainly due to the lower cost of housing. Other essentials, like groceries, healthcare, and transportation, are also somewhat more affordable in Detroit.
Income Tax
Michigan has a flat state income tax rate of 4.25%, while Detroit applies an additional city income tax of 2.4% for residents. In contrast, Virginia employs a progressive state tax system with rates ranging from 2% to 5.75%. Norfolk doesn’t have a city income tax.
Property Tax
Property taxes are considerably higher in Detroit compared to Norfolk. Detroit has a rate of 49.461 mills for homes, while Norfolk’s rate stands at 1.25%.
Sales Tax
The combined sales tax in Detroit (Michigan) is 6% while in Norfolk (Virginia) it's slightly higher at 6.3%.
Income
Type
Detroit
Norfolk
Estimated median household income
$36,140
$58,591
Estimated per capita income
$22,122
$33,362
Cost of living index (U.S. average is 100)
94.1
96.6
If you make $50,000 in Detroit, you will have to make $51,328 in Norfolk to maintain the same standard of living.
Geographical Conditions
Detroit is situated beside the Detroit River, offering a waterfront ambiance, whereas Norfolk is a coastal city facing the Chesapeake Bay, offering beaches and recreational boating options.
Both cities have well-established education systems. Detroit is home to Wayne State University and other notable institutions. Norfolk houses Old Dominion University and Norfolk State University among others. However, Norfolk's public school system is generally rated higher than Detroit's.
Detroit's economy has been historically linked to the auto industry with General Motors, Ford, and Fiat Chrysler being based here. Norfolk on the other hand has a more diversified economy with naval bases, healthcare, and education playing a significant role.
Biggest Employers
Detroit’s biggest employers are the Detroit Medical Center, General Motors, and Quicken Loans. In Norfolk, the major employers include the Naval Station Norfolk, Sentara Healthcare, and Norfolk Public Schools.
There were 10 building permits issued in Detroit in 2012 (8 less than in 2011) compared to 303 building permits issued in Norfolk in 2012 (78 more than in 2011).
In Detroit (Wayne County), 73.1% voted for Democrats and 26.2% for Republicans in 2012 Presidential Election. In Norfolk (Norfolk city), 72.5% voted for Democrats and 26.8% for Republicans.
Elections
Type
Democrats
Republicans
Other
Year
Detroit
Norfolk
Detroit
Norfolk
Detroit
Norfolk
2020
68.6%
71.7%
30.4%
26.1%
1.0%
2.2%
2016
66.6%
68.4%
29.4%
25.8%
4.0%
5.8%
2012
73.1%
72.5%
26.2%
26.8%
0.6%
0.8%
2008
74.4%
71.5%
24.7%
28.2%
0.9%
0.3%
2004
69.7%
61.7%
29.9%
37.4%
0.4%
0.9%
2000
69.1%
61.8%
29.1%
35.5%
1.8%
2.7%
1996
69.0%
62.6%
24.0%
31.1%
7.0%
6.3%
Breakdown of population affiliated with a religious congregation
Type
Adherents
Congregations
Religion
Detroit
Norfolk
Detroit
Norfolk
CATHOLIC CHURCH
16.3%
4.7%
11.2%
2.6%
MUSLIM ESTIMATE
3.7%
4.2%
2.9%
1.1%
AMERICAN BAPTIST CHURCHES IN THE USA
1.5%
3.4%
2.4%
3.7%
LUTHERAN CHURCH
1.2%
0.2%
3.9%
1.1%
EVANGELICAL LUTHERAN CHURCH IN AMERICA
0.7%
0.6%
2.8%
1.1%
EPISCOPAL CHURCH
0.4%
2.0%
2.5%
3.7%
SEVENTH DAY ADVENTIST CHURCH
0.4%
0.4%
1.4%
0.7%
SOUTHERN BAPTIST CONVENTION
0.4%
6.3%
3.2%
11.6%
PRESBYTERIAN CHURCH IN AMERICA
0.0%
0.3%
0.0%
1.5%
Weather
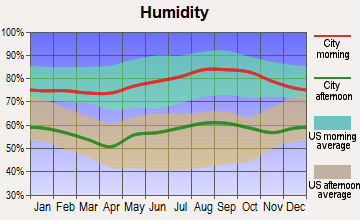
Detroit has a temperate climate with four distinct seasons, including warm summers and quite harsh winters with substantial snowfall. It's a stark contrast to Norfolk's humid subtropical climate, characterized by hot, humid summers and mild winters.
Weather and climate
Type
Detroit
Norfolk
Temperature - Average
50°F
59.6°F
Humidity - Average morning or afternoon humidity
75.3%
73%
Humidity - Differences between morning and afternoon humidity
33%
32%
Humidity - Maximum monthly morning or afternoon humidity
86%
83%
Humidity - Minimum monthly morning or afternoon humidity
53%
51%
Precipitation - Yearly average
33.6 in
46.3 in
Snowfall - Yearly average
86.5 in
15.4 in
Clouds - Number of days clear of clouds
12.7%
17.6%
Sunshine amount - Average
56.8%
66.8%
Sunshine amount - Differences during a year
38%
14%
Sunshine amount - Maximum monthly
69%
67%
Sunshine amount - Minimum monthly
31%
53%
Wind speed - Average
10.2 mph
10.4 mph
Average climate in Detroit, Michigan
Average climate in Norfolk, Virginia
Air pollution
Type
AQI
CO
NO2
OZONE
PB
PM25
SO2
Year
Detroit
Norfolk
Detroit
Norfolk
Detroit
Norfolk
Detroit
Norfolk
Detroit
Norfolk
Detroit
Norfolk
Detroit
Norfolk
2018
90
57
0.44
0.29
12.9
7.0
25.8
30.9
N/A
0.002
10.1
6.1
1.1
0.3
2017
87
60
0.56
0.23
12.7
7.6
20.9
33.0
N/A
0.002
10.1
6.9
1.3
0.3
2016
86
66
0.47
0.22
13.2
7.3
22.0
31.5
N/A
0.002
10.9
6.1
0.8
0.3
2015
95
57
0.49
0.27
14.8
8.1
26.5
33.5
N/A
0.002
11.9
6.4
1.2
0.5
2014
95
59
0.48
0.28
14.2
8.3
24.2
33.5
N/A
0.002
12.0
6.8
1.7
1.2
2013
80
66
0.53
0.28
14.4
7.8
24.5
30.9
N/A
0.002
11.0
6.8
1.3
1.2
2012
99
76
0.49
0.30
14.6
8.4
25.7
34.2
N/A
0.002
6.6
8.1
1.7
1.2
2011
94
66
0.32
0.27
12.9
10.2
24.3
34.8
N/A
0.003
6.5
8.8
1.6
1.7
2010
96
80
0.28
0.24
11.8
6.4
24.7
38.2
0.006
0.004
12.1
N/A
1.6
2.2
2009
68
54
0.27
0.24
12.7
9.8
23.4
31.5
N/A
0.012
N/A
N/A
1.9
2.5
2008
67
77
0.27
0.24
12.8
10.3
N/A
36.2
N/A
0.004
N/A
N/A
2.0
3.5
2007
81
81
0.29
0.17
13.7
12.2
25.8
36.4
0.017
0.004
N/A
N/A
N/A
4.6
2006
63
62
0.31
0.34
14.0
N/A
19.8
36.3
0.022
0.004
N/A
N/A
3.2
3.4
2005
83
67
0.36
0.28
17.4
N/A
22.6
35.5
0.019
N/A
N/A
N/A
4.0
3.5
2004
70
80
0.43
0.29
15.0
15.9
N/A
33.4
0.014
N/A
N/A
N/A
3.7
4.4
2003
86
84
0.40
0.33
18.5
16.2
N/A
34.3
0.013
N/A
N/A
N/A
4.8
4.1
2002
88
99
0.36
0.41
18.3
17.8
N/A
38.0
0.019
N/A
N/A
N/A
4.3
6.4
2001
83
92
0.36
0.41
19.0
18.2
N/A
36.4
0.020
N/A
N/A
N/A
4.4
6.3
2000
71
85
0.35
0.43
18.2
15.7
N/A
36.6
0.027
N/A
N/A
N/A
5.2
6.8
Natural disasters
Type
Detroit
Norfolk
Tornado activity compared to U.S. average
128.5%
69.9%
Earthquake activity compared to U.S. average
53.2%
36.4%
Natural disasters compared to U.S. average
14%
0%
Transportation
Detroit offers multiple transportation modes including bus service (DDOT), and a light rail system (QLine). Norfolk provides buses, light rail (The Tide), and ferries. Both cities have Amtrak service, but Detroit's public transport network is not as extensive as Norfolk.
Transport
Type
Detroit
Norfolk
Amtrak stations
1
1
Amtrak stations nearby
3
3
FAA registered aircraft
93
106
FAA registered aircraft manufacturers and dealers
3
4
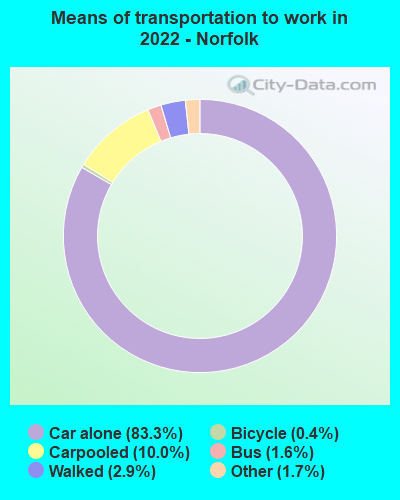
Means of transportation to work
Type
Detroit
Norfolk
Bicycle
0.5%
0.4%
Bus
4%
1.7%
Carpooled
7.5%
9.2%
Car alone
83.4%
83%
Motorcycle
0%
0.2%
Taxicab
0.5%
0.3%
Walked
2.7%
4.1%
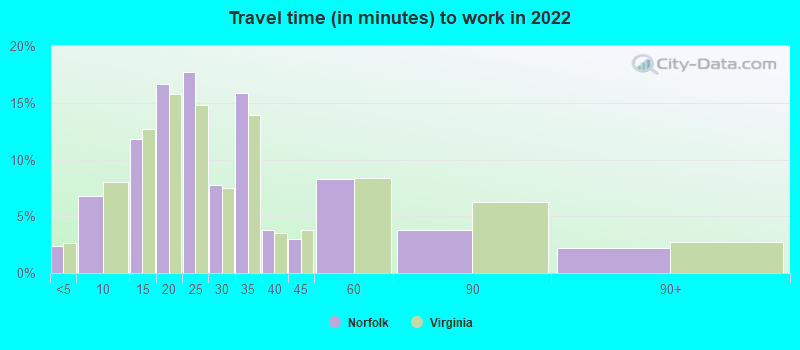
Average travel time to work
Type
Detroit
Norfolk
Average
30.6 min
26.5 min
Other means
26 min
21.4 min
Public transportation
47.7 min
43.4 min
Private vehicle occupancy
Type
Detroit
Norfolk
Average
1.2
1.1
Drove alone
87.1%
89.2%
In 2 person carpool
10.5%
8.4%
In 3 person carpool
1%
1.6%
In 4 person carpool
1%
0.3%
In 5-6 person carpool
0.3%
0.4%
In 7+ person carpool
0.2%
0%
How many people usually rode to work in the car, truck or van.
Real Estate
Detroit offers lower real estate costs compared to Norfolk but it also faces issues related to urban decay. Norfolk's real estate market is healthier with steady appreciation rates, especially in areas near the waterfront.
Neighborhoods
Detroit neighborhoods like Midtown and Downtown have seen revitalization efforts while areas like Greektown have a unique charm. Norfolk's Ghent and Downtown districts offer vibrant urban living options and coastal neighborhoods offer access to water-based activities.
Houses and residents
Type
Detroit
Norfolk
Houses
322,906
102,423
Average household size (people)
2.6
2.4
Median year apartment built
1953
1970
Median year house/condo built
1946
1958
Length of stay in the house since moving in
16.7 years
12.3 years
Houses occupied
251,729 (78%)
97,596 (95.3%)
Houses occupied by owners
129,084 (51.3%)
44,867 (46%)
Houses occupied by renters
122,645 (48.7%)
52,729 (54%)
Median rent asked for vacant for-rent units
$798.06
$517.27
Median monthly housing costs
$755
$1,196
Median price asked for vacant for-sale houses and condos
$86,452
$166,683
Estimated median house or condo value
$69,300
$250,300
Median numbers of rooms
5.7
5.3
Median number of rooms in apartments
5
4.2
Median number of rooms in houses and condos
6.3
6.6
Median house price - detached houses
$96,752
$306,640
Median house price - in 2-unit structures
$72,631
$250,782
Median house price - in 3-to-4-unit structures
$183,952
$117,518
Median house price - in 5 or more unit structures
$242,851
$260,910
Median house price - mobile homes
$43,864
$23,245
Median house price - Townhouses or other attached units
$128,652
$267,013
Median house price - All housing units
$101,554
$296,270
Median house age
74
56
Renting percentage
48.9%
54.6%
Housing density (houses/condos per square mile)
2,326.9
1,906.3
House value disparities
48.4%
33.9%
Household income disparities
49.3%
44.5%
Median household income for houses/condes with a mortgage
$61,259
$101,012
Median household income for apartments without a mortgage
$38,901
$66,099
Housing units without a mortgage
2,599 (5.6%)
741 (2.2%)
Housing units with both a second mortgage and home equity loan
2,270 (4.9%)
1,418 (4.1%)
Housing units with a mortgage
43,675 (94.4%)
33,471 (97.8%)
Housing units with a home equity loan
357 (0.8%)
128 (0.4%)
Housing units with a second mortgage
3,466 (7.5%)
2,277 (6.7%)
House/condo owner moved in on average (years ago)
16
9
House/condo renter moved in on average (years ago)
4
1
Housing units lacking complete kitchen facilities
17.1%
1.8%
Housing units lacking complete plumbing facilities
13.6%
1%
Housing units in structures
Housing units in structures
Detroit
Norfolk
One, detached
66.0%
48.2%
One, attached
6.1%
7.7%
Two
6.5%
4.8%
3 or 4
2.7%
10.2%
5 to 9
2.2%
10.1%
10 to 19
2.7%
6.0%
20 to 49
3.9%
4.1%
50 or more
9.4%
8.2%
Mobile homes
0.5%
0.7%
Median real estate property taxes paid for housing units
Self-employed workers in own not incorporated business
11,725
4,402
State government workers
8,763
5,009
Unpaid family workers
441
102
Industries and Occupations
In Detroit, manufacturing, specifically automobile production, remains prominent. In Norfolk, naval shipbuilding, maritime, and logistics are leading sectors, complemented by healthcare and tourism industries.
Detroit boasts a comprehensive healthcare network, including the Detroit Medical Center. Norfolk is well-served for health care by Sentara Norfolk General Hospital and the Children's Hospital of The King's Daughters.
Health (county statistics)
Type
Detroit
Norfolk
General health status score of residents in this county from 1 (poor) to 5 (excellent)
Detroit has invested significantly in infrastructure development post-bankruptcy. Norfolk’s infrastructure reflects its coastal, military, and historical character with good maintenance of public utilities and amenities.
Infrastructure
Type
Detroit
Norfolk
Hospitals
41
13
TV stations
16
26
Arenas or stadiums
4
1
Bank branches located here
98
59
Bank institutions located here
12
14
Main business address for public companies
11
4
Nuclear power plants nearby
0
2
Drinking water stations with no reported violations in the past
5
1
Drinking water stations with reported violations in the past
HMDA - Conventional home purchase loans - Applications denied
Year
Detroit
Norfolk
1999
2,901
0
2000
4,079
0
2001
3,815
0
2002
3,247
0
2003
5,511
520
2004
9,068
804
2005
13,958
854
2006
16,654
929
2007
10,742
604
2008
2,823
223
2009
484
92
Culture and Food
Detroit's rich cultural scene is highlighted by Motown's musical legacy, the Detroit Institute of Arts, and a diverse food culture with influences from its Greek, Middle Eastern and African American communities. Likewise, Norfolk's hospitality is showcased in the numerous seafood joints, craft breweries, and the annual Virginia Arts Festival.
Sports Teams
Detroit is a major sports city housing teams in all major leagues, including the Detroit Lions (NFL), Pistons (NBA), Tigers (MLB), and Red Wings (NHL). Norfolk doesn't have major league teams but supports minor league teams like the Norfolk Tides (MiLB) and Admirals (ECHL).


 Detroit, MI
 Norfolk, VA