Detroit, Michigan, and Rochester, New York, both boast rich histories and distinct cultural qualities that make them desirable places to live and visit. Detroit is known for its deep roots in the automotive and music industry, while Rochester is celebrated for its focus on education and technology. This unique blend of industrial history and technological future provides prospective dwellers and visitors a varied set of benefits. Let's take a closer look at aspects ranging from crime and safety to health care in both cities.
Distance between
Detroit, MI and
Rochester, NY : 283.6 miles
Detroit's population is larger by 200%. Its population has decreased by 318,806 people (33.5%) since 2000. The population of Rochester has decreased by 9,167 people (4.2%) during that time.
Safety is a major consideration when relocating or traveling. According to the FBI's crime data, Detroit has a higher crime rate than Rochester. However, like many cities, crime is localized with some neighborhoods safer than others. While both cities work on improving public safety, potential residents and tourists should stay informed about different neighborhoods.
City-data.com crime index counts serious crimes and violent crime more heavily. It adjusts for the number of visitors and daily workers commuting into cities. (higher means more crime, U.S. average = 301.1)
City-data.com crime index counts serious crimes and violent crime more heavily. It adjusts for the number of visitors and daily workers commuting into cities. (higher means more crime, U.S. average = 301.1)
Sex Offenders
According to our data, there are 3,446 registered sex offenders living in Detroit and 984 registered sex offenders living in . The ratio of residents to sex offenders in Detroit is 195 to 1; the ratio in Rochester is 212 to 1. The number of registered sex offenders compared to the number of residents in Detroit is near to than in Rochester.
Cost of Living
The overall cost of living in Detroit is lower than in Rochester. This includes housing, groceries, utilities, transportation, and health care. For tourists, lower costs in Detroit might mean more affordable travel and accommodation options.
Income Tax
Both states levy an income tax with Detroit residents paying a total of 4.25% for state and an additional 2.4% for city. Rochester residents pay a state tax rate ranging from 4% to 8.82%, but there's no additional city income tax.
Property Tax
Detroit has a higher property tax rate compared to Rochester. Detroit's city tax rate is around 2.8% while Rochester's is around 2.47% of assessed home value.
Sales Tax
Michigan has a lower state sales tax rate at 6% compared to New York’s rate of 8.875%. Considering the city tax, Detroit’s overall rate is 6%, while Rochester's combined rate is 8%.
Income
Type
Detroit
Rochester
Estimated median household income
$36,140
$41,980
Estimated per capita income
$22,122
$26,950
Cost of living index (U.S. average is 100)
94.1
102.1
If you make $50,000 in Detroit, you will have to make $54,251 in Rochester to maintain the same standard of living.
Geographical Conditions
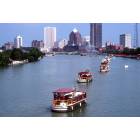
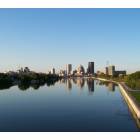
Geographically, Detroit's location on the Detroit River provides it with waterfront vistas not found in Rochester. Rochester, however, offers more green spaces with parks like Highland Park and Genesee Valley Park.
The education system in Rochester is generally viewed more favorably. Home to the highly-regarded University of Rochester and Rochester Institute of Technology, the city places a strong emphasis on education. Detroit offers Wayne State University and University of Detroit Mercy among others, but public schools often struggle with funding and performance issues.
Detroit’s economy has historically been centered around the automotive industry, and it continues to be a substantial sector. However, the city has diversified and is seeing growth in technology and healthcare sectors, mirroring national trends. Rochester’s economy, on the other hand, is well-rounded with strong portions in education, healthcare, and manufacturing.
Biggest Employers
In Detroit, the Ford Motor Company, General Motors, and the Detroit Medical Center are major employers. In Rochester, the University of Rochester/Strong Health, Rochester Regional Health, and Wegmans Food Markets are prominent employers.
There were 10 building permits issued in Detroit in 2012 (8 less than in 2011) compared to 45 building permits issued in Rochester in 2012 (1 less than in 2011).
In Detroit (Wayne County), 73.1% voted for Democrats and 26.2% for Republicans in 2012 Presidential Election. In Rochester (Monroe County), 58.2% voted for Democrats and 40.1% for Republicans.
Elections
Type
Democrats
Republicans
Other
Year
Detroit
Rochester
Detroit
Rochester
Detroit
Rochester
2020
68.6%
59.5%
30.4%
38.4%
1.0%
2.2%
2016
66.6%
54.3%
29.4%
39.3%
4.0%
6.5%
2012
73.1%
58.2%
26.2%
40.1%
0.6%
1.7%
2008
74.4%
58.4%
24.7%
40.6%
0.9%
1.0%
2004
69.7%
50.7%
29.9%
47.8%
0.4%
1.5%
2000
69.1%
51.0%
29.1%
44.5%
1.8%
4.5%
1996
69.0%
53.2%
24.0%
37.3%
7.0%
9.5%
Breakdown of population affiliated with a religious congregation
Type
Adherents
Congregations
Religion
Detroit
Rochester
Detroit
Rochester
CATHOLIC CHURCH
16.3%
25.7%
11.2%
11.2%
MUSLIM ESTIMATE
3.7%
1.2%
2.9%
1.1%
AMERICAN BAPTIST CHURCHES IN THE USA
1.5%
1.6%
2.4%
5.1%
LUTHERAN CHURCH
1.2%
1.0%
3.9%
1.9%
EVANGELICAL LUTHERAN CHURCH IN AMERICA
0.7%
1.1%
2.8%
3.3%
EPISCOPAL CHURCH
0.4%
0.7%
2.5%
3.5%
SEVENTH DAY ADVENTIST CHURCH
0.4%
0.2%
1.4%
1.4%
SOUTHERN BAPTIST CONVENTION
0.4%
0.1%
3.2%
2.1%
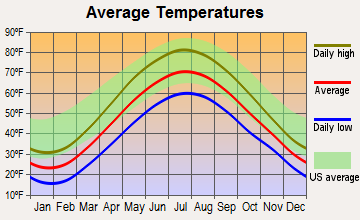
Weather
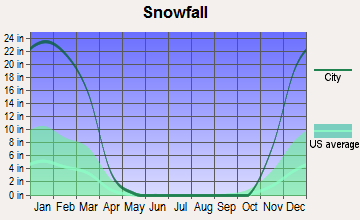
Both cities experience a full variety of seasons, but Detroit's winters are milder than Rochester's. Rochester is known for its heavy snowfall, which is supported by the fact that the city ranks among the snowiest in the entire U.S. Detroit, however, contends with lower temperatures despite lesser snow.
Weather and climate
Type
Detroit
Rochester
Temperature - Average
50°F
47.6°F
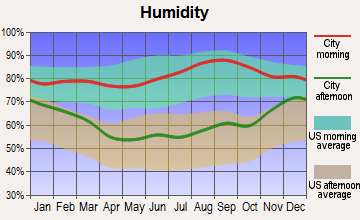
Humidity - Average morning or afternoon humidity
75.3%
76.5%
Humidity - Differences between morning and afternoon humidity
33%
34%
Humidity - Maximum monthly morning or afternoon humidity
86%
87%
Humidity - Minimum monthly morning or afternoon humidity
53%
53%
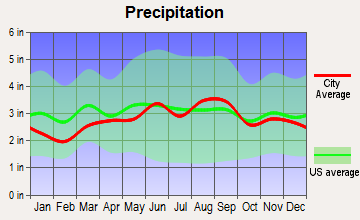
Precipitation - Yearly average
33.6 in
33.7 in
Snowfall - Yearly average
86.5 in
178.7 in
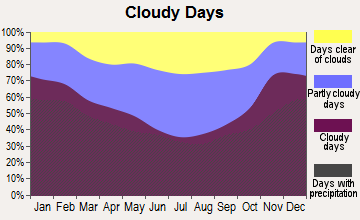
Clouds - Number of days clear of clouds
12.7%
10.2%
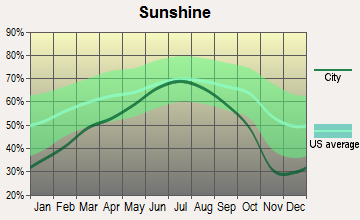
Sunshine amount - Average
56.8%
52.1%
Sunshine amount - Differences during a year
38%
43%
Sunshine amount - Maximum monthly
69%
67%
Sunshine amount - Minimum monthly
31%
24%
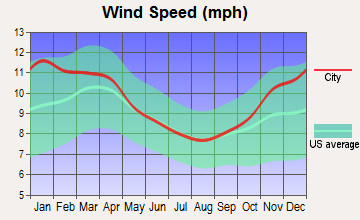
Wind speed - Average
10.2 mph
9.7 mph
Average climate in Detroit, Michigan
Average climate in Rochester, New York
Air pollution
Type
AQI
CO
NO2
OZONE
PB
PM25
SO2
Year
Detroit
Rochester
Detroit
Rochester
Detroit
Rochester
Detroit
Rochester
Detroit
Detroit
Rochester
Detroit
Rochester
2018
90
65
0.44
0.24
12.9
N/A
25.8
27.4
N/A
N/A
10.1
6.1
1.1
0.2
2017
87
67
0.56
0.23
12.7
N/A
20.9
29.3
N/A
N/A
10.1
6.2
1.3
0.5
2016
86
67
0.47
0.21
13.2
N/A
22.0
28.1
N/A
N/A
10.9
6.1
0.8
0.7
2015
95
65
0.49
0.21
14.8
N/A
26.5
26.4
N/A
N/A
11.9
7.1
1.2
0.8
2014
95
62
0.48
0.20
14.2
N/A
24.2
26.8
N/A
N/A
12.0
6.8
1.7
1.0
2013
80
64
0.53
0.20
14.4
N/A
24.5
27.5
N/A
N/A
11.0
7.7
1.3
0.9
2012
99
73
0.49
0.21
14.6
N/A
25.7
27.9
N/A
N/A
6.6
6.8
1.7
1.0
2011
94
67
0.32
0.19
12.9
8.1
24.3
27.2
N/A
N/A
6.5
6.8
1.6
1.1
2010
96
74
0.28
0.43
11.8
N/A
24.7
27.7
0.006
N/A
12.1
7.3
1.6
2.2
2009
68
64
0.27
0.42
12.7
N/A
23.4
24.4
N/A
N/A
N/A
6.9
1.9
2.5
2008
67
83
0.27
0.38
12.8
N/A
N/A
26.6
N/A
N/A
N/A
8.5
2.0
2.9
2007
81
86
0.29
0.42
13.7
N/A
25.8
25.6
0.017
N/A
N/A
9.2
N/A
4.1
2006
63
58
0.31
0.49
14.0
N/A
19.8
23.6
0.022
N/A
N/A
N/A
3.2
4.2
2005
83
67
0.36
0.46
17.4
N/A
22.6
23.5
0.019
N/A
N/A
N/A
4.0
4.2
2004
70
43
0.43
0.48
15.0
N/A
N/A
21.6
0.014
N/A
N/A
N/A
3.7
5.1
2003
86
66
0.40
0.49
18.5
N/A
N/A
24.9
0.013
N/A
N/A
N/A
4.8
5.4
2002
88
84
0.36
0.43
18.3
N/A
N/A
27.7
0.019
N/A
N/A
N/A
4.3
5.2
2001
83
70
0.36
0.42
19.0
N/A
N/A
25.7
0.020
N/A
N/A
N/A
4.4
7.6
2000
71
62
0.35
0.42
18.2
N/A
N/A
23.3
0.027
N/A
N/A
N/A
5.2
5.7
Natural disasters
Type
Detroit
Rochester
Tornado activity compared to U.S. average
128.5%
17.1%
Earthquake activity compared to U.S. average
53.2%
31.8%
Natural disasters compared to U.S. average
14%
17%
Transportation
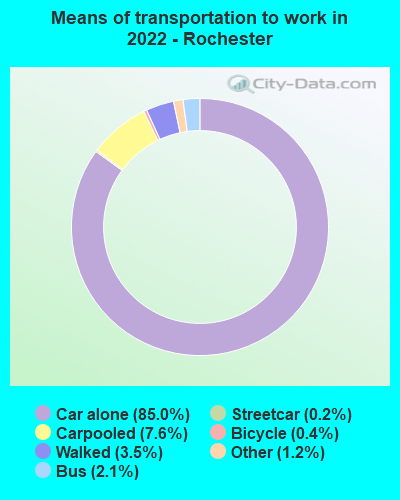
Detroit's transit system is predominantly car-centric due to its automotive history. On the other hand, Rochester offers more public transit options with a more bike-friendly infrastructure. For visitors, navigating Rochester might be easier without a car.
Transport
Type
Detroit
Rochester
Amtrak stations
1
1
Amtrak stations nearby
3
1
FAA registered aircraft
93
151
FAA registered aircraft manufacturers and dealers
3
1
Means of transportation to work
Type
Detroit
Rochester
Bicycle
0.5%
0.7%
Bus
4%
2.9%
Carpooled
7.5%
10%
Car alone
83.4%
81.8%
Motorcycle
0%
0.1%
Streetcar
0.1%
0.2%
Taxicab
0.5%
0.3%
Walked
2.7%
2.8%
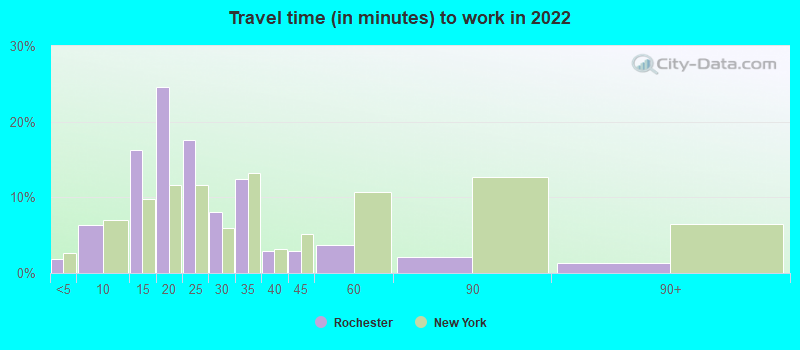
Average travel time to work
Type
Detroit
Rochester
Average
30.6 min
22.3 min
Other means
26 min
18.9 min
Public transportation
47.7 min
38.9 min
Private vehicle occupancy
Type
Detroit
Rochester
Average
1.2
1.2
Drove alone
87.1%
85.7%
In 2 person carpool
10.5%
11%
In 3 person carpool
1%
1.5%
In 4 person carpool
1%
1.2%
In 5-6 person carpool
0.3%
0.4%
In 7+ person carpool
0.2%
0.2%
How many people usually rode to work in the car, truck or van.
Real Estate
Detroit's real estate market has been volatile, but it offers lower home prices compared to Rochester. For renters, too, Detroit is generally more affordable. Rochester's real estate market is more stable and has seen steady growth over the years.
Neighborhoods
Both cities have diverse neighborhoods with a mixture of historic and modern areas. Detroit's Midtown, Downtown, and Corktown are popular, while Park Avenue, North Winton, and East End are favored in Rochester.
Houses and residents
Type
Detroit
Rochester
Houses
322,906
103,333
Average household size (people)
2.6
2.3
Median year apartment built
1953
1945
Length of stay in the house since moving in
16.7 years
15.3 years
Houses occupied
251,729 (78%)
93,263 (90.3%)
Houses occupied by owners
129,084 (51.3%)
38,125 (40.9%)
Houses occupied by renters
122,645 (48.7%)
55,138 (59.1%)
Median rent asked for vacant for-rent units
$798.06
$630.70
Median monthly housing costs
$755
$881
Median price asked for vacant for-sale houses and condos
$86,452
$160,052
Estimated median house or condo value
$69,300
$109,700
Median numbers of rooms
5.7
5.2
Median number of rooms in apartments
5
4.1
Median number of rooms in houses and condos
6.3
6.3
Median house price - detached houses
$96,752
$130,415
Median house price - in 2-unit structures
$72,631
$173,805
Median house price - in 3-to-4-unit structures
$183,952
$340,804
Median house price - in 5 or more unit structures
$242,851
$428,520
Median house price - mobile homes
$43,864
$28,854
Median house price - Townhouses or other attached units
$128,652
$183,602
Median house price - All housing units
$101,554
$148,505
Median house age
74
2,021
Renting percentage
48.9%
62.3%
Housing density (houses/condos per square mile)
2,326.9
2,883.6
House value disparities
48.4%
40.7%
Household income disparities
49.3%
48.9%
Median household income for houses/condes with a mortgage
$61,259
$69,171
Median household income for apartments without a mortgage
$38,901
$52,361
Housing units without a mortgage
2,599 (5.6%)
1,391 (5.4%)
Housing units with both a second mortgage and home equity loan
2,270 (4.9%)
3,040 (11.8%)
Housing units with a mortgage
43,675 (94.4%)
24,344 (94.6%)
Housing units with a home equity loan
357 (0.8%)
99 (0.4%)
Housing units with a second mortgage
3,466 (7.5%)
3,389 (13.2%)
House/condo owner moved in on average (years ago)
16
15
House/condo renter moved in on average (years ago)
4
3
Housing units lacking complete kitchen facilities
17.1%
1.8%
Housing units lacking complete plumbing facilities
13.6%
1.1%
Housing units in structures
Housing units in structures
Detroit
Rochester
One, detached
66.0%
47.7%
One, attached
6.1%
5.8%
Two
6.5%
17.4%
3 or 4
2.7%
8.0%
5 to 9
2.2%
5.0%
10 to 19
2.7%
2.7%
20 to 49
3.9%
4.4%
50 or more
9.4%
8.7%
Mobile homes
0.5%
0.3%
Median real estate property taxes paid for housing units
Self-employed workers in own not incorporated business
11,725
4,711
State government workers
8,763
2,362
Unpaid family workers
441
427
Industries and Occupations
Detroit is famous for its automotive industry with companies like General Motors and Ford. However, in recent years, healthcare and technology are emerging as key industries. Rochester, with companies like Xerox and Kodak, has a strong presence in the technology and imaging sectors. Healthcare and education are also significant industries.
When it comes to health care, both cities excel. Rochester is home to prominent medical institutions like the University of Rochester Medical Center and Rochester General Hospital. Detroit also has a strong healthcare sector with renowned institutions such as the Detroit Medical Center and Henry Ford Health System.
Health (county statistics)
Type
Detroit
Rochester
General health status score of residents in this county from 1 (poor) to 5 (excellent)
Detroit, owing to its industrial past, possesses a mature infrastructure in need of updates and restructuring. Rochester also has its share of infrastructure issues, but it often scores better in nationwide infrastructure health assessments, indicating a stronger and better-maintained public system.
Infrastructure
Type
Detroit
Rochester
Hospitals
41
14
TV stations
16
13
Arenas or stadiums
4
2
Bank branches located here
98
106
Bank institutions located here
12
15
Main business address for public companies
11
14
Nuclear power plants
0
1
Nuclear power plants nearby
0
1
Drinking water stations with no reported violations in the past
5
2
Drinking water stations with reported violations in the past
HMDA - Conventional home purchase loans - Applications denied
Year
Detroit
Rochester
1999
2,901
374
2000
4,079
555
2001
3,815
427
2002
3,247
356
2003
5,511
388
2004
9,068
476
2005
13,958
704
2006
16,654
872
2007
10,742
739
2008
2,823
319
2009
484
101
Culture and Food
Culturally, both cities are diverse but Detroit stands out for its Motown musical history and large African-American community. Rochester's culture is heavily influenced by its colleges and universities. Food scenes in both cities cater to traditional American cuisine, with Detroit known for its Coney Dogs and Rochester for its Garbage Plates.
Sports Teams
Sport is a big part of life in both cities. Detroit, known as "The City of Champions," is home to four big sports teams, The Tigers, Lions, Pistons, and Red Wings. Rochester doesn’t have major league teams, but hosts minor league teams like the Red Wings and Amerks, and has a solid soccer following with the Rhinos.


 Detroit, MI
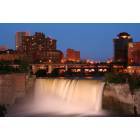
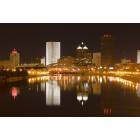
 Rochester, NY