Choosing between Detroit, Michigan, and Yonkers, New York, will depend on your individual lifestyle and career preferences. While Detroit boasts a vibrant automobile industry and lower cost of living, Yonkers offers a more metropolitan lifestyle due to its proximity to New York City. The two cities present different opportunities in terms of employment, tax rates, and cultural experiences. Here's a closer look at how these two cities compare across a variety of dimensions.
Distance between
Detroit, MI and
Yonkers, NY : 486.9 miles
Detroit's population is larger by 202%. Its population has decreased by 318,806 people (33.5%) since 2000. The population of Yonkers has grown by 13,444 people (6.9%) during that time.
Detroit has previously been known for high crime rates, but recent years have seen improvements. The crime rate can vary significantly between neighborhoods, so research is key when considering relocation. By comparison, Yonkers boasts a lower crime rate, making it a safer bet for those prioritizing safety. However, as with any urban area, it's recommended to remain vigilant, especially in tourist areas.
City-data.com crime index counts serious crimes and violent crime more heavily. It adjusts for the number of visitors and daily workers commuting into cities. (higher means more crime, U.S. average = 301.1)
City-data.com crime index counts serious crimes and violent crime more heavily. It adjusts for the number of visitors and daily workers commuting into cities. (higher means more crime, U.S. average = 301.1)
Sex Offenders
According to our data, there are 3,446 registered sex offenders living in Detroit and 121 registered sex offenders living in . The ratio of residents to sex offenders in Detroit is 195 to 1; the ratio in Yonkers is 1,659 to 1. The number of registered sex offenders compared to the number of residents is much larger in Detroit than that in Yonkers.
Cost of Living
The cost of living in Detroit is significantly lower than in Yonkers. Housing, utilities, and groceries all tend to be less expensive. However, higher income opportunities in Yonkers and nearby New York City may offset the higher cost of living for some.
Income Tax
Both cities implement a city income tax. Detroit's city income tax rates range from 1.2% to 2.4%, while Yonkers' is around 16.8%.
Property Tax
Property taxes differ between the two cities. Detroit has a lower property tax rate than Yonkers, which could be a benefit for potential homebuyers.
Sales Tax
Michigan's sales tax is lower than New York's, which can be a significant factor for those looking to save money. Detroit's sales tax is at 6%, while Yonkers' rate, combined with a state rate, is around 8.88%.
Income
Type
Detroit
Yonkers
Estimated median household income
$36,140
$66,395
Estimated per capita income
$22,122
$37,977
Cost of living index (U.S. average is 100)
94.1
152.2
If you make $50,000 in Detroit, you will have to make $80,871 in Yonkers to maintain the same standard of living.
Geographical Conditions
Detroit, located in the Southeast Michigan, has access to the Detroit River and the Great Lakes, offering recreational activities. Yonkers, bordering the Hudson River, offers scenic river views and is situated among rolling hills.
Both cities have a variety of education options. Detroit's school system has faced challenges in the past but is on the upswing with new charter and magnet schools. Yonkers offers a strong public and private school system with access to numerous higher education institutions in the New York City area.
Detroit's economy depends heavily on the automobile and tech industries, providing numerous career opportunities in these fields. Yonkers, located near Manhattan, offers a wide range of job opportunities in varying industries, including finance, health care, and education.
Biggest Employers
In Detroit, the biggest employers include General Motors, Ford, and Quicken Loans. Meanwhile, Yonkers is home to large employers such as Montefiore Hospital, Empire City Casino, and the Yonkers Board of Education.
There were 10 building permits issued in Detroit in 2012 (8 less than in 2011) compared to 12 building permits issued in Yonkers in 2012 (5 more than in 2011).
In Detroit (Wayne County), 73.1% voted for Democrats and 26.2% for Republicans in 2012 Presidential Election. In Yonkers (Westchester County), 62.1% voted for Democrats and 36.9% for Republicans.
Elections
Type
Democrats
Republicans
Other
Year
Detroit
Yonkers
Detroit
Yonkers
Detroit
Yonkers
2020
68.6%
67.8%
30.4%
31.4%
1.0%
0.8%
2016
66.6%
65.0%
29.4%
31.2%
4.0%
3.8%
2012
73.1%
62.1%
26.2%
36.9%
0.6%
0.9%
2008
74.4%
63.7%
24.7%
36.0%
0.9%
0.3%
2004
69.7%
58.2%
29.9%
40.4%
0.4%
1.4%
2000
69.1%
58.9%
29.1%
37.6%
1.8%
3.5%
1996
69.0%
56.9%
24.0%
35.9%
7.0%
7.2%
Breakdown of population affiliated with a religious congregation
Type
Adherents
Congregations
Religion
Detroit
Yonkers
Detroit
Yonkers
CATHOLIC CHURCH
16.3%
45.9%
11.2%
15.3%
MUSLIM ESTIMATE
3.7%
1.4%
2.9%
1.5%
AMERICAN BAPTIST CHURCHES IN THE USA
1.5%
0.6%
2.4%
3.4%
LUTHERAN CHURCH
1.2%
0.2%
3.9%
1.2%
EVANGELICAL LUTHERAN CHURCH IN AMERICA
0.7%
0.5%
2.8%
2.5%
EPISCOPAL CHURCH
0.4%
1.5%
2.5%
7.5%
SEVENTH DAY ADVENTIST CHURCH
0.4%
0.4%
1.4%
3.5%
SOUTHERN BAPTIST CONVENTION
0.4%
0.1%
3.2%
2.0%
REFORMED CHURCH IN AMERICA
0.0%
0.3%
0.3%
1.7%
Weather
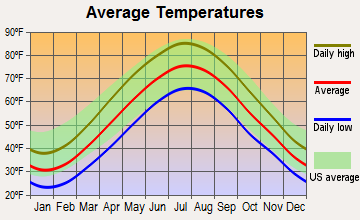
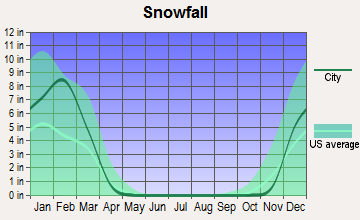
Those who prefer a warmer climate may lean towards Detroit, with its hot summers and mild winters. On the other hand, Yonkers' climate is milder throughout the year but tends to experience heavy snowfall during winter months. Both cities can encounter severe weather, with Detroit susceptible to thunderstorms and Yonkers to winter storms.
Weather and climate
Type
Detroit
Yonkers
Temperature - Average
50°F
53.5°F
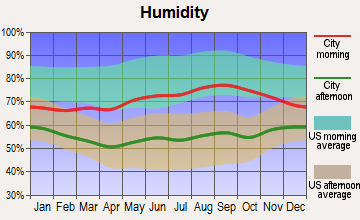
Humidity - Average morning or afternoon humidity
75.3%
67.4%
Humidity - Differences between morning and afternoon humidity
33%
26.9%
Humidity - Maximum monthly morning or afternoon humidity
86%
75.9%
Humidity - Minimum monthly morning or afternoon humidity
53%
49%
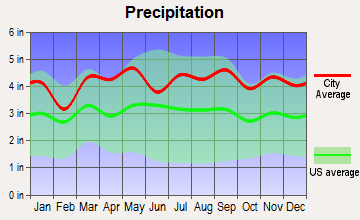
Precipitation - Yearly average
33.6 in
50.1 in
Snowfall - Yearly average
86.5 in
54.9 in
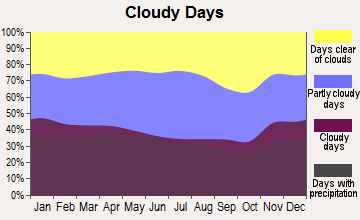
Clouds - Number of days clear of clouds
12.7%
16.7%
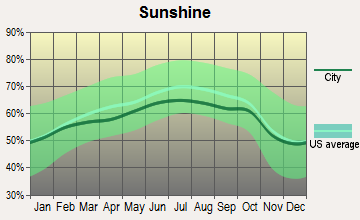
Sunshine amount - Average
56.8%
60.2%
Sunshine amount - Differences during a year
38%
20%
Sunshine amount - Maximum monthly
69%
64%
Sunshine amount - Minimum monthly
31%
44%
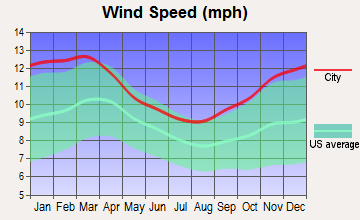
Wind speed - Average
10.2 mph
10 mph
Average climate in Detroit, Michigan
Average climate in Yonkers, New York
Air pollution
Type
AQI
CO
NO2
OZONE
PB
PM10
PM25
SO2
Year
Detroit
Yonkers
Detroit
Yonkers
Detroit
Yonkers
Detroit
Yonkers
Detroit
Yonkers
Yonkers
Detroit
Yonkers
Detroit
Yonkers
2018
90
102
0.44
0.30
12.9
16.1
25.8
24.6
N/A
N/A
N/A
N/A
10.1
7.5
1.1
0.6
2017
87
97
0.56
0.10
12.7
16.1
20.9
24.8
N/A
N/A
N/A
N/A
10.1
7.2
1.3
0.5
2016
86
97
0.47
0.28
13.2
16.8
22.0
24.7
N/A
N/A
N/A
N/A
10.9
7.5
0.8
0.7
2015
95
105
0.49
0.29
14.8
18.1
26.5
23.9
N/A
N/A
N/A
N/A
11.9
8.7
1.2
1.3
2014
95
96
0.48
0.33
14.2
18.3
24.2
23.7
N/A
N/A
N/A
N/A
12.0
8.2
1.7
1.6
2013
80
103
0.53
0.39
14.4
18.8
24.5
23.8
N/A
N/A
N/A
N/A
11.0
8.9
1.3
1.9
2012
99
102
0.49
0.43
14.6
18.6
25.7
24.2
N/A
N/A
N/A
N/A
6.6
8.9
1.7
2.8
2011
94
107
0.32
0.45
12.9
20.8
24.3
22.6
N/A
N/A
N/A
N/A
6.5
10.9
1.6
4.1
2010
96
113
0.28
0.48
11.8
19.3
24.7
24.0
0.006
N/A
N/A
N/A
12.1
10.3
1.6
3.7
2009
68
102
0.27
0.50
12.7
21.4
23.4
19.7
N/A
N/A
N/A
N/A
N/A
10.4
1.9
4.5
2008
67
114
0.27
0.51
12.8
22.5
N/A
20.4
N/A
0.013
N/A
N/A
N/A
11.7
2.0
5.0
2007
81
120
0.29
0.58
13.7
24.2
25.8
19.7
0.017
0.016
N/A
N/A
N/A
12.8
N/A
6.0
2006
63
115
0.31
0.53
14.0
23.9
19.8
19.7
0.022
0.018
N/A
N/A
N/A
12.8
3.2
6.1
2005
83
112
0.36
0.62
17.4
26.1
22.6
18.8
0.019
N/A
N/A
N/A
N/A
N/A
4.0
8.1
2004
70
99
0.43
0.63
15.0
25.0
N/A
17.6
0.014
0.030
N/A
N/A
N/A
N/A
3.7
7.9
2003
86
106
0.40
0.74
18.5
26.5
N/A
18.1
0.013
0.025
26.9
N/A
N/A
N/A
4.8
8.0
2002
88
122
0.36
0.68
18.3
26.7
N/A
18.9
0.019
N/A
25.4
N/A
N/A
N/A
4.3
7.6
2001
83
123
0.36
0.69
19.0
28.9
N/A
19.4
0.020
N/A
23.6
N/A
N/A
N/A
4.4
8.9
2000
71
111
0.35
0.71
18.2
29.2
N/A
17.1
0.027
N/A
22.2
N/A
N/A
N/A
5.2
8.4
Natural disasters
Type
Detroit
Yonkers
Tornado activity compared to U.S. average
128.5%
60.2%
Earthquake activity compared to U.S. average
53.2%
31.2%
Natural disasters compared to U.S. average
14%
26%
Transportation
Detroit's public transit system, often criticized for its inefficiency, is improving. The city's commuter rail, the QLine, serves the downtown core. Yonkers offers more robust public transit options due to its proximity to New York City.
Transport
Type
Detroit
Yonkers
Amtrak stations
1
1
Amtrak stations nearby
3
3
FAA registered aircraft
93
17
FAA registered aircraft manufacturers and dealers
3
0
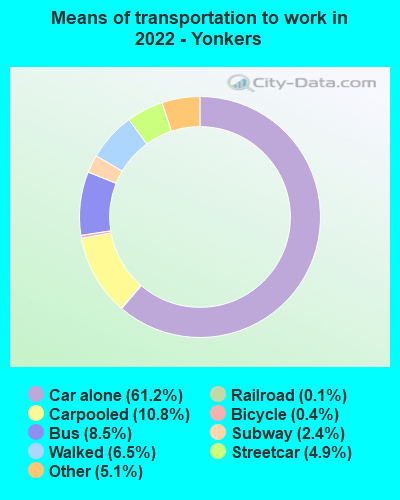
Means of transportation to work
Type
Detroit
Yonkers
Bicycle
0.5%
0.1%
Bus
4%
13.9%
Carpooled
7.5%
12.2%
Car alone
83.4%
60.3%
Railroad
0%
6.2%
Streetcar
0.1%
2.5%
Subway
0.1%
2.5%
Taxicab
0.5%
0.9%
Walked
2.7%
4.4%
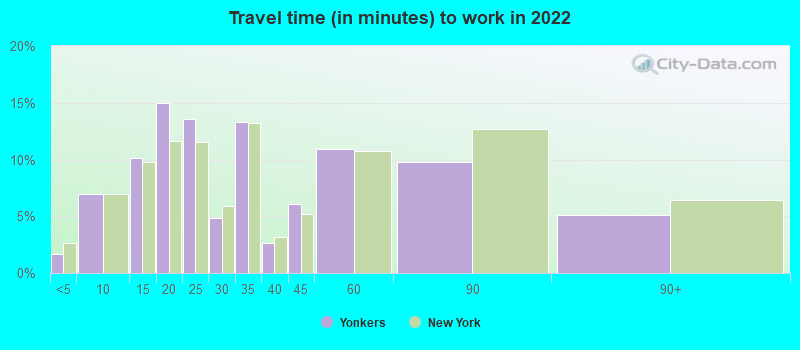
Average travel time to work
Type
Detroit
Yonkers
Average
30.6 min
33.9 min
Other means
26 min
27.4 min
Public transportation
47.7 min
52 min
Private vehicle occupancy
Type
Detroit
Yonkers
Average
1.2
1.2
Drove alone
87.1%
85.9%
In 2 person carpool
10.5%
10.4%
In 3 person carpool
1%
1.4%
In 4 person carpool
1%
1.1%
In 5-6 person carpool
0.3%
1.1%
In 7+ person carpool
0.2%
0.1%
How many people usually rode to work in the car, truck or van.
Real Estate
Housing in Detroit is generally more affordable than in Yonkers. However, Detroit has had some struggle with vacant properties. Conversely, Yonkers experiences a higher demand for real estate due to its proximity to New York City, resulting in higher prices.
Neighborhoods
Both cities offer a diverse range of neighborhoods. Detroit's neighborhoods, such as Greektown and Midtown, offer unique cultural experiences. Yonkers' neighborhoods, like Park Hill and Ludlow, provide a wide range of housing options, from urban to suburban styles.
Houses and residents
Type
Detroit
Yonkers
Houses
322,906
83,368
Average household size (people)
2.6
2.6
Median year apartment built
1953
1964
Median year house/condo built
1946
1955
Length of stay in the house since moving in
16.7 years
16.2 years
Houses occupied
251,729 (78%)
81,397 (97.6%)
Houses occupied by owners
129,084 (51.3%)
40,385 (49.6%)
Houses occupied by renters
122,645 (48.7%)
41,012 (50.4%)
Median rent asked for vacant for-rent units
$798.06
$746.05
Median monthly housing costs
$755
$1,515
Median price asked for vacant for-sale houses and condos
$86,452
$214,056
Estimated median house or condo value
$69,300
$424,100
Median numbers of rooms
5.7
4.5
Median number of rooms in apartments
5
3.8
Median number of rooms in houses and condos
6.3
5.5
Median house price - detached houses
$96,752
$633,111
Median house price - in 2-unit structures
$72,631
$422,890
Median house price - in 3-to-4-unit structures
$183,952
$362,555
Median house price - in 5 or more unit structures
$242,851
$246,208
Median house price - Townhouses or other attached units
$128,652
$360,577
Median house price - All housing units
$101,554
$455,533
Median house age
74
62
Renting percentage
48.9%
53.9%
Housing density (houses/condos per square mile)
2,326.9
4,611.9
House value disparities
48.4%
31%
Household income disparities
49.3%
48.5%
Median household income for houses/condes with a mortgage
$61,259
$129,663
Median household income for apartments without a mortgage
$38,901
$72,991
Housing units without a mortgage
2,599 (5.6%)
759 (3.3%)
Housing units with both a second mortgage and home equity loan
2,270 (4.9%)
2,672 (11.7%)
Housing units with a mortgage
43,675 (94.4%)
21,988 (96.7%)
Housing units with a home equity loan
357 (0.8%)
118 (0.5%)
Housing units with a second mortgage
3,466 (7.5%)
3,163 (13.9%)
House/condo owner moved in on average (years ago)
16
17
House/condo renter moved in on average (years ago)
4
5
Housing units lacking complete kitchen facilities
17.1%
0.9%
Housing units lacking complete plumbing facilities
13.6%
1.3%
Housing units in structures
Housing units in structures
Detroit
Yonkers
One, detached
66.0%
24.7%
One, attached
6.1%
6.3%
Two
6.5%
10.0%
3 or 4
2.7%
10.0%
5 to 9
2.2%
5.1%
10 to 19
2.7%
6.1%
20 to 49
3.9%
10.3%
50 or more
9.4%
27.3%
Mobile homes
0.5%
0.1%
Median real estate property taxes paid for housing units
Self-employed workers in own not incorporated business
11,725
5,405
State government workers
8,763
4,428
Unpaid family workers
441
337
Industries and Occupations
Detroit is renowned for its automobile industry with key players like Ford and General Motors. It's also growing in the tech industry. Yonkers offers a variety of occupations, with emphasis in retail, health care, and education sectors due to its proximity to New York City.
Detroit offers a robust healthcare system with major facilities like the Detroit Medical Center. Yonkers has several renowned hospitals, including Saint John's Riverside Hospital and Montefiore Medical Center.
Health (county statistics)
Type
Detroit
Yonkers
General health status score of residents in this county from 1 (poor) to 5 (excellent)
Detroit's infrastructure, especially its roads, have been criticized in the past but improvements are in progress. Yonkers, being older and part of the dense New York metropolitan area, boasts an extensive infrastructure including efficient public transit systems.
Infrastructure
Type
Detroit
Yonkers
Hospitals
41
7
TV stations
16
30
Bank branches located here
98
52
Bank institutions located here
12
16
Main business address for public companies
11
4
Drinking water stations with no reported violations in the past
5
0
Drinking water stations with reported violations in the past
HMDA - Conventional home purchase loans - Applications denied
Year
Detroit
Yonkers
1999
2,901
379
2000
4,079
529
2001
3,815
366
2002
3,247
362
2003
5,511
470
2004
9,068
649
2005
13,958
799
2006
16,654
999
2007
10,742
748
2008
2,823
472
2009
484
271
Culture and Food
Detroit, known for its music and automotive culture, offers a variety of dining experiences, from American cuisine to ethnic foods. Yonkers, due to its diversity and proximity to NYC, offers a broad range of cultural experiences and cuisines.
Sports Teams
Sports enthusiasts may enjoy Detroit, home to several major sports teams, including the Detroit Tigers (MLB), Pistons (NBA), Lions (NFL), and Red Wings (NHL). Yonkers doesn’t have its own major professional sports teams but proximity to New York City provides access to teams like the Yankees (MLB), Knicks (NBA), Giants, and Jets (NFL).


 Detroit, MI
 Yonkers, NY