Comparing East San Gabriel Valley in California and Staten Island in New York provides unique insights into these distinct parts of the U.S. While both regions offer appealing attractions and features, each has its unique qualities. East San Gabriel Valley borders Los Angeles and offers a less crowded suburban lifestyle with a temperate climate. Staten Island on the other hand, is one of New York City's five boroughs and offers an urban lifestyle, rich in history, culture, and a diverse food scene.
Staten Island, like other parts of New York City, has seen a significant decrease in crime rates over the past few decades. However, it still has higher crime rates compared to national averages. The East San Gabriel Valley, on the other hand, has relatively lower crime rates, making it generally safer, particularly for families looking to relocate.
Cost of Living
The cost of living is substantially higher in both places compared to the national average, with Staten Island being slightly more affordable than East San Gabriel Valley. Housing, utilities, and transportation contribute significantly to these high costs.
Income Tax
Both New York and California have progressive income tax systems, meaning those earning more will be taxed at higher rates. California has slightly higher top rates than New York, which may impact those in higher-income brackets.
Property Tax
Property taxes are relatively high in both states, but they are somewhat higher in New York than in California, largely due to higher property values.
Sales Tax
Sales tax rates are high in both regions, with New York having a slightly higher rate than California, which can influence living costs and decision-making when shopping for goods.
Income
Type
East San Gabriel Valley
Staten Island
Estimated median household income
$95,242
$86,054
Estimated per capita income
$34,474
$38,678
Cost of living index (U.S. average is 100)
150.2
164.1
If you make $50,000 in East San Gabriel Valley, you will have to make $54,627 in Staten Island to maintain the same standard of living.
Geographical Conditions
Staten Island has a largely flat terrain, featuring a blend of urban landscapes and natural settings like parks and green spaces. East San Gabriel Valley, in contrast, has more varied and hilly terrain. Both offer easy access to both beach and mountains.
Geographical information
Type
East San Gabriel Valley
Staten Island
Land area
212.6 sq. miles
58.5 sq. miles
Population density
4,478.5 people per sq. mile
8,225.7 people per sq. mile
Relative area comparison
East San Gabriel Valley, CA Staten Island, NY
Education
Both regions are known for strong educational systems, although they cater to different demographics. East San Gabriel Valley has several reputable public and private schools and is home to prestigious institutions like the University of Southern California. Staten Island, on the other hand, has a robust public school system and offers several higher education opportunities through the City University of New York.
East San Gabriel's economy is primarily influenced by healthcare, education, and retail trade industries, while Staten Island has a more diversified economy with an emphasis on healthcare, retail, and education sector as well. Job growth is expected to be higher in East San Gabriel Valley.
Biggest Employers
Some of the largest employers in Staten Island include Staten Island University Hospital, Richmond University Medical Center, and Amazon's fulfillment center. Meanwhile, in East San Gabriel Valley, the largest employers include Citrus Valley Health Partners, University of Southern California, and Walmart.
In East San Gabriel Valley (Los Angeles County), 69.7% voted for Democrats and 27.8% for Republicans in 2012 Presidential Election. In Staten Island (Richmond County), 50.8% voted for Democrats and 48.3% for Republicans.
Elections
Type
Democrats
Republicans
Other
Year
East San Gabriel Valley
Staten Island
East San Gabriel Valley
Staten Island
East San Gabriel Valley
Staten Island
2020
71.0%
42.2%
26.9%
57.1%
2.1%
0.7%
2016
72.0%
41.0%
22.5%
56.1%
5.5%
2.9%
2012
69.7%
50.8%
27.8%
48.3%
2.4%
0.9%
2008
69.2%
47.8%
28.8%
51.9%
1.9%
0.4%
2004
63.3%
42.8%
35.7%
56.5%
1.0%
0.7%
2000
63.6%
52.1%
32.4%
45.1%
4.0%
2.9%
1996
59.3%
50.5%
31.0%
40.8%
9.7%
8.7%
Breakdown of population affiliated with a religious congregation
Type
Adherents
Congregations
Religion
East San Gabriel Valley
Staten Island
East San Gabriel Valley
Staten Island
CATHOLIC CHURCH
36.1%
54.2%
4.7%
20.6%
SOUTHERN BAPTIST CONVENTION
1.0%
0.2%
9.0%
3.5%
MUSLIM ESTIMATE
0.7%
1.7%
1.0%
3.0%
AMERICAN BAPTIST CHURCHES IN THE USA
0.5%
0.6%
3.1%
1.0%
SEVENTH DAY ADVENTIST CHURCH
0.5%
0.1%
2.4%
2.5%
EPISCOPAL CHURCH
0.4%
0.4%
1.4%
5.0%
EVANGELICAL LUTHERAN CHURCH IN AMERICA
0.2%
0.6%
1.9%
4.0%
COPTIC ORTHODOX CHURCH
0.1%
0.5%
0.2%
1.0%
Weather
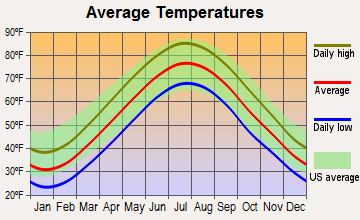
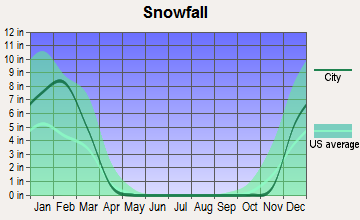
The East San Gabriel Valley boasts a traditionally sunny Southern California climate with mild winters and warm summers. On the other hand, Staten Island experiences the four distinct seasons common to the Northeast U.S., which include cold winters and hot, humid summers. The variety of weather may appeal to nature enthusiasts and those who enjoy seasonal changes.
Weather and climate
Type
East San Gabriel Valley
Staten Island
Temperature - Average
62.7°F
54.1°F
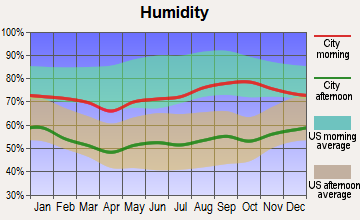
Humidity - Average morning or afternoon humidity
64.7%
67.4%
Humidity - Differences between morning and afternoon humidity
19.6%
29.9%
Humidity - Maximum monthly morning or afternoon humidity
70.7%
77%
Humidity - Minimum monthly morning or afternoon humidity
51%
47.2%
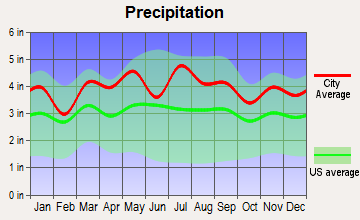
Precipitation - Yearly average
19.1 in
47.4 in
Snowfall - Yearly average
0 in
60 in
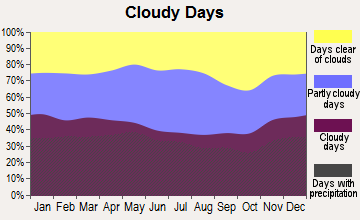
Clouds - Number of days clear of clouds
28.3%
15.8%
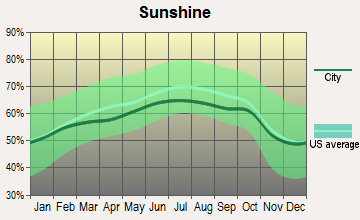
Sunshine amount - Average
78.4%
60.2%
Sunshine amount - Differences during a year
22%
20%
Sunshine amount - Maximum monthly
85%
64%
Sunshine amount - Minimum monthly
63%
44%
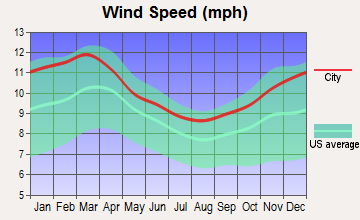
Wind speed - Average
3.7 mph
10.5 mph
Average climate in East San Gabriel Valley, California
Average climate in Staten Island, New York
Air pollution
Type
AQI
CO
NO2
OZONE
PB
PM10
PM25
SO2
Year
East San Gabriel Valley
Staten Island
East San Gabriel Valley
Staten Island
East San Gabriel Valley
Staten Island
East San Gabriel Valley
Staten Island
East San Gabriel Valley
Staten Island
East San Gabriel Valley
Staten Island
East San Gabriel Valley
Staten Island
East San Gabriel Valley
Staten Island
2018
143
94
0.36
0.35
14.1
17.1
29.2
24.1
0.007
N/A
29.6
N/A
13.4
7.9
0.3
0.4
2017
150
98
0.35
0.32
14.8
17.0
30.5
27.0
0.007
N/A
32.7
N/A
12.6
7.6
0.3
0.2
2016
141
94
0.31
0.37
15.5
17.9
29.3
28.5
0.007
N/A
30.3
N/A
12.0
7.7
0.3
0.2
2015
145
102
0.30
0.39
15.2
18.9
30.4
27.3
0.007
N/A
30.0
N/A
14.6
8.6
0.2
0.4
2014
142
97
0.32
0.38
16.8
19.2
29.7
25.6
0.008
N/A
33.6
N/A
11.7
8.3
0.3
0.7
2013
147
99
0.33
0.39
17.0
19.6
27.7
27.8
0.007
N/A
31.5
N/A
11.5
8.5
0.4
0.8
2012
149
102
0.39
0.42
18.3
19.3
27.5
26.9
0.005
N/A
30.9
N/A
15.6
9.2
0.6
1.4
2011
149
108
0.40
0.42
18.6
21.4
26.7
28.1
0.008
N/A
30.3
N/A
17.3
10.2
0.5
2.0
2010
139
114
0.44
0.40
19.3
19.9
26.8
28.7
N/A
N/A
26.6
N/A
14.8
9.4
0.4
1.8
2009
156
105
0.40
0.39
21.0
22.5
28.0
25.3
0.010
N/A
26.0
N/A
16.5
9.5
0.6
2.4
2008
156
111
0.48
0.39
22.7
23.0
27.7
24.3
0.012
0.013
27.0
N/A
15.1
11.3
1.0
3.4
2007
135
123
0.52
0.44
25.3
24.2
24.8
23.3
0.014
0.016
N/A
N/A
N/A
12.0
1.3
4.3
2006
128
117
0.55
0.55
25.1
25.6
24.0
24.7
0.009
0.018
N/A
N/A
N/A
13.1
1.9
5.3
2005
127
112
0.59
0.69
25.7
27.3
22.8
23.3
0.014
N/A
N/A
N/A
N/A
N/A
1.9
7.3
2004
132
109
0.68
0.68
25.4
26.4
24.6
22.2
0.016
0.030
N/A
N/A
N/A
N/A
1.7
6.9
2003
137
112
0.80
0.76
29.9
28.0
24.7
22.1
0.021
0.006
N/A
26.9
N/A
N/A
1.4
7.1
2002
134
125
0.83
0.74
31.4
30.6
23.1
24.7
0.021
0.008
N/A
26.1
N/A
N/A
2.0
6.6
2001
141
124
1.00
0.81
31.8
32.4
21.4
24.9
0.029
0.020
N/A
26.9
N/A
N/A
2.1
7.2
2000
150
116
1.05
0.93
34.7
33.0
20.7
23.1
0.027
0.022
N/A
22.2
N/A
N/A
2.0
7.2
Natural disasters
Type
East San Gabriel Valley
Staten Island
Tornado activity compared to U.S. average
18.5%
61.3%
Earthquake activity compared to U.S. average
7,292.4%
31.2%
Natural disasters compared to U.S. average
57%
19%
Transportation
Staten Island benefits from New York City's extensive public transportation network. However, it also has significant traffic congestion. East San Gabriel Valley has a less comprehensive public transportation system but typically has less traffic congestion.
Transport
Type
East San Gabriel Valley
Staten Island
Amtrak stations nearby
3
3
FAA registered aircraft
0
39
FAA registered aircraft manufacturers and dealers
0
2
Means of transportation to work
Type
East San Gabriel Valley
Staten Island
Bicycle
0.6%
0.2%
Bus
2.9%
19.2%
Carpooled
17.1%
12.1%
Car alone
73.3%
54.3%
Ferryboat
0%
5.3%
Motorcycle
0.2%
0.1%
Railroad
0.6%
0.9%
Subway
0.1%
2.6%
Taxicab
0%
0.4%
Walked
2.2%
2.9%
Average travel time to work
Type
East San Gabriel Valley
Staten Island
Average
32.3 min
45.3 min
Real Estate
Real estate in East San Gabriel Valley is extremely pricey, with the median home value significantly above the national average. Staten Island offers relatively lower housing costs within the NYC, but still above national averages.
Neighborhoods
East San Gabriel Valley has attractive suburban neighborhoods that offer a mix of residential options, from single-family homes to apartments. Staten Island, by contrast, has a variety of urban and suburban neighborhoods, each with its unique appeal.
Houses and residents
Type
East San Gabriel Valley
Staten Island
Houses
270,240
163,993
Average household size (people)
3.5
2.8
Houses occupied
263,338 (97.4%)
156,341 (95.3%)
Houses occupied by owners
180,683 (68.6%)
99,732 (63.8%)
Houses occupied by renters
82,655 (31.4%)
56,609 (36.2%)
Median rent asked for vacant for-rent units
$1,935
$1,320
Median price asked for vacant for-sale houses and condos
$1,138,428
$369,853
Estimated median house or condo value
$643,048
$605,500
Median number of rooms in apartments
3.7
3.9
Median number of rooms in houses and condos
5.9
6.1
Renting percentage
32.3%
35.9%
Housing density (houses/condos per square mile)
1,270.8
2,804.3
Household income disparities
40.3%
43.8%
Housing units without a mortgage
26,635 (16.4%)
19,289 (25%)
Housing units with both a second mortgage and home equity loan
515 (0.3%)
160 (0.2%)
Housing units with a mortgage
136,243 (83.6%)
57,986 (75%)
Housing units with a home equity loan
11,429 (7%)
5,623 (7.3%)
Housing units with a second mortgage
21,150 (13%)
4,499 (5.8%)
Housing units lacking complete kitchen facilities
1%
0.6%
Housing units lacking complete plumbing facilities
0.8%
0.5%
Housing units in structures
Housing units in structures
East San Gabriel Valley
Staten Island
One, detached
68.5%
33.8%
One, attached
8.2%
24.2%
Two
1.0%
23.0%
3 or 4
3.9%
5.0%
5 to 9
3.0%
2.4%
10 to 19
2.4%
1.6%
20 to 49
2.8%
2.9%
50 or more
6.5%
6.9%
Mobile homes
3.6%
0.2%
Boats, RVs, vans, etc.
0.1%
0.0%
Median real estate property taxes paid for housing units
Self-employed workers in own not incorporated business
25,753
7,611
State government workers
13,845
6,285
Unpaid family workers
1,494
394
Industries and Occupations
Healthcare, retail, and education are the most common sectors for employment in both regions. However, East San Gabriel Valley also has a notable presence of professionals working in the information sector and management roles.
Both regions have exceptional health care systems. Staten Island is home to two major hospitals, and East San Gabriel Valley residents have access to several high-quality medical centers.
While both regions are well developed, Staten Island benefits from the extensive infrastructure of New York City. In contrast, East San Gabriel Valley, while having a robust infrastructure, deals with some common California issues like drought and wildfire risks.
Infrastructure
Type
East San Gabriel Valley
Staten Island
TV stations
24
30
Culture and Food
Both Staten Island and East San Gabriel Valley boast rich cultures and diverse food scenes. Staten Island, due to its history and location within New York City, has an internationally influenced food culture. East San Gabriel Valley is known for its exceptional Asian cuisine, particularly Chinese, due to large Asian-American communities.
Sports Teams
Staten Island residents have access to all of New York City's professional sports teams including the Yankees, Mets, Knicks, Rangers, and more. East San Gabriel Valley residents are not far from Los Angeles, allowing access to teams like the Lakers, Clippers, Dodgers, and Kings.
 East San Gabriel Valley, CA
 Staten Island, NY