El Paso, Texas, and Aurora, Colorado, are two influential US cities pronouncedly different on various aspects, offering distinct lifestyles. El Paso is a border city known for its rich Hispanic culture and warm desert climate. In contrast, Aurora, part of the Denver Metropolitan area, boasts its proximity to the Rocky Mountains, bringing in a cooler climate and diverse outdoor recreational opportunities. The comparison extends to the myriad of aspects like crime and safety, weather, cost of living, education, work and economy, infrastructure, industries and occupations, biggest employers, real-estate, neighborhoods, transportation, taxes, culture and food, sports teams, geographical conditions, and health care.
Distance between
El Paso, TX and
Aurora, CO : 553.6 miles
El Paso's population is larger by 74%. Its population has grown by 114,753 people (20.4%) since 2000. The population of Aurora has grown by 112,954 people (40.9%) during that time.
El Paso is reputed to be one of the safest cities in the US for its size. It has a well-run police department with a crime rate below the national average. However, property crimes are somewhat prevalent. Aurora's crime rate is above the national average, but it's important to note that crime varies neighborhood to neighborhood. The city also makes concerted efforts to advance community policing.
City-data.com crime index counts serious crimes and violent crime more heavily. It adjusts for the number of visitors and daily workers commuting into cities. (higher means more crime, U.S. average = 301.1)
City-data.com crime index counts serious crimes and violent crime more heavily. It adjusts for the number of visitors and daily workers commuting into cities. (higher means more crime, U.S. average = 301.1)
Sex Offenders
According to our data, there are 1,274 registered sex offenders living in El Paso and 1,048 registered sex offenders living in . The ratio of residents to sex offenders in El Paso is 536 to 1; the ratio in Aurora is 346 to 1. The number of registered sex offenders compared to the number of residents is a smaller in El Paso than in Aurora.
Cost of Living
Generally, El Paso offers a lower cost of living compared to Aurora. It's particularly known for its affordable housing. By contrast, Aurora's cost of living is higher due to increased costs in housing, groceries, and health care.
Income Tax
Texas, including El Paso, has no state income tax, a significant financial benefit for residents. In contrast, Colorado residents, including those in Aurora, are subjected to a flat income tax rate regardless of income level.
Property Tax
Property taxes in El Paso are relatively high compared to other Texas cities. Whereas, in Aurora, property taxes are quite reasonable in comparison to the high value of real estate therein.
Sales Tax
El Paso has a total sales tax rate of 8.25%, which includes the Texas state sales tax of 6.25%. Conversely, Aurora has a combined city and state sales tax rate of 8.5%, higher than El Paso's rate.
Income
Type
El Paso
Aurora
Estimated median household income
$51,241
$71,647
Estimated per capita income
$25,670
$35,054
Cost of living index (U.S. average is 100)
82.2
109.4
If you make $50,000 in El Paso, you will have to make $66,545 in Aurora to maintain the same standard of living.
Geographical Conditions
El Paso is situated in the Chihuahuan Desert, providing a landscape of plains and mountains. In contrast, Aurora lies near the Rocky Mountains, offering great natural beauty and outdoor opportunities, including hiking, camping, and skiing.
Both cities offer a variety of educational opportunities. El Paso has seamless access to quality education through the University of Texas at El Paso and El Paso Community College. Meanwhile, Aurora benefits from the wider Denver Metropolitan area's educational facilities, including the University of Colorado and Metropolitan State University.
El Paso's economy is driven by a mixture of service, trade, government, and manufacturing sectors. On the other hand, Aurora has a diversified economy with strong sectors in aerospace, health care, and retail.
Biggest Employers
El Paso's major employers include the University of Texas at El Paso, the City of El Paso, and Fort Bliss. In Aurora, top employers include the Anschutz Medical Campus, Buckley Air Force Base, and Aurora Public Schools.
In El Paso (El Paso County), 65.5% voted for Democrats and 33.2% for Republicans in 2012 Presidential Election. In Aurora (Adams County), 57.3% voted for Democrats and 40.4% for Republicans.
Elections
Type
Democrats
Republicans
Other
Year
El Paso
Aurora
El Paso
Aurora
El Paso
Aurora
2020
66.8%
57.1%
31.6%
40.7%
1.6%
2.2%
2016
69.1%
50.1%
26.0%
41.6%
4.9%
8.3%
2012
65.5%
57.3%
33.2%
40.4%
1.3%
2.3%
2008
66.0%
58.5%
33.4%
40.1%
0.6%
1.4%
2004
56.2%
50.7%
43.3%
48.4%
0.5%
0.9%
2000
57.9%
50.3%
39.8%
44.2%
2.3%
5.5%
1996
62.3%
51.3%
32.1%
38.9%
5.6%
9.8%
Breakdown of population affiliated with a religious congregation
Type
Adherents
Congregations
Religion
El Paso
Aurora
El Paso
Aurora
CATHOLIC CHURCH
43.2%
16.0%
11.3%
4.5%
SOUTHERN BAPTIST CONVENTION
3.3%
0.7%
26.6%
7.8%
SEVENTH DAY ADVENTIST CHURCH
0.3%
0.4%
1.6%
3.3%
LUTHERAN CHURCH
0.2%
0.7%
1.0%
3.3%
EVANGELICAL LUTHERAN CHURCH IN AMERICA
0.1%
0.4%
1.0%
2.5%
Weather
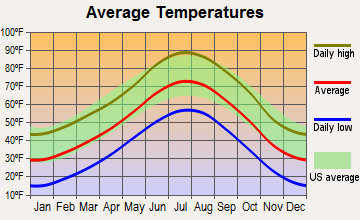
El Paso boasts of a hot desert climate with mild winters and hot summers, making it ideal for those who prefer warmer weather year-round. Conversely, Aurora's climate is relatively colder, offering a distinct four-season experience with cold, snowy winters and warm, sunny summers.
Weather and climate
Type
El Paso
Aurora
Temperature - Average
64.6°F
49.9°F
Humidity - Average morning or afternoon humidity
42.7%
50.6%
Humidity - Differences between morning and afternoon humidity
42.8%
20%
Humidity - Maximum monthly morning or afternoon humidity
59.8%
55%
Humidity - Minimum monthly morning or afternoon humidity
17%
35%
Precipitation - Yearly average
9.4 in
16.9 in
Snowfall - Yearly average
10.7 in
114 in
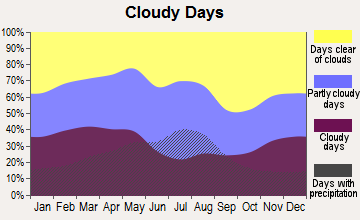
Clouds - Number of days clear of clouds
31.8%
19.2%
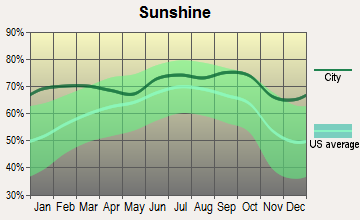
Sunshine amount - Average
89.4%
75.6%
Sunshine amount - Differences during a year
13.9%
10%
Sunshine amount - Maximum monthly
89.3%
74%
Sunshine amount - Minimum monthly
75.4%
64%
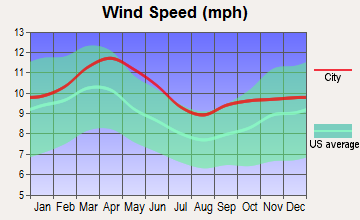
Wind speed - Average
8.9 mph
8.6 mph
Average climate in El Paso, Texas
Average climate in Aurora, Colorado
Air pollution
Type
AQI
CO
NO2
OZONE
PB
PM10
PM25
SO2
Year
El Paso
Aurora
El Paso
Aurora
El Paso
Aurora
El Paso
Aurora
El Paso
Aurora
El Paso
Aurora
El Paso
Aurora
El Paso
Aurora
2018
139
99
0.17
0.37
14.0
21.5
32.0
31.3
N/A
N/A
35.7
29.2
9.2
8.5
N/A
0.7
2017
173
95
0.19
0.37
13.0
21.9
30.5
31.1
N/A
N/A
40.4
22.0
9.5
8.5
0.5
0.9
2016
148
90
0.17
0.42
12.6
24.0
30.6
30.7
N/A
N/A
35.2
22.6
9.2
8.1
0.5
1.0
2015
112
101
0.18
0.44
12.7
22.8
30.8
29.5
N/A
N/A
31.2
20.6
8.0
9.5
0.5
1.1
2014
157
94
0.13
0.42
12.8
21.8
30.0
29.6
N/A
N/A
40.3
22.5
9.7
10.1
0.4
1.3
2013
211
84
0.23
0.39
14.1
19.6
30.5
29.9
N/A
N/A
43.9
21.9
10.8
N/A
0.4
1.4
2012
229
90
0.30
0.35
15.9
18.9
31.6
30.8
N/A
N/A
40.2
24.2
11.6
N/A
0.4
1.2
2011
221
91
0.23
0.34
15.9
18.1
31.2
30.9
N/A
N/A
34.7
23.8
11.6
N/A
0.5
1.5
2010
211
81
0.25
0.41
15.3
16.3
29.4
28.8
N/A
N/A
28.8
26.6
7.9
N/A
0.3
1.0
2009
117
79
0.23
0.37
15.4
14.1
29.5
27.1
N/A
0.005
28.6
22.6
8.3
N/A
0.3
1.3
2008
210
85
0.25
0.41
15.2
17.3
30.1
28.8
0.017
0.008
34.6
25.5
9.7
N/A
0.6
1.6
2007
134
96
0.28
0.42
13.9
20.6
30.6
25.4
0.019
0.007
40.5
28.8
8.4
N/A
0.4
1.2
2006
241
89
0.37
0.50
14.3
19.0
30.6
25.0
0.018
0.027
55.0
28.0
11.1
N/A
0.3
1.4
2005
159
86
0.43
0.57
13.1
21.3
29.6
22.5
0.013
0.109
44.5
29.6
9.6
N/A
0.6
1.5
2004
183
82
0.38
0.61
13.5
21.2
29.2
21.4
0.020
0.037
47.3
28.6
8.2
N/A
0.4
1.8
2003
278
106
0.46
0.62
15.5
21.2
29.5
23.1
0.039
0.040
60.4
32.6
10.8
N/A
0.6
1.9
2002
203
86
0.43
0.64
16.4
19.2
30.5
22.8
0.034
0.028
53.3
35.7
11.0
N/A
0.4
2.5
2001
139
95
0.51
0.79
15.5
24.0
28.7
20.4
0.046
0.030
N/A
32.6
9.8
N/A
0.7
2.6
2000
145
93
0.67
0.77
17.8
13.8
27.8
21.4
0.072
0.033
N/A
12.2
9.1
N/A
1.0
2.1
Natural disasters
Type
El Paso
Aurora
Tornado activity compared to U.S. average
4.2%
138.7%
Earthquake activity compared to U.S. average
524.4%
796.4%
Natural disasters compared to U.S. average
11%
11%
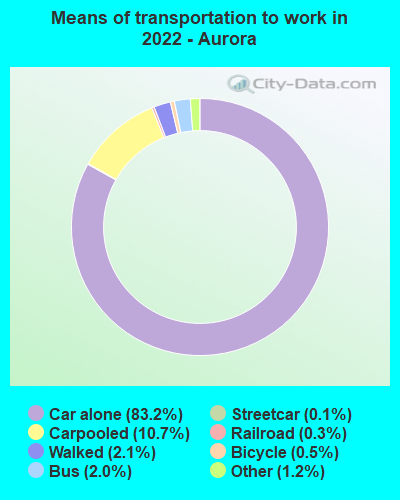
Transportation
El Paso's Sun Metro system provides public transit, and the city is easily traversable by car. Aurora is served by the Regional Transportation District, which provides bus and light rail services, ideal for both residents and tourists.
Transport
Type
El Paso
Aurora
Amtrak stations
1
0
Amtrak stations nearby
1
2
FAA registered aircraft
331
138
FAA registered aircraft manufacturers and dealers
6
19
Means of transportation to work
Type
El Paso
Aurora
Bicycle
0.3%
0.6%
Bus
1.3%
1.7%
Carpooled
11.2%
9.3%
Car alone
83.4%
84.4%
Motorcycle
0.2%
0.1%
Subway
0%
0.1%
Walked
1.6%
2.5%
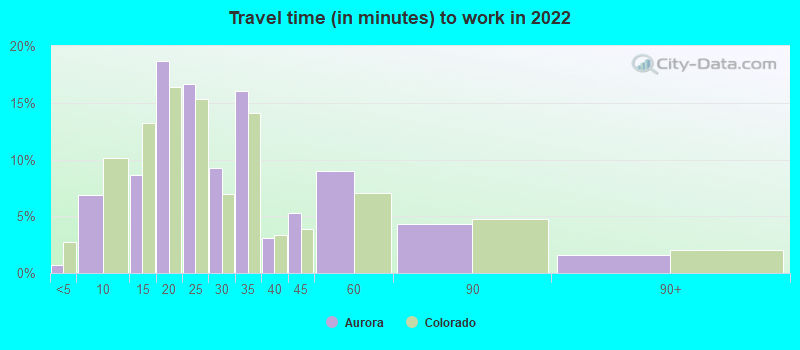
Average travel time to work
Type
El Paso
Aurora
Average
25.1 min
28.3 min
Other means
22.2 min
26.9 min
Public transportation
46.4 min
50.5 min
Private vehicle occupancy
Type
El Paso
Aurora
Average
1.2
1.2
Drove alone
88.5%
85.1%
In 2 person carpool
7.9%
10%
In 3 person carpool
2.1%
2.8%
In 4 person carpool
0.7%
1.5%
In 5-6 person carpool
0.7%
0.3%
In 7+ person carpool
0.1%
0.2%
How many people usually rode to work in the car, truck or van.
Real Estate
Real estate in El Paso is often cheaper than the national average, making homeownership more feasible for many families. In comparison, Aurora's real estate market can be higher, reflecting Colorado's overall hot housing market.
Neighborhoods
El Paso offers diverse neighborhoods from downtown's historic districts to newer suburban developments. Aurora features a mix of urban and suburban feel neighborhoods with a variety of housing options from apartments to large single-family homes.
Houses and residents
Type
El Paso
Aurora
Houses
261,779
149,636
Average household size (people)
3
2.7
Median year apartment built
1982
1986
Median year house/condo built
1985
1984
Length of stay in the house since moving in
14.7 years
10.4 years
Houses occupied
242,529 (92.6%)
140,003 (93.6%)
Houses occupied by owners
147,788 (60.9%)
89,615 (64%)
Houses occupied by renters
94,741 (39.1%)
50,388 (36%)
Median rent asked for vacant for-rent units
$570.82
$2,036
Median monthly housing costs
$939
$1,526
Median price asked for vacant for-sale houses and condos
$227,007
$725,445
Estimated median house or condo value
$152,800
$411,400
Median numbers of rooms
5.4
5.5
Median number of rooms in apartments
4.3
3.9
Median number of rooms in houses and condos
6.2
6.5
Median house price - detached houses
$187,761
$500,029
Median house price - in 2-unit structures
Over $1,000,000
$384,060
Median house price - in 3-to-4-unit structures
$75,782
$254,381
Median house price - in 5 or more unit structures
$266,003
$231,026
Median house price - mobile homes
$43,095
$130,226
Median house price - occupied boats, rvs, vans etc.
$9,296
$160,380
Median house price - Townhouses or other attached units
$149,459
$471,483
Median house price - All housing units
$186,951
$476,379
Median house age
38
36
Renting percentage
39.6%
40.1%
Housing density (houses/condos per square mile)
1,051
1,050.1
House value disparities
32.7%
23.6%
Household income disparities
46.6%
41.5%
Median household income for houses/condes with a mortgage
$74,665
$99,433
Median household income for apartments without a mortgage
$52,954
$63,316
Housing units without a mortgage
1,889 (2.2%)
424 (0.6%)
Housing units with both a second mortgage and home equity loan
2,956 (3.4%)
5,246 (7.8%)
Housing units with a mortgage
84,973 (97.8%)
66,791 (99.4%)
Housing units with a home equity loan
250 (0.3%)
176 (0.3%)
Housing units with a second mortgage
3,635 (4.2%)
6,860 (10.2%)
House/condo owner moved in on average (years ago)
14
7
House/condo renter moved in on average (years ago)
1
1
Housing units lacking complete kitchen facilities
2%
1%
Housing units lacking complete plumbing facilities
2%
0.6%
Housing units in structures
Housing units in structures
El Paso
Aurora
One, detached
67.7%
52.6%
One, attached
4.4%
11.9%
Two
2.4%
0.2%
3 or 4
4.1%
4.2%
5 to 9
5.9%
7.1%
10 to 19
5.8%
11.0%
20 to 49
2.4%
5.5%
50 or more
4.8%
5.7%
Mobile homes
2.3%
1.7%
Boats, RVs, vans, etc.
0.2%
0.0%
Median real estate property taxes paid for housing units
Self-employed workers in own not incorporated business
19,650
13,677
State government workers
12,525
5,134
Unpaid family workers
901
0
Industries and Occupations
Major occupations in El Paso include health care, education services, and retail jobs, while the top industries in Aurora include professional, scientific, and technical services, healthcare, retail, and education.
El Paso boasts quality healthcare, including several top-ranking hospitals. Aurora, having the Anschutz Medical Campus, a prominent hub of medical research and treatment, bolsters its healthcare sector.
Health (county statistics)
Type
El Paso
Aurora
General health status score of residents in this county from 1 (poor) to 5 (excellent)
El Paso's infrastructure includes extensive highway systems and the El Paso International Airport. Aurora, part of the developed Denver Metro, has extensive public transportation networks, including light rail systems, and Denver International Airport accessible nearby.
Infrastructure
Type
El Paso
Aurora
Hospitals
41
4
TV stations
10
15
Bank branches located here
89
77
Bank institutions located here
19
19
Main business address for public companies
7
1
Drinking water stations with no reported violations in the past
0
1
Drinking water stations with reported violations in the past
HMDA - Conventional home purchase loans - Applications denied
Year
El Paso
Aurora
1999
1,994
1,737
2000
993
1,460
2001
704
1,056
2002
594
635
2003
1,268
1,276
2004
1,646
2,052
2005
2,316
3,087
2006
2,701
2,880
2007
2,051
1,693
2008
1,034
782
2009
454
302
Culture and Food
El Paso's cultural scene is influenced by its Mexican heritage, yielding vibrant art, music, and food, especially Tex-Mex cuisine. Aurora's culture is more diverse, with a plethora of international cuisines, arts, and multicultural festivals.
Sports Teams
While El Paso hosts minor league teams like the El Paso Chihuahuas and Locomotive FC, Aurora, being part of the Denver Metropolitan area, offers proximity to major leagues like the Denver Broncos (NFL), Colorado Avalanche (NHL), and Colorado Rockies (MLB).


 El Paso, TX
 Aurora, CO