El Paso, the sixth-largest city in Texas, and Lubbock, the eleventh largest, offer diverse cultural experiences. From the perspective of a potential resident or a tourist, both cities have a distinctive vibe with unique offerings. Factors such as crime and safety, weather, cost of living, education, and the local economy come into play while comparing these two cities. Each city presents its advantages and disadvantages depending on an individual's preferences.
Distance between
El Paso, TX and
Lubbock, TX : 291.3 miles
El Paso's population is larger by 160%. Its population has grown by 114,753 people (20.4%) since 2000. The population of Lubbock has grown by 61,429 people (30.8%) during that time.
El Paso is nationally recognized as one of the safest large cities in the US, providing an edge over Lubbock in terms of safety. Lubbock, though generally safe, has a slightly higher crime rate. Both cities have local law enforcement departments regularly engaging with residents to enhance safety and create a sense of community, which is advantageous for both residents and tourists.
City-data.com crime index counts serious crimes and violent crime more heavily. It adjusts for the number of visitors and daily workers commuting into cities. (higher means more crime, U.S. average = 301.1)
City-data.com crime index counts serious crimes and violent crime more heavily. It adjusts for the number of visitors and daily workers commuting into cities. (higher means more crime, U.S. average = 301.1)
Sex Offenders
According to our data, there are 1,274 registered sex offenders living in El Paso and 595 registered sex offenders living in . The ratio of residents to sex offenders in El Paso is 536 to 1; the ratio in Lubbock is 424 to 1. The number of registered sex offenders compared to the number of residents is a smaller in El Paso than in Lubbock.
Cost of Living
The cost of living in both cities is below the national average, with Lubbock being slightly more expensive than El Paso. This difference factors in housing, groceries, utilities, transportation, and healthcare. Prospective residents considering relocation and tourists planning extended stays would find this comparison crucial.
Income Tax
Texas is one of seven states which does not impose a state income tax. As a result, neither city imposes city or state income taxes, presenting an economic advantage for potential residents.
Property Tax
El Paso's property tax rate is slightly higher than Lubbock's. However, both rates are subject to change based on local budget needs, and potential homeowners should refer to the most recent rates.
Sales Tax
Both cities have a similar sales tax rate, with El Paso's at 8.25% and Lubbock's at 8.25%. Both rates are applicable for residents and tourists alike and is on par with the statewide rate in Texas.
Income
Type
El Paso
Lubbock
Estimated median household income
$51,241
$54,747
Estimated per capita income
$25,670
$30,618
Cost of living index (U.S. average is 100)
82.2
83.8
If you make $50,000 in El Paso, you will have to make $50,973 in Lubbock to maintain the same standard of living.
Geographical Conditions
El Paso is located in the far Western corner of Texas and enjoys a mountainous desert landscape. This results in beautiful views and opportunities for outdoor activities such as hiking. In contrast, Lubbock is located on the flat South Plains, best known for its endless horizon and expansive cotton fields.
Both cities put a premium on education. Lubbock is home to Texas Tech University, one of the state's major educational institutions. El Paso houses the University of Texas at El Paso and multiple community colleges. Each city provides diverse educational opportunities from primary to higher education, promising good standards of education for families relocating with children.
El Paso has a diverse economy with a strong military and federal presence due to Fort Bliss and the nearby border with Mexico. Finance, healthcare, and education also contribute significantly to the city's economy. Lubbock relies more on education, agriculture, and healthcare, with Texas Tech University being the city's largest employer.
Biggest Employers
For El Paso, the biggest employers are Fort Bliss (U.S. Army post), local school districts, the University of Texas at El Paso, and the county and city government. Lubbock’s main employers are Texas Tech University, Covenant Health System, and University Medical Center.
There were 1,961 building permits issued in El Paso in 2012 (1005 less than in 2011) compared to 2,454 building permits issued in Lubbock in 2012 (1825 more than in 2011).
In El Paso (El Paso County), 65.5% voted for Democrats and 33.2% for Republicans in 2012 Presidential Election. In Lubbock (Lubbock County), 28.8% voted for Democrats and 69.6% for Republicans.
Elections
Type
Democrats
Republicans
Other
Year
El Paso
Lubbock
El Paso
Lubbock
El Paso
Lubbock
2020
66.8%
33.2%
31.6%
65.4%
1.6%
1.3%
2016
69.1%
28.3%
26.0%
66.4%
4.9%
5.3%
2012
65.5%
28.8%
33.2%
69.6%
1.3%
1.5%
2008
66.0%
31.3%
33.4%
68.1%
0.6%
0.7%
2004
56.2%
24.2%
43.3%
75.4%
0.5%
0.4%
2000
57.9%
24.4%
39.8%
73.9%
2.3%
1.7%
1996
62.3%
30.6%
32.1%
63.5%
5.6%
5.9%
Breakdown of population affiliated with a religious congregation
Type
Adherents
Congregations
Religion
El Paso
Lubbock
El Paso
Lubbock
CATHOLIC CHURCH
43.2%
13.0%
11.3%
5.0%
SOUTHERN BAPTIST CONVENTION
3.3%
16.1%
26.6%
31.5%
EPISCOPAL CHURCH
0.1%
0.7%
1.0%
0.9%
MUSLIM ESTIMATE
0.1%
1.8%
0.2%
0.6%
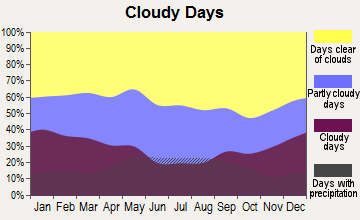
Weather
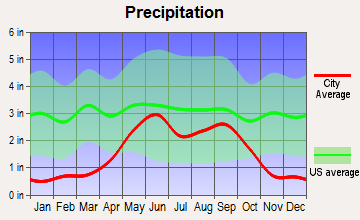
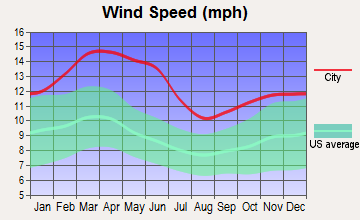
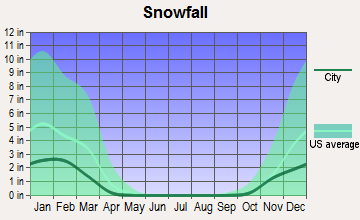
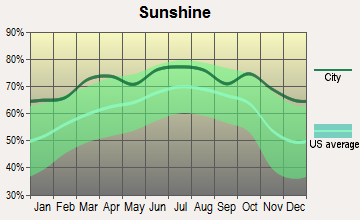
El Paso experiences more sunshine and a dry climate with mild winters which may be appealing for those who love temperate conditions. Lubbock, on the other hand, has a semi-arid climate that results in typically hot summers and cold winters with occasional snowfall. The high wind speeds in Lubbock, often leading to dust storms, might be less appealing to some.
Weather and climate
Type
El Paso
Lubbock
Temperature - Average
64.6°F
59.7°F
Humidity - Average morning or afternoon humidity
42.7%
64.4%
Humidity - Differences between morning and afternoon humidity
42.8%
42.3%
Humidity - Maximum monthly morning or afternoon humidity
59.8%
79.7%
Humidity - Minimum monthly morning or afternoon humidity
17%
37.4%
Precipitation - Yearly average
9.4 in
19 in
Snowfall - Yearly average
10.7 in
16.7 in
Clouds - Number of days clear of clouds
31.8%
26.6%
Sunshine amount - Average
89.4%
78.7%
Sunshine amount - Differences during a year
13.9%
16.7%
Sunshine amount - Maximum monthly
89.3%
80%
Sunshine amount - Minimum monthly
75.4%
63.3%
Wind speed - Average
8.9 mph
12.8 mph
Average climate in El Paso, Texas
Average climate in Lubbock, Texas
Air pollution
Type
AQI
CO
NO2
OZONE
PB
PM10
PM25
SO2
Year
El Paso
Lubbock
El Paso
El Paso
El Paso
El Paso
El Paso
El Paso
Lubbock
El Paso
2018
139
62
0.17
N/A
14.0
N/A
32.0
N/A
N/A
N/A
35.7
N/A
9.2
6.6
N/A
N/A
2017
173
56
0.19
N/A
13.0
N/A
30.5
N/A
N/A
N/A
40.4
N/A
9.5
6.3
0.5
N/A
2016
148
N/A
0.17
N/A
12.6
N/A
30.6
N/A
N/A
N/A
35.2
N/A
9.2
N/A
0.5
N/A
2015
112
N/A
0.18
N/A
12.7
N/A
30.8
N/A
N/A
N/A
31.2
N/A
8.0
N/A
0.5
N/A
2014
157
61
0.13
N/A
12.8
N/A
30.0
N/A
N/A
N/A
40.3
N/A
9.7
7.6
0.4
N/A
2013
211
68
0.23
N/A
14.1
N/A
30.5
N/A
N/A
N/A
43.9
N/A
10.8
7.5
0.4
N/A
2012
229
76
0.30
N/A
15.9
N/A
31.6
N/A
N/A
N/A
40.2
N/A
11.6
9.0
0.4
N/A
2011
221
81
0.23
N/A
15.9
N/A
31.2
N/A
N/A
N/A
34.7
N/A
11.6
9.1
0.5
N/A
2010
211
57
0.25
N/A
15.3
N/A
29.4
N/A
N/A
N/A
28.8
N/A
7.9
6.7
0.3
N/A
2009
117
59
0.23
N/A
15.4
N/A
29.5
N/A
N/A
N/A
28.6
N/A
8.3
7.0
0.3
N/A
2008
210
N/A
0.25
N/A
15.2
N/A
30.1
N/A
0.017
N/A
34.6
N/A
9.7
N/A
0.6
N/A
2007
134
N/A
0.28
N/A
13.9
N/A
30.6
N/A
0.019
N/A
40.5
N/A
8.4
N/A
0.4
N/A
2006
241
N/A
0.37
N/A
14.3
N/A
30.6
N/A
0.018
N/A
55.0
N/A
11.1
N/A
0.3
N/A
2005
159
N/A
0.43
N/A
13.1
N/A
29.6
N/A
0.013
N/A
44.5
N/A
9.6
N/A
0.6
N/A
2004
183
N/A
0.38
N/A
13.5
N/A
29.2
N/A
0.020
N/A
47.3
N/A
8.2
N/A
0.4
N/A
2003
278
N/A
0.46
N/A
15.5
N/A
29.5
N/A
0.039
N/A
60.4
N/A
10.8
N/A
0.6
N/A
2002
203
N/A
0.43
N/A
16.4
N/A
30.5
N/A
0.034
N/A
53.3
N/A
11.0
N/A
0.4
N/A
2001
139
N/A
0.51
N/A
15.5
N/A
28.7
N/A
0.046
N/A
N/A
N/A
9.8
N/A
0.7
N/A
2000
145
N/A
0.67
N/A
17.8
N/A
27.8
N/A
0.072
N/A
N/A
N/A
9.1
N/A
1.0
N/A
Natural disasters
Type
El Paso
Lubbock
Tornado activity compared to U.S. average
4.2%
166%
Earthquake activity compared to U.S. average
524.4%
535.5%
Natural disasters compared to U.S. average
11%
14%
Transportation
El Paso's Sun Metro bus system and Lubbock's Citibus provide public transit options in both cities. El Paso also provides an international transit system connecting the city with Ciudad Juarez in Mexico, while Lubbock’s more small-town layout translates to less traffic and shorter commute times.
Transport
Type
El Paso
Lubbock
Amtrak stations
1
0
Amtrak stations nearby
1
0
FAA registered aircraft
331
293
FAA registered aircraft manufacturers and dealers
6
0
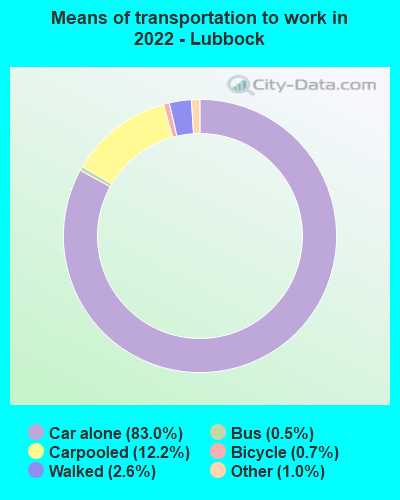
Means of transportation to work
Type
El Paso
Lubbock
Bicycle
0.3%
0.3%
Bus
1.3%
0.8%
Carpooled
11.2%
9.6%
Car alone
83.4%
86.4%
Motorcycle
0.2%
0.2%
Walked
1.6%
1.9%
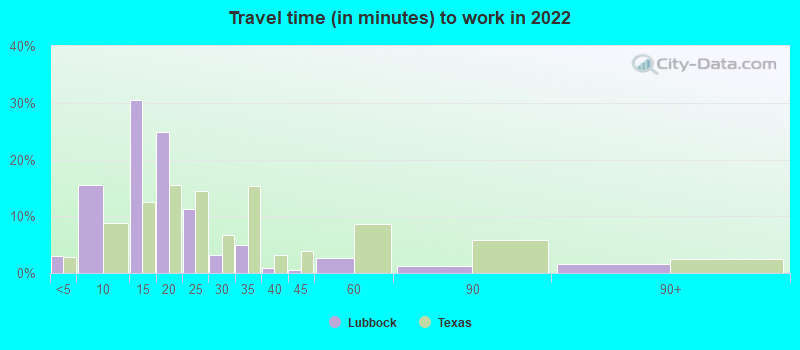
Average travel time to work
Type
El Paso
Lubbock
Average
25.1 min
18.2 min
Other means
22.2 min
18 min
Public transportation
46.4 min
31.3 min
Private vehicle occupancy
Type
El Paso
Lubbock
Average
1.2
1.2
Drove alone
88.5%
89.3%
In 2 person carpool
7.9%
7.9%
In 3 person carpool
2.1%
1%
In 4 person carpool
0.7%
0.6%
In 5-6 person carpool
0.7%
1.2%
How many people usually rode to work in the car, truck or van.
Real Estate
In comparison to Lubbock, El Paso’s real estate market is more affordable, making it attractive for prospective residents. However, the upward trending Lubbock market shows a promise of investment returns, generating interest among property buyers and investors.
Neighborhoods
El Paso's neighborhoods, including Kern Place and Sunset Heights, provide a mix of urban and suburban lifestyles. Lubbock, with neighborhoods like Tech Terrace and Clapp Park, offers a family-friendly environment with a close-knit community feel. An examination of neighborhoods is crucial for potential residents considering the city's lifestyle and culture.
Houses and residents
Type
El Paso
Lubbock
Houses
261,779
113,800
Average household size (people)
3
2.5
Median year apartment built
1982
1985
Median year house/condo built
1985
1985
Length of stay in the house since moving in
14.7 years
12.4 years
Houses occupied
242,529 (92.6%)
104,426 (91.8%)
Houses occupied by owners
147,788 (60.9%)
53,722 (51.4%)
Houses occupied by renters
94,741 (39.1%)
50,704 (48.6%)
Median rent asked for vacant for-rent units
$570.82
$760.15
Median monthly housing costs
$939
$1,010
Median price asked for vacant for-sale houses and condos
$227,007
$431,965
Estimated median house or condo value
$152,800
$171,400
Median numbers of rooms
5.4
5.2
Median number of rooms in apartments
4.3
4
Median number of rooms in houses and condos
6.2
6.2
Median house price - detached houses
$187,761
$217,964
Median house price - in 2-unit structures
Over $1,000,000
$266,863
Median house price - in 3-to-4-unit structures
$75,782
$270,056
Median house price - in 5 or more unit structures
$266,003
$186,477
Median house price - mobile homes
$43,095
$60,138
Median house price - occupied boats, rvs, vans etc.
$9,296
$28,841
Median house price - Townhouses or other attached units
$149,459
$159,383
Median house price - All housing units
$186,951
$215,105
Median house age
38
37
Renting percentage
39.6%
45.4%
Housing density (houses/condos per square mile)
1,051
991.2
House value disparities
32.7%
37.4%
Household income disparities
46.6%
48.2%
Median household income for houses/condes with a mortgage
$74,665
$96,150
Median household income for apartments without a mortgage
$52,954
$60,175
Housing units without a mortgage
1,889 (2.2%)
244 (0.8%)
Housing units with both a second mortgage and home equity loan
2,956 (3.4%)
577 (1.9%)
Housing units with a mortgage
84,973 (97.8%)
29,683 (99.2%)
Housing units with a home equity loan
250 (0.3%)
0 (0%)
Housing units with a second mortgage
3,635 (4.2%)
705 (2.4%)
House/condo owner moved in on average (years ago)
14
9
House/condo renter moved in on average (years ago)
1
1
Housing units lacking complete kitchen facilities
2%
2.9%
Housing units lacking complete plumbing facilities
2%
1.9%
Housing units in structures
Housing units in structures
El Paso
Lubbock
One, detached
67.7%
64.8%
One, attached
4.4%
2.7%
Two
2.4%
3.6%
3 or 4
4.1%
5.0%
5 to 9
5.9%
6.5%
10 to 19
5.8%
5.4%
20 to 49
2.4%
2.8%
50 or more
4.8%
6.9%
Mobile homes
2.3%
2.2%
Boats, RVs, vans, etc.
0.2%
0.1%
Median real estate property taxes paid for housing units
Self-employed workers in own not incorporated business
19,650
8,411
State government workers
12,525
10,797
Unpaid family workers
901
523
Industries and Occupations
El Paso's largest industries include defense, government, healthcare, and education, with a majority of the workforce employed by local government agencies, hospitals, and school districts. Lubbock's economy is more agriculture-based, with education and healthcare also providing significant employment. The high-tech industry is also growing in Lubbock, with several startups establishing their presence.
Both cities have robust healthcare options. El Paso's healthcare is dominated by University Medical Center of El Paso and Las Palmas & Del Sol Medical Centers, providing high-quality medical care. Lubbock, being a regional hub for healthcare, hosts the Covenant Health System and University Medical Center, both offer excellent medical services.
Health (county statistics)
Type
El Paso
Lubbock
General health status score of residents in this county from 1 (poor) to 5 (excellent)
El Paso boasts expansive infrastructure that includes international airports and an intricate highway system. Its proximity to the Mexican border lends it a crucial role in international trade. Lubbock's infrastructure, while smaller, supports efficient transportation and commercial activities, with the Lubbock Preston Smith International Airport proving crucial for air travel.
Infrastructure
Type
El Paso
Lubbock
Hospitals
41
36
TV stations
10
13
Arenas or stadiums
2
3
Bank branches located here
89
97
Bank institutions located here
19
22
Main business address for public companies
7
3
Drinking water stations with no reported violations in the past
0
3
Drinking water stations with reported violations in the past
HMDA - Conventional home purchase loans - Applications denied
Year
El Paso
Lubbock
1999
1,994
1,025
2000
993
673
2001
704
472
2002
594
402
2003
1,268
0
2004
1,646
542
2005
2,316
566
2006
2,701
565
2007
2,051
343
2008
1,034
161
2009
454
115
Culture and Food
El Paso's culture is heavily influenced by its proximity to Mexico, leading to a vibrant blend of Tex-Mex cuisine and cultural festivals. Lubbock, the birthplace of Buddy Holly, is renowned for its music scene and is also home to award-winning wineries. Both cities offer rich cultural experiences for residents and tourists.
Sports Teams
El Paso is home to the El Paso Chihuahuas (Minor League Baseball) and the Locomotive FC (soccer). Lubbock's sports scene centers around Texas Tech University's Red Raiders. Both cities have a passionate local fan base, bolstering their community spirit.


 El Paso, TX
 Lubbock, TX