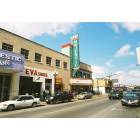
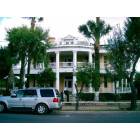
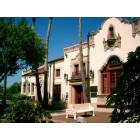
Fort Worth and Brownsville, despite being located in the same state of Texas, offer two distinct lifestyles. Fort Worth, a bustling city in North Texas, is known for its rodeos, humming economy, and cultural attractions. Brownsville, located by the Mexican border, is a more compact city, known for its warm Mexican-American culture, proximity to serene beaches, and lower cost of living. It's important to factor in crime, cost of living, education, economic opportunities, and cultural amenities when considering relocation or a visit to these cities.
Distance between
Fort Worth, TX and
Brownsville, TX : 470.5 miles
Fort Worth's population is larger by 398%. Its population has grown by 400,814 people (75.0%) since 2000. The population of Brownsville has grown by 48,109 people (34.4%) during that time.
On the safety scale, both Fort Worth and Brownsville have higher crime rates than the national average. Fort Worth's crime rate is marginally higher than Brownsville's. While neither city is considered particularly unsafe, crime is a factor to consider when moving or visiting. Fort Worth PD and Brownsville PD both undertake periodic community outreach programs to keep residents informed.
City-data.com crime index counts serious crimes and violent crime more heavily. It adjusts for the number of visitors and daily workers commuting into cities. (higher means more crime, U.S. average = 301.1)
City-data.com crime index counts serious crimes and violent crime more heavily. It adjusts for the number of visitors and daily workers commuting into cities. (higher means more crime, U.S. average = 301.1)
Sex Offenders
According to our data, there are 3,166 registered sex offenders living in Fort Worth and 336 registered sex offenders living in . The ratio of residents to sex offenders in Fort Worth is 270 to 1; the ratio in Brownsville is 546 to 1. The number of registered sex offenders compared to the number of residents is larger in Fort Worth than in Brownsville.
Cost of Living
Brownsville generally has a lower cost of living compared to Fort Worth, particularly in housing costs. Groceries, healthcare, and transportation costs are also somewhat lower in Brownsville. However, Fort Worth's higher cost of living is offset by higher median household income.
Property Tax
Property taxes in Fort Worth are significantly higher than in Brownsville, reflecting the higher property values in Fort Worth. However, Texas in general has high property tax rates compared to the rest of the U.S.
Sales Tax
Texas as a state doesn't levy income taxes; however, it does have a relatively high state sales tax. Both cities apply the statewide sales tax of 6.25%, with Fort Worth adding an additional 2% and Brownsville adding an additional 1.5%.
Income
Type
Fort Worth
Brownsville
Estimated median household income
$68,235
$47,435
Estimated per capita income
$34,106
$19,429
Cost of living index (U.S. average is 100)
95.4
78.6
If you make $50,000 in Brownsville, you will have to make $60,687 in Fort Worth to maintain the same standard of living.
Geographical Conditions
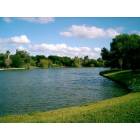
Fort Worth is a large inland city, marked by flat terrain and located on the Edwards Plateau. Meanwhile, Brownsville is coastal, located in the Rio Grande Valley, with proximity to the Gulf of Mexico and the beaches of South Padre Island.
Both cities have good educational institutions. Fort Worth has more universities and colleges, including Texas Christian University and Texas Wesleyan University. Brownsville houses the University of Texas Rio Grande Valley, offering comprehensive courses. The school district performance in both cities is similar, with plenty of elementary, middle, and high schools.
Fort Worth's economy is diverse, with strengths in sectors like aerospace, technology, logistics, and healthcare. Brownsville's economy, while not as diverse, has robust sectors in retail, education, and healthcare. Unemployment rates are generally lower in Fort Worth than Brownsville.
Biggest Employers
The largest employers in Fort Worth include American Airlines, Lockheed Martin, and Texas Health Resources. In Brownsville, the biggest employers are the Brownsville Independent School District, the University of Texas Rio Grande Valley, and the city of Brownsville itself.
There were 7,236 building permits issued in Fort Worth in 2012 (4810 more than in 2011) compared to 883 building permits issued in Brownsville in 2012 (272 more than in 2011).
In Fort Worth (Tarrant County), 41.4% voted for Democrats and 57.1% for Republicans in 2012 Presidential Election. In Brownsville (Cameron County), 65.2% voted for Democrats and 34.1% for Republicans.
Elections
Type
Democrats
Republicans
Other
Year
Fort Worth
Brownsville
Fort Worth
Brownsville
Fort Worth
Brownsville
2020
49.3%
56.1%
49.1%
43.0%
1.6%
0.9%
2016
43.2%
64.6%
51.8%
32.1%
5.0%
3.3%
2012
41.4%
65.2%
57.1%
34.1%
1.4%
0.7%
2008
43.8%
63.8%
55.5%
35.1%
0.7%
1.2%
2004
37.0%
49.2%
62.5%
50.4%
0.5%
0.4%
2000
36.9%
53.5%
60.9%
44.8%
2.3%
1.7%
1996
41.6%
61.8%
50.9%
32.6%
7.5%
5.6%
Breakdown of population affiliated with a religious congregation
Type
Adherents
Congregations
Religion
Fort Worth
Brownsville
Fort Worth
Brownsville
SOUTHERN BAPTIST CONVENTION
17.3%
4.0%
33.3%
17.7%
CATHOLIC CHURCH
11.1%
33.9%
1.9%
11.6%
MUSLIM ESTIMATE
2.2%
0.6%
0.9%
0.3%
LUTHERAN CHURCH
0.5%
0.3%
0.9%
1.8%
SEVENTH DAY ADVENTIST CHURCH
0.4%
0.3%
1.6%
2.1%
EPISCOPAL CHURCH
0.3%
0.4%
0.8%
1.5%
Weather
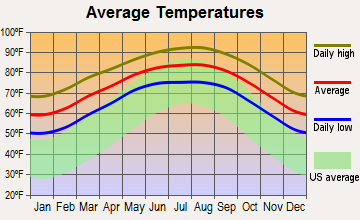
If you prefer mild winters and hot, humid summers, Fort Worth is a better choice. It offers a semi-arid climate with mostly sunny days throughout the year. On the other hand, Brownsville is subtropical, with hot, humid summers and mild to cool winters. Its proximity to the coast results in frequent rainfall and spots of beach weather.
Weather and climate
Type
Fort Worth
Brownsville
Temperature - Average
65°F
73.3°F
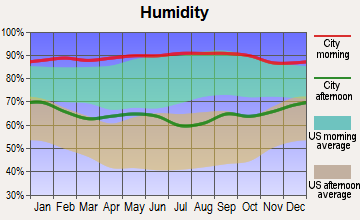
Humidity - Average morning or afternoon humidity
71.4%
81.1%
Humidity - Differences between morning and afternoon humidity
34.1%
37%
Humidity - Maximum monthly morning or afternoon humidity
82.1%
92%
Humidity - Minimum monthly morning or afternoon humidity
48%
55%
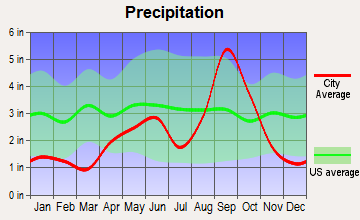
Precipitation - Yearly average
35 in
27.7 in
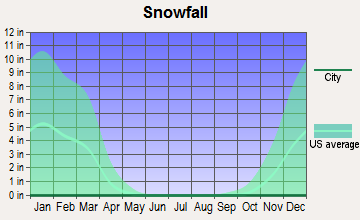
Snowfall - Yearly average
4.2 in
0 in
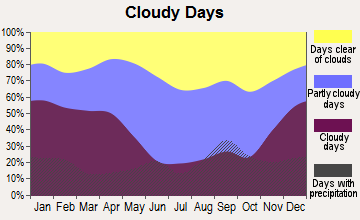
Clouds - Number of days clear of clouds
22.8%
16.1%
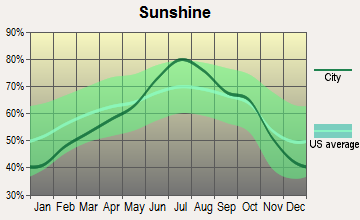
Sunshine amount - Average
66.6%
64.8%
Sunshine amount - Differences during a year
20%
42%
Sunshine amount - Maximum monthly
74%
80%
Sunshine amount - Minimum monthly
54%
38%
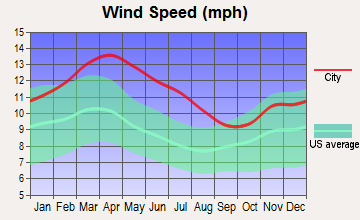
Wind speed - Average
10.3 mph
11.2 mph
Average climate in Fort Worth, Texas
Average climate in Brownsville, Texas
Air pollution
Type
AQI
CO
NO2
OZONE
PB
PM10
PM25
SO2
Year
Fort Worth
Brownsville
Fort Worth
Fort Worth
Fort Worth
Brownsville
Brownsville
Brownsville
Fort Worth
Brownsville
Fort Worth
2018
67
74
N/A
N/A
5.8
N/A
27.1
23.7
N/A
N/A
N/A
N/A
N/A
10.3
N/A
N/A
2017
67
58
N/A
N/A
6.2
N/A
27.2
23.7
N/A
N/A
N/A
N/A
N/A
8.4
N/A
N/A
2016
56
77
N/A
N/A
6.3
N/A
25.5
22.9
N/A
N/A
N/A
N/A
N/A
9.1
N/A
N/A
2015
61
77
N/A
N/A
6.5
N/A
24.8
22.1
N/A
N/A
N/A
N/A
N/A
9.4
N/A
N/A
2014
56
75
0.22
N/A
6.8
N/A
26.6
23.6
N/A
N/A
N/A
N/A
N/A
9.4
N/A
N/A
2013
64
74
0.25
N/A
6.4
N/A
26.5
25.0
N/A
N/A
N/A
N/A
N/A
9.3
N/A
N/A
2012
87
71
0.26
N/A
7.8
N/A
30.3
26.1
N/A
N/A
23.1
N/A
N/A
10.6
N/A
N/A
2011
79
72
0.23
N/A
7.9
N/A
30.7
27.2
N/A
N/A
22.7
N/A
N/A
10.6
N/A
N/A
2010
70
78
0.23
N/A
8.5
N/A
27.7
27.2
N/A
N/A
19.7
N/A
N/A
10.0
N/A
N/A
2009
81
73
0.25
N/A
8.7
N/A
29.5
26.1
N/A
N/A
23.8
N/A
N/A
11.0
N/A
N/A
2008
69
77
0.25
N/A
9.6
N/A
25.8
25.4
0.004
N/A
22.7
N/A
N/A
11.5
N/A
N/A
2007
75
74
0.30
N/A
10.6
N/A
24.6
23.5
0.003
N/A
27.0
N/A
N/A
10.8
N/A
N/A
2006
90
79
0.34
N/A
10.2
N/A
29.7
25.6
0.004
N/A
33.4
N/A
N/A
10.8
N/A
N/A
2005
102
79
0.34
N/A
10.9
N/A
28.4
26.7
0.003
N/A
29.4
N/A
11.3
11.1
0.9
N/A
2004
78
69
0.39
N/A
10.6
N/A
25.4
24.0
0.004
N/A
31.7
N/A
N/A
N/A
N/A
N/A
2003
82
74
0.40
N/A
11.1
N/A
27.2
24.2
0.008
N/A
38.1
N/A
N/A
N/A
N/A
N/A
2002
94
76
0.37
N/A
11.8
N/A
25.8
24.9
0.008
N/A
37.5
N/A
N/A
N/A
N/A
N/A
2001
16
59
0.48
N/A
N/A
N/A
N/A
24.7
0.008
N/A
32.3
N/A
N/A
N/A
N/A
N/A
2000
17
48
0.55
N/A
N/A
N/A
N/A
23.6
0.009
N/A
N/A
N/A
N/A
N/A
N/A
N/A
Natural disasters
Type
Fort Worth
Brownsville
Tornado activity compared to U.S. average
249.6%
18.3%
Earthquake activity compared to U.S. average
562.8%
17.2%
Natural disasters compared to U.S. average
23%
23%
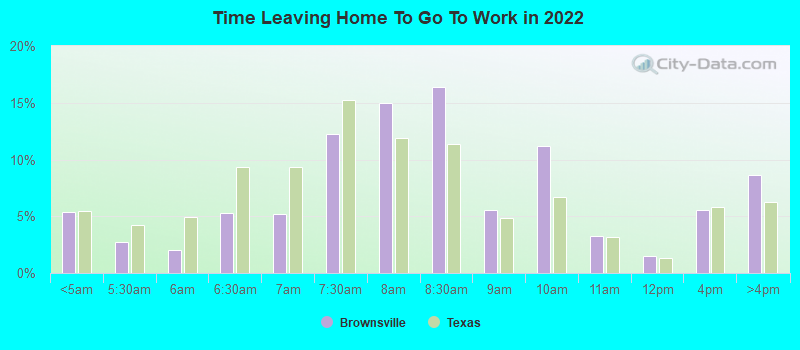
Transportation
Fort Worth provides a range of public transportation options, including buses, trains, and bike-share programs, with the average commute being about 25 minutes. Brownsville also offers public transportation with a lower average commute of about 20 minutes.
Transport
Type
Fort Worth
Brownsville
Amtrak stations
1
1
Amtrak stations nearby
1
1
FAA registered aircraft
2
60
FAA registered aircraft manufacturers and dealers
19
7
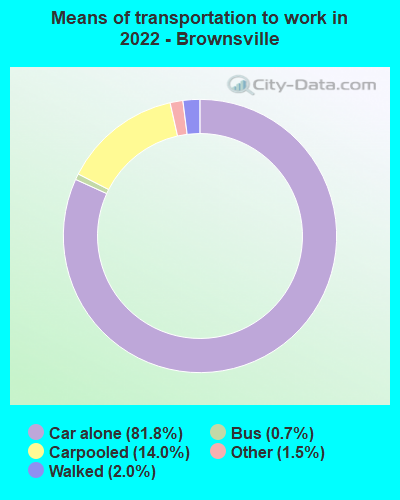
Means of transportation to work
Type
Fort Worth
Brownsville
Bicycle
0.1%
0.1%
Bus
0.4%
0.7%
Carpooled
11%
9.6%
Car alone
85.8%
86.6%
Motorcycle
0.1%
0.1%
Taxicab
0.1%
0.1%
Walked
1.3%
1.7%
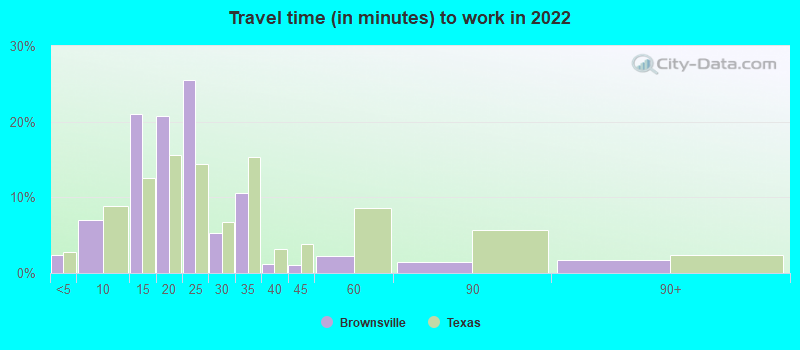
Average travel time to work
Type
Fort Worth
Brownsville
Average
28.5 min
21.7 min
Other means
25.3 min
21 min
Public transportation
41.8 min
39.3 min
Private vehicle occupancy
Type
Fort Worth
Brownsville
Average
1.2
1.2
Drove alone
87.6%
85.8%
In 2 person carpool
8.5%
9.8%
In 3 person carpool
2.5%
3.4%
In 4 person carpool
1.1%
0.4%
In 5-6 person carpool
0.3%
0.5%
In 7+ person carpool
0.1%
0.1%
How many people usually rode to work in the car, truck or van.
Real Estate
Real estate is more expensive in Fort Worth, reflecting its larger economy and higher median household income. Brownsville tends to be more affordable, with lower average house prices and rental costs.
Neighborhoods
Both cities have diverse neighborhoods, from bustling downtown districts to quiet suburbs. Some of the best neighborhoods in Fort Worth include Tanglewood and Mistletoe Heights. Brownsville offers appealing neighborhoods such as Rancho Viejo and Olmito.
Houses and residents
Type
Fort Worth
Brownsville
Houses
361,341
62,000
Average household size (people)
2.8
3.5
Median year apartment built
1991
1990
Median year house/condo built
1995
1998
Length of stay in the house since moving in
11.2 years
14.2 years
Houses occupied
334,286 (92.5%)
56,522 (91.2%)
Houses occupied by owners
185,197 (55.4%)
34,440 (60.9%)
Houses occupied by renters
149,089 (44.6%)
22,082 (39.1%)
Median rent asked for vacant for-rent units
$1,068
$396.05
Median monthly housing costs
$1,328
$721
Median price asked for vacant for-sale houses and condos
$288,576
$221,063
Estimated median house or condo value
$249,000
$104,100
Median numbers of rooms
5.3
4.8
Median number of rooms in apartments
4.2
3.9
Median number of rooms in houses and condos
6.3
5.3
Median house price - detached houses
$279,885
$124,259
Median house price - in 2-unit structures
Over $1,000,000
Over $1,000,000
Median house price - in 3-to-4-unit structures
$337,081
$73,104
Median house price - in 5 or more unit structures
$298,062
$97,341
Median house price - mobile homes
$58,470
$47,840
Median house price - occupied boats, rvs, vans etc.
$16,069
$34,926
Median house price - Townhouses or other attached units
$279,957
$133,815
Median house price - All housing units
$279,281
$130,508
Median house age
29
27
Renting percentage
40.8%
37.8%
Housing density (houses/condos per square mile)
1,235.2
771.1
House value disparities
31.8%
35.7%
Household income disparities
43.6%
46.1%
Median household income for houses/condes with a mortgage
$106,170
$74,174
Median household income for apartments without a mortgage
$72,147
$41,503
Housing units without a mortgage
2,986 (2.4%)
96 (0.7%)
Housing units with both a second mortgage and home equity loan
3,696 (3%)
172 (1.2%)
Housing units with a mortgage
121,099 (97.6%)
14,310 (99.3%)
Housing units with a home equity loan
66 (0.1%)
0 (0%)
Housing units with a second mortgage
5,171 (4.2%)
169 (1.2%)
House/condo owner moved in on average (years ago)
8
14
House/condo renter moved in on average (years ago)
1
1
Housing units lacking complete kitchen facilities
1.8%
2.8%
Housing units lacking complete plumbing facilities
0.7%
2.6%
Housing units in structures
Housing units in structures
Fort Worth
Brownsville
One, detached
65.4%
72.1%
One, attached
2.9%
1.0%
Two
1.6%
3.6%
3 or 4
4.1%
6.5%
5 to 9
5.8%
2.5%
10 to 19
6.5%
2.4%
20 to 49
4.6%
3.4%
50 or more
7.0%
4.0%
Mobile homes
2.1%
4.4%
Boats, RVs, vans, etc.
0.0%
0.2%
Median real estate property taxes paid for housing units
Self-employed workers in own not incorporated business
27,257
4,372
State government workers
8,587
1,984
Unpaid family workers
392
261
Industries and Occupations
Fort Worth's chief industries include aviation, logistics, and technology, with significant contributions also from healthcare and education. In Brownsville, the most common industries are retail trade, healthcare, and education services. Thus, opportunities in these sectors are more abundant.
Both cities offer ample healthcare facilities. Fort Worth has major hospitals like the Texas Health Harris Methodist Hospital and Baylor Scott & White All Saints Medical Center. Brownsville also has competent healthcare facilities, including Valley Baptist Medical Center and South Texas Rehabilitation Hospital.
Fort Worth enjoys a developed infrastructure with a robust public transit system and well-maintained roads. Brownsville, being smaller, has less extensive but adequate infrastructure, including good connectivity via buses and a well-maintained road network.
Infrastructure
Type
Fort Worth
Brownsville
Hospitals
76
7
TV stations
25
12
Bank branches located here
175
40
Bank institutions located here
42
15
Drinking water stations with no reported violations in the past
3
1
Drinking water stations with reported violations in the past
HMDA - Conventional home purchase loans - Applications denied
Year
Fort Worth
Brownsville
1999
3,575
489
2000
2,473
157
2001
2,109
124
2002
1,701
107
2003
2,183
364
2004
3,202
554
2005
4,261
685
2006
4,161
874
2007
2,871
612
2008
1,256
230
2009
585
105
Culture and Food
Fort Worth is home to several museums and a vibrant dining scene, featuring barbecue and Mexican cuisine. In contrast, Brownsville promotes a rich Mexican-American culture, with local cuisine influenced by its proximity to the Mexico border.
Sports Teams
Fort Worth residents generally support the Dallas-Fort Worth area teams, including the Dallas Cowboys (NFL), Dallas Mavericks (NBA), and Texas Rangers (MLB). Brownsville has no major league sports teams, but residents closely follow local university and school teams.


 Fort Worth, TX
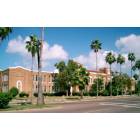
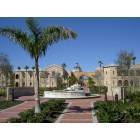
 Brownsville, TX