Fort Worth, Texas, known for its cowboy roots and cultural institutions, and Durham, North Carolina, the research and technology hub, offer distinctive lifestyles for residents and visitors. In comparison, each city presents unique qualities in crime and safety, weather, cost of living, education, work and economy, and more. However, whether you're looking to relocate or just visit, your choice between these cities will largely depend on your preference for lower costs, world-class education, meteorological conditions, job market, and distinctive cultures.
Distance between
Fort Worth, TX and
Durham, NC : 1,072.9 miles
Fort Worth's population is larger by 228%. Its population has grown by 400,814 people (75.0%) since 2000. The population of Durham has grown by 98,492 people (52.7%) during that time.
Fort Worth's crime rate is relatively higher than that of Durham, but both cities have initiatives in place to maintain safety. This can be a bit concerning to potential residents and tourists. However, respective law enforcement agencies in both cities are continually devising effective strategies to lower crime rates. It would be beneficial for newcomers to connect with neighborhood associations to understand the safety dynamics of their intended area of residence or visit.
City-data.com crime index counts serious crimes and violent crime more heavily. It adjusts for the number of visitors and daily workers commuting into cities. (higher means more crime, U.S. average = 301.1)
City-data.com crime index counts serious crimes and violent crime more heavily. It adjusts for the number of visitors and daily workers commuting into cities. (higher means more crime, U.S. average = 301.1)
Sex Offenders
According to our data, there are 3,166 registered sex offenders living in Fort Worth and 391 registered sex offenders living in . The ratio of residents to sex offenders in Fort Worth is 270 to 1; the ratio in Durham is 673 to 1. The number of registered sex offenders compared to the number of residents is larger in Fort Worth than in Durham.
Cost of Living
The cost of living in Fort Worth is generally lower compared to Durham due to less expensive housing, groceries, and healthcare. Property taxes in Fort Worth also tend to be higher compared to Durham. However, decisions on relocation may also take into account other factors such as income levels, job opportunities, and personal lifestyle choices.
Income Tax
While North Carolina has state income tax, Texas, and consequently Fort Worth, does not charge any state income tax, which can be beneficial for high-income earners.
Property Tax
While property taxes in Fort Worth are higher than those in Durham, the overall cost of living might still be lower due to other factors like housing costs and state income tax.
Sales Tax
Both Texas and North Carolina do have sales tax, but Texas doesn't levy state income tax which might be a factor for some, considering financial aspects.
Income
Type
Fort Worth
Durham
Estimated median household income
$68,235
$71,343
Estimated per capita income
$34,106
$42,469
Cost of living index (U.S. average is 100)
95.4
94.1
If you make $50,000 in Durham, you will have to make $50,691 in Fort Worth to maintain the same standard of living.
Geographical Conditions
Geographically, Fort Worth, with its flat terrain, could be preferable for those seeking outdoor activities like cycling and hiking. Durham, on the other hand, offers more varied landscapes with close proximity to both mountains and beaches.
When it comes to education, Durham hosts prominent educational institutions, including Duke University. Fort Worth also has respectable educational institutions but Durham's pre-eminence in education, especially in research, may tip the scale for families with college-bound children or those seeking higher education opportunities.
Fort Worth's economy is highly diversified featuring aviation, healthcare, and technology. Durham is known for its robust economy based on a high-tech industry and cutting-edge research carried out at institutions like Duke University. Comparable job opportunities can be found in both cities but the higher salary potential in Durham's tech industry may be a determining factor for some.
Biggest Employers
In Fort Worth, the biggest employers are American Airlines, Lockheed Martin, and NAS Fort Worth JRB. Durham hosts global corporations like IBM and GlaxoSmithKline besides Duke University itself.
There were 7,236 building permits issued in Fort Worth in 2012 (4810 more than in 2011) compared to 1,960 building permits issued in Durham in 2012 (1077 more than in 2011).
In Fort Worth (Tarrant County), 41.4% voted for Democrats and 57.1% for Republicans in 2012 Presidential Election. In Durham (Durham County), 75.8% voted for Democrats and 23.0% for Republicans.
Elections
Type
Democrats
Republicans
Other
Year
Fort Worth
Durham
Fort Worth
Durham
Fort Worth
Durham
2020
49.3%
80.5%
49.1%
18.1%
1.6%
1.4%
2016
43.2%
77.7%
51.8%
18.2%
5.0%
4.2%
2012
41.4%
75.8%
57.1%
23.0%
1.4%
1.2%
2008
43.8%
75.8%
55.5%
23.7%
0.7%
0.5%
2004
37.0%
68.0%
62.5%
31.6%
0.5%
0.3%
2000
36.9%
63.8%
60.9%
35.7%
2.3%
0.5%
1996
41.6%
60.8%
50.9%
34.4%
7.5%
4.8%
Breakdown of population affiliated with a religious congregation
Type
Adherents
Congregations
Religion
Fort Worth
Durham
Fort Worth
Durham
SOUTHERN BAPTIST CONVENTION
17.3%
9.7%
33.3%
20.3%
CATHOLIC CHURCH
11.1%
3.9%
1.9%
1.3%
MUSLIM ESTIMATE
2.2%
0.7%
0.9%
1.6%
LUTHERAN CHURCH
0.5%
0.1%
0.9%
0.3%
SEVENTH DAY ADVENTIST CHURCH
0.4%
0.4%
1.6%
2.0%
EPISCOPAL CHURCH
0.3%
1.0%
0.8%
2.0%
EVANGELICAL LUTHERAN CHURCH IN AMERICA
0.3%
0.4%
0.9%
1.3%
PRESBYTERIAN CHURCH IN AMERICA
0.1%
0.4%
0.4%
0.3%
AMERICAN BAPTIST CHURCHES IN THE USA
0.0%
3.2%
0.1%
2.9%
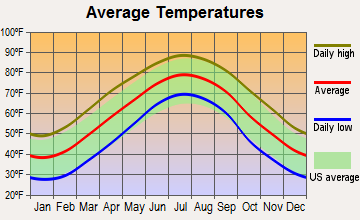
Weather
Durham enjoys a humid subtropical climate with hot summers and mild winters, while Fort Worth experiences a humid subtropical climate as well with hot summers and cool winters. While Durham's winter temperatures typically are not extreme, Fort Worth residents do enjoy more sunshine throughout the year. This weather contrast may be an important point of consideration for those deliberating between the two cities.
Weather and climate
Type
Fort Worth
Durham
Temperature - Average
65°F
59°F
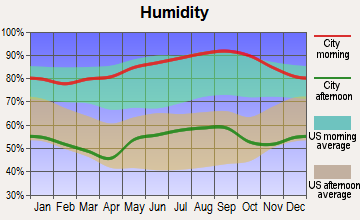
Humidity - Average morning or afternoon humidity
71.4%
73.7%
Humidity - Differences between morning and afternoon humidity
34.1%
44%
Humidity - Maximum monthly morning or afternoon humidity
82.1%
90%
Humidity - Minimum monthly morning or afternoon humidity
48%
46%
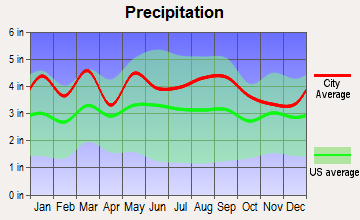
Precipitation - Yearly average
35 in
47.5 in
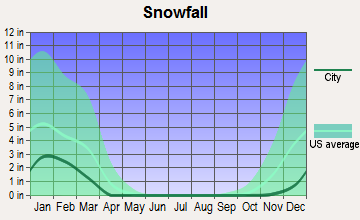
Snowfall - Yearly average
4.2 in
13.4 in
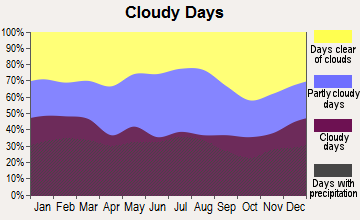
Clouds - Number of days clear of clouds
22.8%
18.5%
Sunshine amount - Average
66.6%
63.9%
Sunshine amount - Differences during a year
20%
13%
Sunshine amount - Maximum monthly
74%
64%
Sunshine amount - Minimum monthly
54%
51%
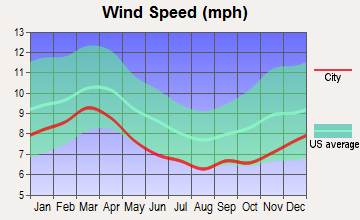
Wind speed - Average
10.3 mph
7.1 mph
Average climate in Fort Worth, Texas
Average climate in Durham, North Carolina
Air pollution
Type
AQI
CO
NO2
OZONE
PM10
PM25
SO2
Year
Fort Worth
Durham
Fort Worth
Durham
Fort Worth
Durham
Fort Worth
Durham
Durham
Fort Worth
Durham
Fort Worth
Durham
2018
67
70
N/A
0.23
5.8
8.0
27.1
27.9
12.7
N/A
N/A
8.8
N/A
0.3
2017
67
68
N/A
0.23
6.2
8.6
27.2
25.8
13.3
N/A
N/A
9.2
N/A
0.2
2016
56
79
N/A
0.23
6.3
8.5
25.5
25.8
7.9
N/A
N/A
9.4
N/A
0.3
2015
61
78
N/A
0.27
6.5
8.9
24.8
27.6
12.4
N/A
N/A
9.0
N/A
0.5
2014
56
74
0.22
0.26
6.8
9.7
26.6
29.7
N/A
N/A
N/A
8.2
N/A
0.3
2013
64
73
0.25
0.26
6.4
N/A
26.5
26.4
N/A
N/A
N/A
8.0
N/A
0.2
2012
87
77
0.26
0.28
7.8
N/A
30.3
29.0
N/A
N/A
N/A
8.4
N/A
0.6
2011
79
83
0.23
0.27
7.9
N/A
30.7
32.0
N/A
N/A
N/A
9.8
N/A
0.7
2010
70
94
0.23
0.30
8.5
N/A
27.7
31.2
N/A
N/A
N/A
10.1
N/A
1.0
2009
81
78
0.25
0.33
8.7
N/A
29.5
25.3
N/A
N/A
N/A
9.8
N/A
1.0
2008
69
95
0.25
0.39
9.6
N/A
25.8
30.1
N/A
N/A
N/A
13.1
N/A
1.5
2007
75
98
0.30
0.40
10.6
N/A
24.6
35.4
N/A
N/A
N/A
13.9
N/A
1.2
2006
90
90
0.34
0.43
10.2
N/A
29.7
30.1
N/A
N/A
N/A
13.5
N/A
0.9
2005
102
73
0.34
0.41
10.9
N/A
28.4
31.4
N/A
N/A
11.3
N/A
0.9
2.5
2004
78
63
0.39
0.44
10.6
N/A
25.4
27.9
N/A
N/A
N/A
N/A
N/A
3.7
2003
82
84
0.40
N/A
11.1
N/A
27.2
29.4
N/A
N/A
N/A
N/A
N/A
3.0
2002
94
89
0.37
N/A
11.8
N/A
25.8
35.3
N/A
N/A
N/A
N/A
N/A
2.6
2001
16
86
0.48
N/A
N/A
N/A
N/A
30.7
N/A
N/A
N/A
N/A
N/A
2.2
2000
17
102
0.55
0.65
N/A
N/A
N/A
32.4
N/A
N/A
N/A
N/A
N/A
N/A
Natural disasters
Type
Fort Worth
Durham
Tornado activity compared to U.S. average
249.6%
84.9%
Earthquake activity compared to U.S. average
562.8%
55.7%
Natural disasters compared to U.S. average
23%
16%
Transportation
Though both cities do have public transportation, owning a vehicle can be more beneficial for convenience and flexibility. This is particularly true in Fort Worth which boasts of a more extensive freeway and tollway structure.
Transport
Type
Fort Worth
Durham
Amtrak stations
1
1
Amtrak stations nearby
1
2
FAA registered aircraft
2
100
FAA registered aircraft manufacturers and dealers
19
4
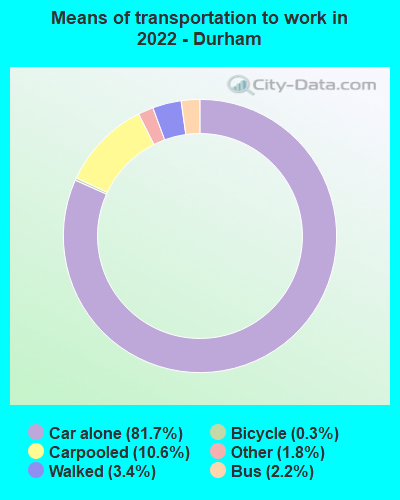
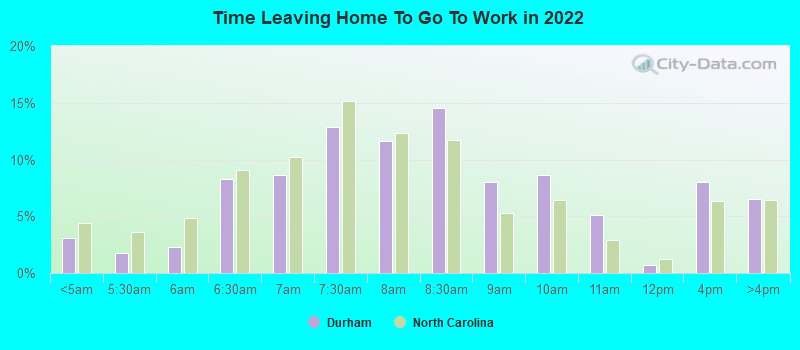
Means of transportation to work
Type
Fort Worth
Durham
Bicycle
0.1%
0.6%
Bus
0.4%
1.3%
Carpooled
11%
9.3%
Car alone
85.8%
84.4%
Motorcycle
0.1%
0.1%
Railroad
0%
0.1%
Taxicab
0.1%
0.2%
Walked
1.3%
2.1%
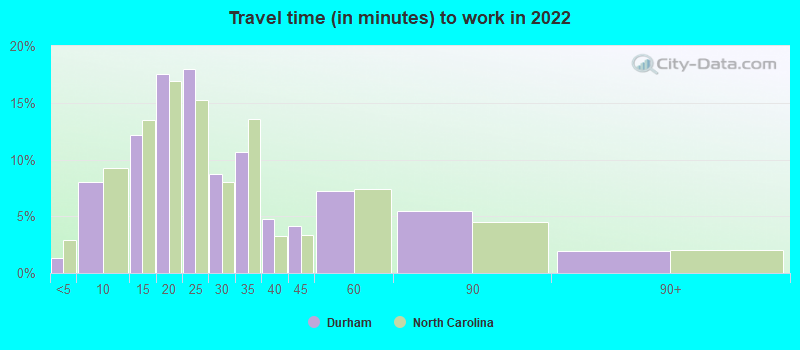
Average travel time to work
Type
Fort Worth
Durham
Average
28.5 min
27.4 min
Other means
25.3 min
21.3 min
Public transportation
41.8 min
36.9 min
Private vehicle occupancy
Type
Fort Worth
Durham
Average
1.2
1.2
Drove alone
87.6%
89.5%
In 2 person carpool
8.5%
7.9%
In 3 person carpool
2.5%
2.2%
In 4 person carpool
1.1%
0.1%
In 5-6 person carpool
0.3%
0%
In 7+ person carpool
0.1%
0.4%
How many people usually rode to work in the car, truck or van.
Real Estate
Real estate pricing in Durham is on a higher side compared to Fort Worth, reflecting the demand due to its high-tech sector and world-class universities.
Neighborhoods
Both cities offer a variety of neighborhoods to match diverse lifestyle preferences. While Durham is known for neighborhoods with historic charm, Fort Worth offers everything from vibrant downtown living to quieter suburban neighborhoods.
Houses and residents
Type
Fort Worth
Durham
Houses
361,341
131,917
Average household size (people)
2.8
2.3
Median year apartment built
1991
1994
Median year house/condo built
1995
1995
Length of stay in the house since moving in
11.2 years
10.7 years
Houses occupied
334,286 (92.5%)
122,412 (92.8%)
Houses occupied by owners
185,197 (55.4%)
62,550 (51.1%)
Houses occupied by renters
149,089 (44.6%)
59,862 (48.9%)
Median rent asked for vacant for-rent units
$1,068
$2,314
Median monthly housing costs
$1,328
$1,261
Median price asked for vacant for-sale houses and condos
$288,576
$117,283
Estimated median house or condo value
$249,000
$325,000
Median numbers of rooms
5.3
5.1
Median number of rooms in apartments
4.2
4
Median number of rooms in houses and condos
6.3
6.6
Median house price - detached houses
$279,885
$361,977
Median house price - in 2-unit structures
Over $1,000,000
$169,611
Median house price - in 3-to-4-unit structures
$337,081
$259,774
Median house price - in 5 or more unit structures
$298,062
$194,008
Median house price - mobile homes
$58,470
$83,086
Median house price - Townhouses or other attached units
$279,957
$286,940
Median house price - All housing units
$279,281
$350,027
Median house age
29
26
Renting percentage
40.8%
50.2%
Housing density (houses/condos per square mile)
1,235.2
1,394
House value disparities
31.8%
29.7%
Household income disparities
43.6%
44.4%
Median household income for houses/condes with a mortgage
$106,170
$106,360
Median household income for apartments without a mortgage
$72,147
$79,496
Housing units without a mortgage
2,986 (2.4%)
1,538 (3.1%)
Housing units with both a second mortgage and home equity loan
3,696 (3%)
3,157 (6.4%)
Housing units with a mortgage
121,099 (97.6%)
47,533 (96.9%)
Housing units with a home equity loan
66 (0.1%)
99 (0.2%)
Housing units with a second mortgage
5,171 (4.2%)
3,728 (7.6%)
House/condo owner moved in on average (years ago)
8
6
House/condo renter moved in on average (years ago)
1
1
Housing units lacking complete kitchen facilities
1.8%
1.1%
Housing units lacking complete plumbing facilities
0.7%
0.6%
Housing units in structures
Housing units in structures
Fort Worth
Durham
One, detached
65.4%
50.1%
One, attached
2.9%
9.8%
Two
1.6%
2.5%
3 or 4
4.1%
5.2%
5 to 9
5.8%
8.5%
10 to 19
6.5%
11.1%
20 to 49
4.6%
4.5%
50 or more
7.0%
8.1%
Mobile homes
2.1%
0.3%
Median real estate property taxes paid for housing units
Self-employed workers in own not incorporated business
27,257
5,381
State government workers
8,587
13,743
Unpaid family workers
392
371
Industries and Occupations
Durham is often called "The City of Medicine" due to its huge healthcare sector, while Fort Worth is home to the headquarters of diverse large corporations. Both cities offer numerous opportunities depending on the industry one is interested in.
Both cities are prominent healthcare hubs with notable hospitals. Durham, with Duke University Hospital and the city's emphasis on healthcare industry, might have an edge.
Health (county statistics)
Type
Fort Worth
Durham
General health status score of residents in this county from 1 (poor) to 5 (excellent)
Both cities have developed infrastructure, with Fort Worth boasting a more extensive freeway and tollway systems, and Durham holding its own with well-led infrastructure growth, particularly in public transportation and pedestrian-friendly initiatives.
Infrastructure
Type
Fort Worth
Durham
Hospitals
76
18
TV stations
25
25
Arenas or stadiums
7
1
Bank branches located here
175
63
Bank institutions located here
42
14
Main business address for public companies
24
7
Drinking water stations with no reported violations in the past
3
2
Drinking water stations with reported violations in the past
HMDA - Conventional home purchase loans - Applications denied
Year
Fort Worth
Durham
1999
3,575
991
2000
2,473
666
2001
2,109
510
2002
1,701
440
2003
2,183
369
2004
3,202
485
2005
4,261
593
2006
4,161
846
2007
2,871
610
2008
1,256
231
2009
585
144
Culture and Food
Fort Worth offers cowboy culture, rodeo shows, and hearty Texan steakhouses. Durham, on the other hand, is known for its rich history, vibrant arts scene, and notable North Carolina-style barbecue.
Sports Teams
Sports enthusiasts might favor Fort Worth, home to the famous Dallas Cowboys and Texas Rangers. Durham has minor league teams, but it's also close to other major sports cities.


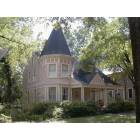


 Fort Worth, TX
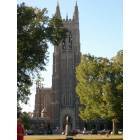
 Durham, NC