Overview
Living in Fort Worth, Texas, and Gilbert, Arizona, has significant differences when it comes to cost of living, climate, and lifestyle. Both cities have their unique charm and offer a quality life. A comparison between these cities would give you a clearer picture, aiding you in making a more informed decision. Every aspect including climate, cost of living, education, infrastructure, culture, healthcare, and taxes are taken into consideration.
Distance between
Fort Worth, TX and
Gilbert, AZ : 836.0 miles
Fort Worth's population is larger by 243%. Its population has grown by 400,814 people (75.0%) since 2000. The population of Gilbert has grown by 163,439 people (149.0%) during that time.
Fort Worth is generally considered a safe city but has slightly higher crime rates as compared to Gilbert. However, it's important to note that crime can vary significantly across different neighborhoods in both cities. Gilbert, on the other hand, frequently ranks as one of the safest cities in the United States, helping residents feel secure.
City-data.com crime index counts serious crimes and violent crime more heavily. It adjusts for the number of visitors and daily workers commuting into cities. (higher means more crime, U.S. average = 301.1)
City-data.com crime index counts serious crimes and violent crime more heavily. It adjusts for the number of visitors and daily workers commuting into cities. (higher means more crime, U.S. average = 301.1)
Sex Offenders
According to our data, there are 3,166 registered sex offenders living in Fort Worth and 57 registered sex offenders living in . The ratio of residents to sex offenders in Fort Worth is 270 to 1; the ratio in Gilbert is 4,160 to 1. The number of registered sex offenders compared to the number of residents is much larger in Fort Worth than that in Gilbert.
Cost of Living
Generally, the cost of living in Fort Worth is slightly lower than in Gilbert; this includes housing, utilities, and groceries. However, it's essential to consider individual lifestyle and spending habits.
Income Tax
Texas does not levy state income tax, which can be beneficial for residents in Fort Worth, but Arizona does have a progressive state income tax system, affecting residents in Gilbert.
Property Tax
Property taxes are generally higher in Texas than in Arizona, so homeowners in Fort Worth could expect to pay more compared to those in Gilbert.
Sales Tax
Sales tax in Fort Worth is 8.25%, and in Gilbert, it is slightly higher at 8.4%.
Income
Type
Fort Worth
Gilbert
Estimated median household income
$68,235
$104,802
Estimated per capita income
$34,106
$44,911
Cost of living index (U.S. average is 100)
95.4
101.3
If you make $50,000 in Fort Worth, you will have to make $53,092 in Gilbert to maintain the same standard of living.
Geographical Conditions
Fort Worth is characterized by its flat terrain and prairie landscapes, while Gilbert is located in the Sonoran Desert and experiences very minimal rainfall throughout the year.
Both Fort Worth and Gilbert are home to excellent public and private schools. Fort Worth also has more in terms of higher education with multiple universities. Gilbert, although smaller, maintains a high standard of education, with easy access to higher education institutions in the wider Phoenix Metropolitan Area.
The economy of Fort Worth is diverse with dominant sectors like aerospace, healthcare, and education, whereas Gilbert's economy is primarily driven by healthcare, finance, and education. Unemployment rates can vary but are generally lower in Gilbert.
Biggest Employers
In Fort Worth, Lockheed Martin Aeronautics, American Airlines, and the Naval Air Station are among the biggest employers. In Gilbert, Banner Health, Gilbert Public Schools, and GoDaddy are the leading employers.
There were 7,236 building permits issued in Fort Worth in 2012 (4810 more than in 2011) compared to 1,470 building permits issued in Gilbert in 2012 (71 less than in 2011).
In Fort Worth (Tarrant County), 41.4% voted for Democrats and 57.1% for Republicans in 2012 Presidential Election. In Gilbert (Maricopa County), 43.6% voted for Democrats and 54.3% for Republicans.
Elections
Type
Democrats
Republicans
Other
Year
Fort Worth
Gilbert
Fort Worth
Gilbert
Fort Worth
Gilbert
2020
49.3%
50.2%
49.1%
48.0%
1.6%
1.8%
2016
43.2%
44.9%
51.8%
47.7%
5.0%
7.5%
2012
41.4%
43.6%
57.1%
54.3%
1.4%
2.1%
2008
43.8%
44.0%
55.5%
54.5%
0.7%
1.5%
2004
37.0%
42.4%
62.5%
57.0%
0.5%
0.6%
2000
36.9%
43.0%
60.9%
53.4%
2.3%
3.6%
1996
41.6%
44.5%
50.9%
47.2%
7.5%
8.2%
Breakdown of population affiliated with a religious congregation
Type
Adherents
Congregations
Religion
Fort Worth
Gilbert
Fort Worth
Gilbert
SOUTHERN BAPTIST CONVENTION
17.3%
1.9%
33.3%
6.5%
CATHOLIC CHURCH
11.1%
13.6%
1.9%
4.3%
MUSLIM ESTIMATE
2.2%
0.2%
0.9%
1.0%
LUTHERAN CHURCH
0.5%
0.5%
0.9%
1.5%
SEVENTH DAY ADVENTIST CHURCH
0.4%
0.4%
1.6%
2.0%
EPISCOPAL CHURCH
0.3%
0.3%
0.8%
1.3%
EVANGELICAL LUTHERAN CHURCH IN AMERICA
0.3%
0.8%
0.9%
2.0%
VINEYARD USA
0.0%
0.3%
0.2%
0.6%
Weather
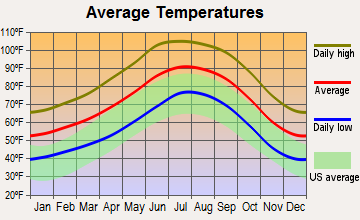
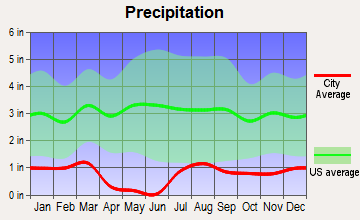
Fort Worth experiences a humid subtropical climate with hot, humid summers, and mild to cool winters, with regular rainfall evenly spread throughout the year. Gilbert, being in the desert, has a hot desert climate with very hot summers and mild winters, but rainfall is considerably less.
Weather and climate
Type
Fort Worth
Gilbert
Temperature - Average
65°F
71.5°F
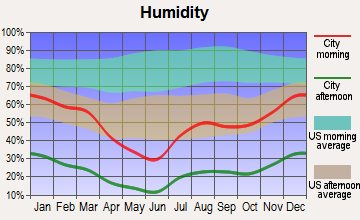
Humidity - Average morning or afternoon humidity
71.4%
37.5%
Humidity - Differences between morning and afternoon humidity
34.1%
48%
Humidity - Maximum monthly morning or afternoon humidity
82.1%
60%
Humidity - Minimum monthly morning or afternoon humidity
48%
12%
Precipitation - Yearly average
35 in
9.3 in
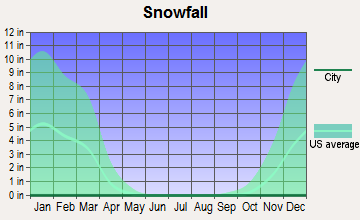
Snowfall - Yearly average
4.2 in
0 in
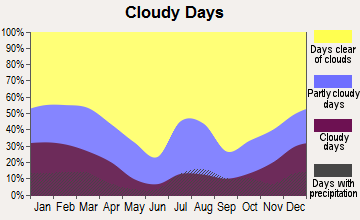
Clouds - Number of days clear of clouds
22.8%
35.2%
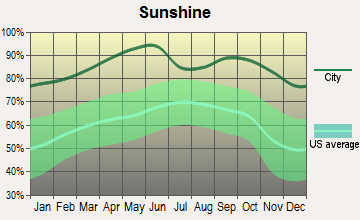
Sunshine amount - Average
66.6%
92.8%
Sunshine amount - Differences during a year
20%
16%
Sunshine amount - Maximum monthly
74%
95%
Sunshine amount - Minimum monthly
54%
79%
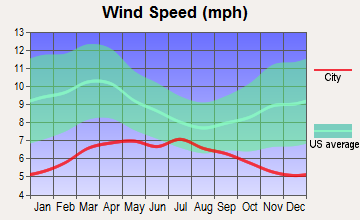
Wind speed - Average
10.3 mph
6.6 mph
Average climate in Fort Worth, Texas
Average climate in Gilbert, Arizona
Air pollution
Type
AQI
CO
NO2
OZONE
PM10
PM25
SO2
Year
Fort Worth
Gilbert
Fort Worth
Gilbert
Fort Worth
Gilbert
Fort Worth
Gilbert
Gilbert
Fort Worth
Gilbert
Fort Worth
Gilbert
2018
67
201
N/A
0.30
5.8
15.2
27.1
32.8
38.7
N/A
N/A
7.7
N/A
0.6
2017
67
131
N/A
0.33
6.2
15.9
27.2
33.0
37.2
N/A
N/A
7.9
N/A
1.4
2016
56
124
N/A
0.34
6.3
15.8
25.5
32.4
29.8
N/A
N/A
7.0
N/A
0.4
2015
61
104
N/A
0.38
6.5
17.6
24.8
31.3
25.1
N/A
N/A
7.1
N/A
0.9
2014
56
135
0.22
0.40
6.8
19.7
26.6
31.0
35.1
N/A
N/A
8.5
N/A
1.1
2013
64
142
0.25
0.35
6.4
20.0
26.5
32.1
35.0
N/A
N/A
7.1
N/A
0.9
2012
87
159
0.26
0.39
7.8
21.3
30.3
31.5
38.5
N/A
N/A
8.7
N/A
1.3
2011
79
205
0.23
0.36
7.9
18.8
30.7
31.7
39.6
N/A
N/A
9.5
N/A
0.9
2010
70
100
0.23
0.39
8.5
16.8
27.7
31.2
30.6
N/A
N/A
8.3
N/A
1.2
2009
81
109
0.25
0.42
8.7
17.0
29.5
31.1
38.4
N/A
N/A
N/A
N/A
1.1
2008
69
106
0.25
0.37
9.6
18.0
25.8
32.1
40.2
N/A
N/A
N/A
N/A
1.2
2007
75
135
0.30
0.43
10.6
19.9
24.6
30.0
53.0
N/A
N/A
N/A
N/A
1.9
2006
90
138
0.34
0.51
10.2
22.5
29.7
30.2
61.9
N/A
N/A
N/A
N/A
1.8
2005
102
109
0.34
0.57
10.9
23.0
28.4
28.2
51.2
N/A
11.3
N/A
0.9
1.8
2004
78
97
0.39
0.58
10.6
22.8
25.4
28.0
33.5
N/A
N/A
N/A
N/A
1.4
2003
82
99
0.40
0.65
11.1
24.3
27.2
29.1
42.6
N/A
N/A
N/A
N/A
1.4
2002
94
110
0.37
0.75
11.8
25.2
25.8
28.0
41.8
N/A
N/A
N/A
N/A
1.6
2001
16
105
0.48
0.73
N/A
24.1
N/A
26.7
37.8
N/A
N/A
N/A
N/A
1.5
2000
17
117
0.55
0.73
N/A
29.7
N/A
27.3
45.6
N/A
N/A
N/A
N/A
1.7
Natural disasters
Type
Fort Worth
Gilbert
Tornado activity compared to U.S. average
249.6%
18.3%
Earthquake activity compared to U.S. average
562.8%
2,340.4%
Natural disasters compared to U.S. average
23%
16%
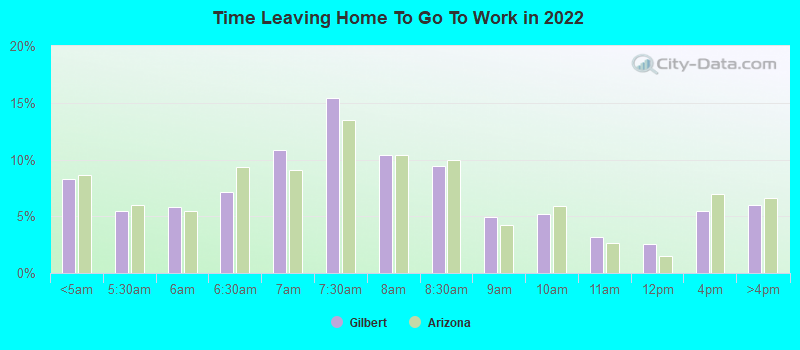
Transportation
Public transportation in Fort Worth includes buses, taxis, and the Trinity Railway Express for inter-city transit. In Gilbert, public transit is more limited but the Greater Phoenix area provides extensive options.
Transport
Type
Fort Worth
Gilbert
Amtrak stations
1
0
Amtrak stations nearby
1
2
FAA registered aircraft
2
235
FAA registered aircraft manufacturers and dealers
19
5
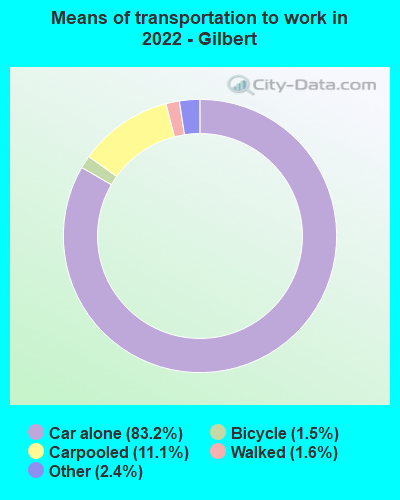
Means of transportation to work
Type
Fort Worth
Gilbert
Bicycle
0.1%
0.9%
Bus
0.4%
0.4%
Carpooled
11%
11.3%
Car alone
85.8%
84.2%
Motorcycle
0.1%
0.5%
Walked
1.3%
1.6%
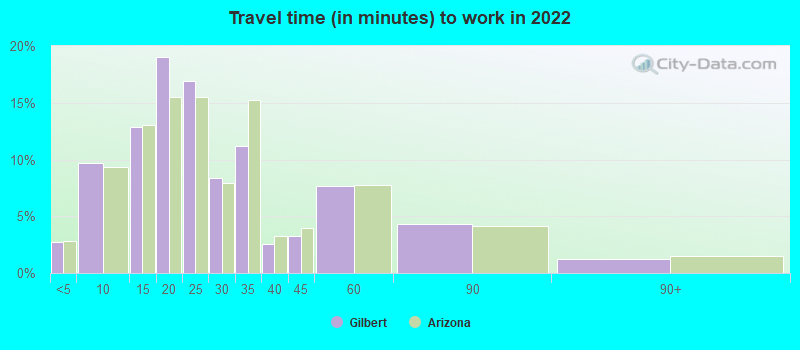
Average travel time to work
Type
Fort Worth
Gilbert
Average
28.5 min
24.4 min
Other means
25.3 min
29.5 min
Public transportation
41.8 min
54.2 min
Private vehicle occupancy
Type
Fort Worth
Gilbert
Average
1.2
1.1
Drove alone
87.6%
90.7%
In 2 person carpool
8.5%
7%
In 3 person carpool
2.5%
1.3%
In 4 person carpool
1.1%
0.5%
In 5-6 person carpool
0.3%
0.5%
How many people usually rode to work in the car, truck or van.
Real Estate
The housing market in Fort Worth is somewhat affordable compared to the national average. On the other hand, Gilbert's real estate is above the national average but it has a higher median household income.
Neighborhoods
Both cities boast an array of beautiful neighborhoods. Fort Worth is known for its historic and trendy areas like Tanglewood and Arlington Heights. In Gilbert, neighborhoods like Power Ranch and Seville are popular for their family-friendly environment.
Houses and residents
Type
Fort Worth
Gilbert
Houses
361,341
95,508
Average household size (people)
2.8
3
Median year apartment built
1991
2004
Median year house/condo built
1995
2002
Length of stay in the house since moving in
11.2 years
8.9 years
Houses occupied
334,286 (92.5%)
93,472 (97.9%)
Houses occupied by owners
185,197 (55.4%)
69,983 (74.9%)
Houses occupied by renters
149,089 (44.6%)
23,489 (25.1%)
Median rent asked for vacant for-rent units
$1,068
$2,843
Median monthly housing costs
$1,328
$1,709
Median price asked for vacant for-sale houses and condos
$288,576
$332,809
Estimated median house or condo value
$249,000
$484,600
Median numbers of rooms
5.3
6.3
Median number of rooms in apartments
4.2
4.5
Median number of rooms in houses and condos
6.3
6.8
Median house age
29
18
Renting percentage
40.8%
24.7%
Housing density (houses/condos per square mile)
1,235.2
2,223.4
House value disparities
31.8%
22.3%
Household income disparities
43.6%
36.9%
Median household income for houses/condes with a mortgage
$106,170
$122,725
Median household income for apartments without a mortgage
$72,147
$97,218
Housing units without a mortgage
2,986 (2.4%)
1,076 (1.9%)
Housing units with both a second mortgage and home equity loan
3,696 (3%)
2,828 (5%)
Housing units with a mortgage
121,099 (97.6%)
55,398 (98.1%)
Housing units with a home equity loan
66 (0.1%)
175 (0.3%)
Housing units with a second mortgage
5,171 (4.2%)
3,491 (6.2%)
House/condo owner moved in on average (years ago)
8
6
House/condo renter moved in on average (years ago)
1
1
Housing units lacking complete kitchen facilities
1.8%
0.7%
Housing units lacking complete plumbing facilities
0.7%
0.2%
Housing units in structures
Housing units in structures
Fort Worth
Gilbert
One, detached
65.4%
82.5%
One, attached
2.9%
2.6%
Two
1.6%
0.5%
3 or 4
4.1%
1.3%
5 to 9
5.8%
2.5%
10 to 19
6.5%
3.4%
20 to 49
4.6%
1.6%
50 or more
7.0%
5.3%
Mobile homes
2.1%
0.2%
Median real estate property taxes paid for housing units
Both Fort Worth and Gilbert have quality healthcare facilities. Fort Worth is home to the John Peter Smith Hospital, while Gilbert houses the award-winning Banner Health System.
Health (county statistics)
Type
Fort Worth
Gilbert
General health status score of residents in this county from 1 (poor) to 5 (excellent)
Fort Worth boasts modern infrastructure with excellent amenities, although some roads and public transportation facilities could need improvement. Gilbert also has modern infrastructure and is regularly maintained and updated.
Infrastructure
Type
Fort Worth
Gilbert
Hospitals
76
4
TV stations
25
20
Bank branches located here
175
52
Bank institutions located here
42
16
Drinking water stations with no reported violations in the past
3
0
Drinking water stations with reported violations in the past
HMDA - Conventional home purchase loans - Applications denied
Year
Fort Worth
Gilbert
1999
3,575
501
2000
2,473
296
2001
2,109
209
2002
1,701
235
2003
2,183
625
2004
3,202
931
2005
4,261
1,315
2006
4,161
1,236
2007
2,871
873
2008
1,256
335
2009
585
178
Culture and Food
Fort Worth has a rich history of cowboy culture with a mix of modern urban sophistication. Moreover, it offers diverse food options including Tex-Mex and barbecue. Gilbert, on the other hand, offers an amalgamation of cultures with a vibrant food scene, including numerous farm-to-table restaurants.
Sports Teams
Sports fans in Fort Worth can enjoy games from teams like the Dallas Cowboys, Texas Rangers, and Dallas Mavericks. Gilbert does not have its own professional sports teams, but nearby Phoenix hosts teams like the Phoenix Suns and Arizona Diamondbacks.


 Fort Worth, TX
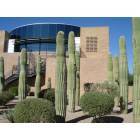
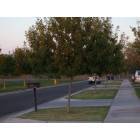
 Gilbert, AZ