Fort Worth, TX and Lincoln, NE are diverse and vibrant cities that offer different sets of attractions, opportunities, and conditions. Whether you're intending to visit as a tourist, or considering relocating, you'll find both cities have a unique blend of character, charm, and convenience. In terms of crime, weather, cost of living, education, economy, infrastructure, employment, real estate, neighborhoods, and transportation, the cities are quite different, but each has its own charm. Let's take a deep dive into each category.
Distance between
Fort Worth, TX and
Lincoln, NE : 558.8 miles
Fort Worth's population is larger by 220%. Its population has grown by 400,814 people (75.0%) since 2000. The population of Lincoln has grown by 67,076 people (29.7%) during that time.
Fort Worth, TX is generally safe, but has a crime rate that is slightly higher than the national average. Neighborhoods are generally safe with pockets of high crime areas, and police and wellness programs are in place to address these issues. On the other hand, Lincoln, NE has a lower crime rate and violent crimes are relatively rare. Both cities have community-oriented policing programs and a strong commitment to safety.
City-data.com crime index counts serious crimes and violent crime more heavily. It adjusts for the number of visitors and daily workers commuting into cities. (higher means more crime, U.S. average = 301.1)
City-data.com crime index counts serious crimes and violent crime more heavily. It adjusts for the number of visitors and daily workers commuting into cities. (higher means more crime, U.S. average = 301.1)
Sex Offenders
According to our data, there are 3,166 registered sex offenders living in Fort Worth and 881 registered sex offenders living in . The ratio of residents to sex offenders in Fort Worth is 270 to 1; the ratio in Lincoln is 318 to 1. The number of registered sex offenders compared to the number of residents in Fort Worth is near to than in Lincoln.
Cost of Living
Living in Fort Worth tends to be more expensive than living in Lincoln, particularly in terms of housing and some services. However, the average salary in Fort Worth tends to be higher, somewhat offsetting this higher cost of living. Lincoln's cost of living is quite affordable, making it popular among families and young professionals.
Income Tax
Fort Worth residents enjoy no state income tax in Texas. Lincoln residents, however, are subject to state income tax in Nebraska.
Property Tax
Property tax rates are higher in Texas compared to Nebraska, making Lincoln more affordable for homeowners.
Sales Tax
Texas does not have a state income tax but does have a relatively high sales tax. Nebraska has both a state income tax and a state sales tax, both of which are moderate compared to other states.
Income
Type
Fort Worth
Lincoln
Estimated median household income
$68,235
$62,294
Estimated per capita income
$34,106
$34,008
Cost of living index (U.S. average is 100)
95.4
84.5
If you make $50,000 in Lincoln, you will have to make $56,450 in Fort Worth to maintain the same standard of living.
Geographical Conditions
Fort Worth, situated in North Texas, features flat prairies and rivers, while Lincoln is part of the Great Plains and features a blend of flat landscapes and rolling hills.
Both cities offer a solid education system. Fort Worth's school district is one of the largest in Texas and provides a variety of educational opportunities. Lincoln is home to the University of Nebraska and recognized for its high-quality public school system, making it excellent for families and students.
Fort Worth's economy is diverse with a strong presence in the healthcare, education, and aeronautics industries. Lincoln also boasts a diverse economy with a focus on services, manufacturing, and education. Both cities have lower-than-average unemployment rates.
Biggest Employers
American Airlines Group and Lockheed Martin Aeronautics are major employers in Fort Worth, while the State of Nebraska, University of Nebraska, and Bryan Health are significant employers in Lincoln.
There were 7,236 building permits issued in Fort Worth in 2012 (4810 more than in 2011) compared to 1,093 building permits issued in Lincoln in 2012 (549 more than in 2011).
In Fort Worth (Tarrant County), 41.4% voted for Democrats and 57.1% for Republicans in 2012 Presidential Election. In Lincoln (Lancaster County), 48.7% voted for Democrats and 49.0% for Republicans.
Elections
Type
Democrats
Republicans
Other
Year
Fort Worth
Lincoln
Fort Worth
Lincoln
Fort Worth
Lincoln
2020
49.3%
52.3%
49.1%
44.6%
1.6%
3.1%
2016
43.2%
45.4%
51.8%
45.2%
5.0%
9.4%
2012
41.4%
48.7%
57.1%
49.0%
1.4%
2.3%
2008
43.8%
51.6%
55.5%
46.6%
0.7%
1.9%
2004
37.0%
42.6%
62.5%
56.3%
0.5%
1.1%
2000
36.9%
41.7%
60.9%
51.9%
2.3%
6.4%
1996
41.6%
44.4%
50.9%
45.9%
7.5%
9.8%
Breakdown of population affiliated with a religious congregation
Type
Adherents
Congregations
Religion
Fort Worth
Lincoln
Fort Worth
Lincoln
SOUTHERN BAPTIST CONVENTION
17.3%
0.7%
33.3%
3.0%
CATHOLIC CHURCH
11.1%
14.9%
1.9%
6.8%
MUSLIM ESTIMATE
2.2%
0.2%
0.9%
0.8%
LUTHERAN CHURCH
0.5%
4.6%
0.9%
5.9%
SEVENTH DAY ADVENTIST CHURCH
0.4%
1.4%
1.6%
3.4%
EPISCOPAL CHURCH
0.3%
0.4%
0.8%
1.7%
EVANGELICAL LUTHERAN CHURCH IN AMERICA
0.3%
5.0%
0.9%
6.4%
SALVATION ARMY
0.0%
0.4%
0.2%
0.4%
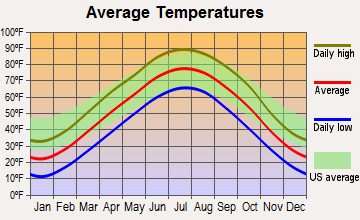
Weather
Fort Worth experiences a hot, humid subtropical climate with mild winters and hot summers. It’s a great place for those who enjoy the warm outdoors. Lincoln, however, experiences a humid continental climate, with freezing winters and warm summers. For those who enjoy experiencing all four seasons, Lincoln could be a more appealing option.
Weather and climate
Type
Fort Worth
Lincoln
Temperature - Average
65°F
51.1°F
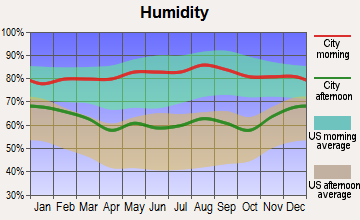
Humidity - Average morning or afternoon humidity
71.4%
75.2%
Humidity - Differences between morning and afternoon humidity
34.1%
35%
Humidity - Maximum monthly morning or afternoon humidity
82.1%
87%
Humidity - Minimum monthly morning or afternoon humidity
48%
52%
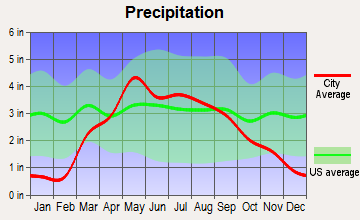
Precipitation - Yearly average
35 in
29.1 in
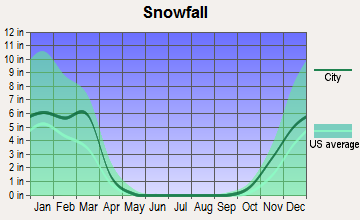
Snowfall - Yearly average
4.2 in
53 in
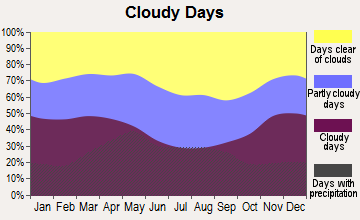
Clouds - Number of days clear of clouds
22.8%
19.6%
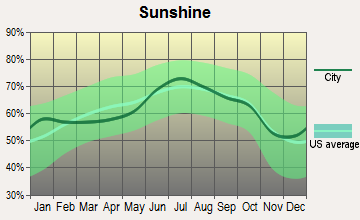
Sunshine amount - Average
66.6%
65.4%
Sunshine amount - Differences during a year
20%
23%
Sunshine amount - Maximum monthly
74%
73%
Sunshine amount - Minimum monthly
54%
50%
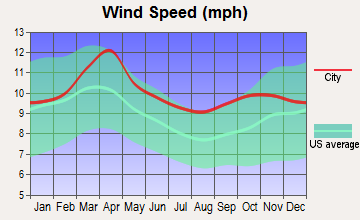
Wind speed - Average
10.3 mph
10.6 mph
Average climate in Fort Worth, Texas
Average climate in Lincoln, Nebraska
Air pollution
Type
AQI
CO
NO2
OZONE
PM25
SO2
Year
Fort Worth
Lincoln
Fort Worth
Lincoln
Fort Worth
Fort Worth
Lincoln
Fort Worth
Fort Worth
2018
67
46
N/A
N/A
5.8
N/A
27.1
28.8
N/A
N/A
N/A
N/A
2017
67
47
N/A
N/A
6.2
N/A
27.2
27.6
N/A
N/A
N/A
N/A
2016
56
48
N/A
N/A
6.3
N/A
25.5
30.4
N/A
N/A
N/A
N/A
2015
61
54
N/A
N/A
6.5
N/A
24.8
31.3
N/A
N/A
N/A
N/A
2014
56
54
0.22
N/A
6.8
N/A
26.6
29.1
N/A
N/A
N/A
N/A
2013
64
46
0.25
N/A
6.4
N/A
26.5
29.1
N/A
N/A
N/A
N/A
2012
87
41
0.26
N/A
7.8
N/A
30.3
32.7
N/A
N/A
N/A
N/A
2011
79
30
0.23
0.32
7.9
N/A
30.7
26.3
N/A
N/A
N/A
N/A
2010
70
31
0.23
0.39
8.5
N/A
27.7
25.0
N/A
N/A
N/A
N/A
2009
81
58
0.25
0.42
8.7
N/A
29.5
23.4
N/A
N/A
N/A
N/A
2008
69
31
0.25
0.40
9.6
N/A
25.8
25.4
N/A
N/A
N/A
N/A
2007
75
35
0.30
0.47
10.6
N/A
24.6
27.8
N/A
N/A
N/A
N/A
2006
90
38
0.34
0.55
10.2
N/A
29.7
26.7
N/A
N/A
N/A
N/A
2005
102
40
0.34
0.62
10.9
N/A
28.4
28.2
11.3
N/A
0.9
N/A
2004
78
37
0.39
0.68
10.6
N/A
25.4
27.1
N/A
N/A
N/A
N/A
2003
82
43
0.40
0.63
11.1
N/A
27.2
29.2
N/A
N/A
N/A
N/A
2002
94
39
0.37
0.62
11.8
N/A
25.8
27.3
N/A
N/A
N/A
N/A
2001
16
41
0.48
0.73
N/A
N/A
N/A
26.5
N/A
N/A
N/A
N/A
2000
17
40
0.55
0.71
N/A
N/A
N/A
27.8
N/A
N/A
N/A
N/A
Natural disasters
Type
Fort Worth
Lincoln
Tornado activity compared to U.S. average
249.6%
199.3%
Earthquake activity compared to U.S. average
562.8%
471.2%
Natural disasters compared to U.S. average
23%
12%
Transportation
Fort Worth has a substantial public transportation system, but many residents choose to drive due to the city’s spread-out nature. Lincoln has a robust but smaller public transit system. Both cities are doing well in maintaining and improving their road networks.
Transport
Type
Fort Worth
Lincoln
Amtrak stations
1
1
Amtrak stations nearby
1
1
FAA registered aircraft
2
240
FAA registered aircraft manufacturers and dealers
19
3
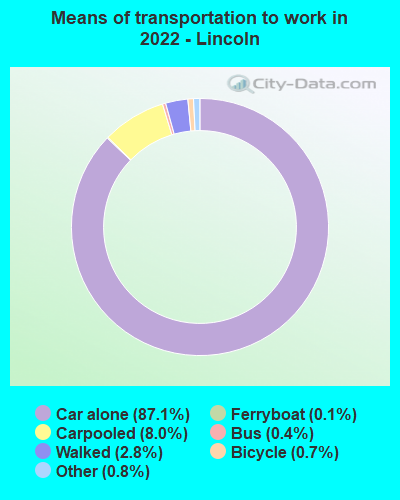
Means of transportation to work
Type
Fort Worth
Lincoln
Bicycle
0.1%
0.8%
Bus
0.4%
1.1%
Carpooled
11%
10.2%
Car alone
85.8%
83.4%
Motorcycle
0.1%
0.1%
Walked
1.3%
3.4%
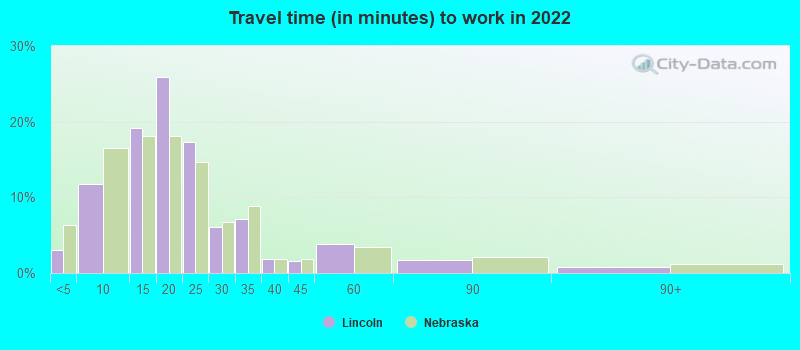
Average travel time to work
Type
Fort Worth
Lincoln
Average
28.5 min
21.5 min
Other means
25.3 min
18.8 min
Public transportation
41.8 min
28.9 min
Private vehicle occupancy
Type
Fort Worth
Lincoln
Average
1.2
1.1
Drove alone
87.6%
88.3%
In 2 person carpool
8.5%
10%
In 3 person carpool
2.5%
1.1%
In 4 person carpool
1.1%
0.3%
In 5-6 person carpool
0.3%
0.3%
How many people usually rode to work in the car, truck or van.
Real Estate
Real estate in Fort Worth can be pricey, especially near the downtown core, but cheaper housing options exist farther from the city center. Lincoln's real-estate is significantly more affordable, offering excellent options for families and first-time homebuyers.
Neighborhoods
Both cities boast diverse neighborhoods. Fort Worth is home to Sundance Square, a vibrant entertainment district, and peaceful suburbs like Benbrook. Lincoln is known for its active downtown and quiet, family-friendly neighborhoods like Fallbrook.
Houses and residents
Type
Fort Worth
Lincoln
Houses
361,341
126,262
Average household size (people)
2.8
2.4
Median year apartment built
1991
1983
Median year house/condo built
1995
1979
Length of stay in the house since moving in
11.2 years
12.1 years
Houses occupied
334,286 (92.5%)
120,407 (95.4%)
Houses occupied by owners
185,197 (55.4%)
70,003 (58.1%)
Houses occupied by renters
149,089 (44.6%)
50,404 (41.9%)
Median rent asked for vacant for-rent units
$1,068
$849.83
Median monthly housing costs
$1,328
$1,000
Median price asked for vacant for-sale houses and condos
$288,576
$413,349
Estimated median house or condo value
$249,000
$228,000
Median numbers of rooms
5.3
5.7
Median number of rooms in apartments
4.2
3.9
Median number of rooms in houses and condos
6.3
7
Median house price - detached houses
$279,885
$244,409
Median house price - in 2-unit structures
Over $1,000,000
$146,009
Median house price - in 3-to-4-unit structures
$337,081
$318,993
Median house price - in 5 or more unit structures
$298,062
$99,016
Median house price - mobile homes
$58,470
$14,649
Median house price - Townhouses or other attached units
$279,957
$282,955
Median house price - All housing units
$279,281
$242,537
Median house age
29
40
Renting percentage
40.8%
41.4%
Housing density (houses/condos per square mile)
1,235.2
1,691.6
House value disparities
31.8%
29.7%
Household income disparities
43.6%
43.1%
Median household income for houses/condes with a mortgage
$106,170
$97,001
Median household income for apartments without a mortgage
$72,147
$72,157
Housing units without a mortgage
2,986 (2.4%)
1,686 (3.6%)
Housing units with both a second mortgage and home equity loan
3,696 (3%)
3,489 (7.5%)
Housing units with a mortgage
121,099 (97.6%)
44,764 (96.4%)
Housing units with a home equity loan
66 (0.1%)
0 (0%)
Housing units with a second mortgage
5,171 (4.2%)
4,382 (9.4%)
House/condo owner moved in on average (years ago)
8
10
House/condo renter moved in on average (years ago)
1
1
Housing units lacking complete kitchen facilities
1.8%
0.8%
Housing units lacking complete plumbing facilities
0.7%
0.3%
Housing units in structures
Housing units in structures
Fort Worth
Lincoln
One, detached
65.4%
58.3%
One, attached
2.9%
8.0%
Two
1.6%
2.3%
3 or 4
4.1%
2.9%
5 to 9
5.8%
5.6%
10 to 19
6.5%
7.4%
20 to 49
4.6%
7.6%
50 or more
7.0%
6.4%
Mobile homes
2.1%
1.5%
Median real estate property taxes paid for housing units
Self-employed workers in own not incorporated business
27,257
9,332
State government workers
8,587
14,738
Unpaid family workers
392
298
Industries and Occupations
Fort Worth hosts a mixed range of industries from education to healthcare, aeronautics, and financial services. Lincoln, on the other hand, is home to a variety of service-based industries, including education and healthcare.
Both cities offer high-quality health care. Fort Worth has numerous hospitals and clinics, and JPS Health Network ranks highly in the region. Bryan Health and CHI Health in Lincoln provide excellent healthcare services for residents.
Health (county statistics)
Type
Fort Worth
Lincoln
General health status score of residents in this county from 1 (poor) to 5 (excellent)
Fort Worth is known for its modern infrastructure but suffers from traffic congestion. Lincoln's infrastructure is efficient for its size, and ongoing enhancements are addressing any congestion issues.
Infrastructure
Type
Fort Worth
Lincoln
Hospitals
76
11
TV stations
25
16
Arenas or stadiums
7
3
Bank branches located here
175
123
Bank institutions located here
42
21
Main business address for public companies
24
8
Drinking water stations with no reported violations in the past
3
6
Drinking water stations with reported violations in the past
HMDA - Conventional home purchase loans - Applications denied
Year
Fort Worth
Lincoln
1999
3,575
563
2000
2,473
394
2001
2,109
262
2002
1,701
246
2003
2,183
334
2004
3,202
357
2005
4,261
416
2006
4,161
374
2007
2,871
223
2008
1,256
149
2009
585
97
Culture and Food
Foodies will enjoy the blend of Mexican and southern cuisine in Fort Worth, while Lincoln offers an exciting mix of traditional Midwestern dishes. Both cities showcase vibrant art scenes and cultural attractions that appeal to locals and visitors alike.
Sports Teams
In terms of sports, Fort Worth residents show great pride in their Dallas Cowboys, while Lincoln residents rally behind the University of Nebraska Cornhuskers football team.


 Fort Worth, TX
 Lincoln, NE