Fort Worth, Texas, and North Coast, California, offer vastly different living experiences shaped by unique regional characteristics. Fort Worth boasts a lower cost of living, a robust economy and a distinct Texan culture while North Coast is an eco-conscious paradise with a mild climate, breathtaking natural beauty, and a high-quality education system. This comparison digs deeper into the specifics of each area - covering crime rates, cost of living, education, work opportunities, and several other sections to paint a comprehensive picture.
In terms of crime and safety, Fort Worth has a higher crime rate compared to North Coast. While neither location is exempt from crime, Fort Worth struggles with a greater amount of both property and violent crimes. However, strategic neighborhood selection in either region can mitigate such risks. North Coast has lower crime rates overall, making it safer on average.
Cost of Living
The cost of living in Fort Worth is dramatically lower than in North Coast. In North Coast, housing, goods, and services are expensive, partly due to its desirability and geographic location. Fort Worth, in comparison, is much more affordable, particularly in terms of housing, making it more cost-effective, especially for families and retirees.
Income Tax
Fort Worth residents benefit from Texas's lack of state income tax. Conversely, North Coast's state, California, has a progressive income tax system with higher rates for greater incomes.
Property Tax
While Texas has higher property taxes, California's property taxes vary significantly based on specific areas within North Coast. So, homeowners in Fort Worth might pay more in property taxes than homeowners in specific Californian counties.
Sales Tax
Sales tax tends to be higher in North Coast, California, given the state's funding needs. Texas, including Fort Worth, does not have a state income tax, which helps reduce the tax burden.
Income
Type
Fort Worth
North Coast
Estimated median household income
$68,235
$102,807
Estimated per capita income
$34,106
$50,809
Cost of living index (U.S. average is 100)
95.4
96.1
If you make $50,000 in Fort Worth, you will have to make $50,367 in North Coast to maintain the same standard of living.
Geographical Conditions
Fort Worth is a relatively flat, urban city while North Coast offers diverse geography including vast forests, rugged coasts, and pristine rivers, making it an outdoor enthusiast’s paradise.
Geographical information
Type
Fort Worth
North Coast
Land area
292.5 sq. miles
59.4 sq. miles
Population density
3,197.9 people per sq. mile
6,335.5 people per sq. mile
Relative area comparison
Fort Worth, TX North Coast, CA
Education
Both North Coast and Fort Worth take education seriously, but their offerings differ. North Coast hosts several high-ranking public and private schools and reputable universities like Humboldt State University. In contrast, Fort Worth has strong school districts with a greater focus on vocational and tech-focused education, including the renowned Texas Christian University.
Fort Worth has a diversified economy with dominance in sectors like defense, technology, logistics, and manufacturing. Conversely, North Coast's economy thrives on tourism, agriculture, wine production, and fishing. Both areas have ample employment opportunities but in different sectors.
Biggest Employers
In Fort Worth, major employers include Lockheed Martin, American Airlines, and the educational and healthcare institutions. Meanwhile, large employers in North Coast include the tourism sector, wineries, Humboldt State University, and healthcare providers.
In Fort Worth (Tarrant County), 41.4% voted for Democrats and 57.1% for Republicans in 2012 Presidential Election. In North Coast (Orange County), 45.8% voted for Democrats and 52.0% for Republicans.
Elections
Type
Democrats
Republicans
Other
Year
Fort Worth
North Coast
Fort Worth
North Coast
Fort Worth
North Coast
2020
49.3%
53.6%
49.1%
44.6%
1.6%
1.8%
2016
43.2%
50.9%
51.8%
42.4%
5.0%
6.7%
2012
41.4%
45.8%
57.1%
52.0%
1.4%
2.3%
2008
43.8%
47.8%
55.5%
50.3%
0.7%
1.9%
2004
37.0%
39.3%
62.5%
60.2%
0.5%
0.5%
2000
36.9%
40.4%
60.9%
55.9%
2.3%
3.7%
1996
41.6%
37.9%
50.9%
51.7%
7.5%
10.5%
Breakdown of population affiliated with a religious congregation
Type
Adherents
Congregations
Religion
Fort Worth
North Coast
Fort Worth
North Coast
SOUTHERN BAPTIST CONVENTION
17.3%
2.3%
33.3%
8.8%
CATHOLIC CHURCH
11.1%
26.5%
1.9%
4.4%
MUSLIM ESTIMATE
2.2%
0.8%
0.9%
1.3%
LUTHERAN CHURCH
0.5%
0.6%
0.9%
2.0%
SEVENTH DAY ADVENTIST CHURCH
0.4%
0.4%
1.6%
1.3%
EPISCOPAL CHURCH
0.3%
0.4%
0.8%
1.4%
EVANGELICAL LUTHERAN CHURCH IN AMERICA
0.3%
0.4%
0.9%
2.3%
Weather
Climate vastly differs in Fort Worth and North Coast. Fort Worth experiences humid subtropical climate with hot summers, mild winters, and receives more rainfall than North Coast. On the other hand, North Coast offers cooler summers, mild wet winters and is well-known for its foggy coastal environment- ideal for those who prefer temperate weather.
Weather and climate
Type
Fort Worth
North Coast
Temperature - Average
65°F
64.4°F
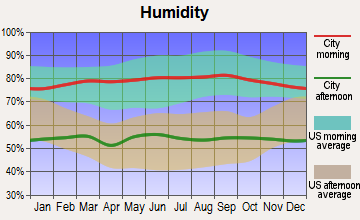
Humidity - Average morning or afternoon humidity
71.4%
70.2%
Humidity - Differences between morning and afternoon humidity
34.1%
26.7%
Humidity - Maximum monthly morning or afternoon humidity
82.1%
78.7%
Humidity - Minimum monthly morning or afternoon humidity
48%
52%
Precipitation - Yearly average
35 in
13 in
Snowfall - Yearly average
4.2 in
0 in
Clouds - Number of days clear of clouds
22.8%
26.5%
Sunshine amount - Average
66.6%
78.4%
Sunshine amount - Differences during a year
20%
21.9%
Sunshine amount - Maximum monthly
74%
84.9%
Sunshine amount - Minimum monthly
54%
62.9%
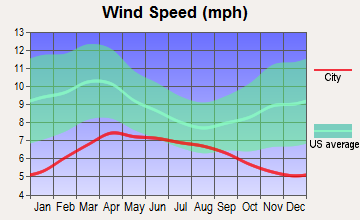
Wind speed - Average
10.3 mph
6 mph
Average climate in Fort Worth, Texas
Average climate in North Coast, California
Air pollution
Type
AQI
CO
NO2
OZONE
PB
PM10
PM25
SO2
Year
Fort Worth
North Coast
Fort Worth
North Coast
Fort Worth
North Coast
Fort Worth
North Coast
North Coast
North Coast
Fort Worth
North Coast
Fort Worth
North Coast
2018
67
119
N/A
0.35
5.8
14.4
27.1
26.1
N/A
N/A
27.5
N/A
N/A
12.6
N/A
0.7
2017
67
116
N/A
0.34
6.2
13.8
27.2
28.8
N/A
N/A
26.7
N/A
N/A
13.8
N/A
0.5
2016
56
102
N/A
0.33
6.3
12.2
25.5
29.3
N/A
N/A
24.1
N/A
N/A
12.5
N/A
0.2
2015
61
106
N/A
0.32
6.5
13.2
24.8
29.8
N/A
N/A
25.0
N/A
N/A
14.5
N/A
0.2
2014
56
110
0.22
0.29
6.8
12.9
26.6
28.6
N/A
N/A
26.7
N/A
N/A
15.5
N/A
0.4
2013
64
107
0.25
0.34
6.4
13.9
26.5
27.8
0.003
N/A
29.5
N/A
N/A
14.2
N/A
0.3
2012
87
103
0.26
0.30
7.8
12.7
30.3
26.8
0.004
N/A
28.2
N/A
N/A
14.3
N/A
0.1
2011
79
109
0.23
0.31
7.9
14.7
30.7
27.0
0.006
N/A
27.7
N/A
N/A
15.9
N/A
0.7
2010
70
102
0.23
0.33
8.5
14.3
27.7
26.2
0.011
N/A
23.6
N/A
N/A
14.0
N/A
0.6
2009
81
118
0.25
0.35
8.7
15.5
29.5
27.6
0.009
N/A
24.3
N/A
N/A
14.5
N/A
1.1
2008
69
124
0.25
0.39
9.6
16.5
25.8
28.2
0.010
N/A
29.5
N/A
N/A
21.6
N/A
1.1
2007
75
100
0.30
0.36
10.6
16.3
24.6
27.0
0.012
N/A
N/A
N/A
N/A
N/A
N/A
0.8
2006
90
114
0.34
0.40
10.2
17.2
29.7
26.4
0.007
N/A
N/A
N/A
N/A
N/A
N/A
1.3
2005
102
95
0.34
0.39
10.9
17.7
28.4
27.9
0.012
N/A
N/A
N/A
11.3
N/A
0.9
1.3
2004
78
119
0.39
0.50
10.6
19.2
25.4
30.5
0.014
N/A
N/A
N/A
N/A
N/A
N/A
1.6
2003
82
122
0.40
0.64
11.1
21.9
27.2
28.9
0.030
N/A
N/A
N/A
N/A
N/A
N/A
1.1
2002
94
106
0.37
0.65
11.8
22.0
25.8
25.5
0.018
N/A
N/A
N/A
N/A
N/A
N/A
1.8
2001
16
116
0.48
0.73
N/A
22.0
N/A
25.4
0.033
N/A
N/A
N/A
N/A
N/A
N/A
1.5
2000
17
125
0.55
0.80
N/A
24.4
N/A
24.0
0.027
N/A
N/A
N/A
N/A
N/A
N/A
1.9
Natural disasters
Type
Fort Worth
North Coast
Tornado activity compared to U.S. average
249.6%
18.6%
Earthquake activity compared to U.S. average
562.8%
6,843.6%
Natural disasters compared to U.S. average
23%
32%
Transportation
Fort Worth has efficient public transit systems like buses and trains, making commuting easier. North Coast is more rural and relies primarily on driving. However, for the eco-conscious, bicycling is quite common.
Transport
Type
Fort Worth
North Coast
Amtrak stations
1
0
Amtrak stations nearby
1
3
FAA registered aircraft
2
0
FAA registered aircraft manufacturers and dealers
19
0
Means of transportation to work
Type
Fort Worth
North Coast
Bicycle
0.1%
0.7%
Bus
0.4%
1.2%
Carpooled
11%
10.7%
Car alone
85.8%
81.4%
Motorcycle
0.1%
0.2%
Walked
1.3%
1.4%
Average travel time to work
Type
Fort Worth
North Coast
Average
28.5 min
28.8 min
Real Estate
Real estate in Fort Worth is generally more affordable with a vast spectrum of housing options. In contrast, North Coast real estate is pricey due to its charismatic rural charm and proximity to nature.
Neighborhoods
Fort Worth neighborhoods range from urban lofts in downtown to suburban areas perfect for family life. North Coast offers small, eclectic communities nestled amidst redwoods and coastal regions, providing more privacy and access to nature.
Houses and residents
Type
Fort Worth
North Coast
Houses
361,341
137,450
Average household size (people)
2.8
2.7
Houses occupied
334,286 (92.5%)
133,254 (96.9%)
Houses occupied by owners
185,197 (55.4%)
84,546 (63.4%)
Houses occupied by renters
149,089 (44.6%)
48,708 (36.6%)
Median rent asked for vacant for-rent units
$1,068
$2,340
Median price asked for vacant for-sale houses and condos
$288,576
$1,099,558
Estimated median house or condo value
$249,000
$883,291
Median number of rooms in apartments
4.2
3.9
Median number of rooms in houses and condos
6.3
6.1
Renting percentage
40.8%
37.7%
Housing density (houses/condos per square mile)
1,235.2
2,312.7
Household income disparities
43.6%
41.2%
Housing units without a mortgage
2,986 (2.4%)
13,396 (19.5%)
Housing units with both a second mortgage and home equity loan
3,696 (3%)
282 (0.4%)
Housing units with a mortgage
121,099 (97.6%)
55,188 (80.5%)
Housing units with a home equity loan
66 (0.1%)
6,297 (9.2%)
Housing units with a second mortgage
5,171 (4.2%)
7,643 (11.1%)
Housing units lacking complete kitchen facilities
1.8%
1%
Housing units lacking complete plumbing facilities
Self-employed workers in own not incorporated business
27,257
15,532
State government workers
8,587
5,751
Unpaid family workers
392
744
Industries and Occupations
Fort Worth offers jobs primarily in aerospace, healthcare, and education, with companies like Lockheed Martin and American Airlines. In North Coast, the wine industry, sustainable agriculture, tourism, and fishing are significant employers.
Both Fort Worth and North Coast have excellent healthcare facilities. Fort Worth supports a more significant number of hospitals, including specialty ones. North Coast, although it has fewer hospitals, offers a high standard of care.
Health (county statistics)
Type
Fort Worth
North Coast
General health status score of residents in this county from 1 (poor) to 5 (excellent)
Infrastructure in Fort Worth includes excellent road systems, many airports, and an expanding public transportation system. North Coast, being more rural, has fewer transport options but offers a robust water supply system and an exceptional commitment to green energy.
Infrastructure
Type
Fort Worth
North Coast
TV stations
25
2
Culture and Food
Fort Worth boasts a rich western heritage, vibrant arts scene, and Tex-Mex and BBQ culinary traditions. North Coast has a diverse cultural landscape with emphasis on environmental and outdoor pursuits, alongside a culinary focus on locally-sourced, sustainable dining.
Sports Teams
For sports enthusiasts, Fort Worth offers professional football, baseball, and soccer teams. North Coast, with its focus on outdoor activities, provides opportunities for water sports, hiking, and biking.
 Fort Worth, TX
 North Coast, CA