Fort Worth, Texas, and Scottsdale, Arizona, are two distinct cities, each with its unique vibe and offerings. Fort Worth brims with Southern charm and a rich cowboy history, while Scottsdale is known for its upscale living, top-notch golf courses, and desert landscapes. The two cities offer different climatic conditions, cost of living, infrastructure, and amenities. These factors contribute to the distinct lifestyles, but also provide a variety of options for relocation, tourism, and business opportunities.
Distance between
Fort Worth, TX and
Scottsdale, AZ : 843.6 miles
Fort Worth's population is larger by 285%. Its population has grown by 400,814 people (75.0%) since 2000. The population of Scottsdale has grown by 40,048 people (19.8%) during that time.
Fort Worth has a higher crime rate compared to the national average. For the most part, violent crime tends to concentrate in certain areas, while suburban areas are generally safer. Contributing to these statistics include property crimes such as burglary, theft, and motor vehicle theft. On the other hand, Scottsdale has a lower crime rate compared to the national average. It's regarded as one of the safest cities in Arizona, displaying lower rates of both violent and property crime. Public safety is a significant consideration, whether you're planning to relocate or just visiting.
City-data.com crime index counts serious crimes and violent crime more heavily. It adjusts for the number of visitors and daily workers commuting into cities. (higher means more crime, U.S. average = 301.1)
City-data.com crime index counts serious crimes and violent crime more heavily. It adjusts for the number of visitors and daily workers commuting into cities. (higher means more crime, U.S. average = 301.1)
Sex Offenders
According to our data, there are 3,166 registered sex offenders living in Fort Worth and 59 registered sex offenders living in . The ratio of residents to sex offenders in Fort Worth is 270 to 1; the ratio in Scottsdale is 4,180 to 1. The number of registered sex offenders compared to the number of residents is much larger in Fort Worth than that in Scottsdale.
Cost of Living
The cost of living in Fort Worth is lower than that of Scottsdale. Housing, grocery, and health expenses are primarily less in Fort Worth. Scottsdale, on the other hand, is known for its higher living standards, which is reflected in its cost of living. Housing is a significant factor that drives the difference in cost.
Income Tax
Texas, including Fort Worth, does not levy a state income tax. In contrast, Arizona state income tax ranges from 2.59% - 4.54%, which applies to Scottsdale.
Property Tax
The property tax rate in Fort Worth is approximately 2.18%. In Scottsdale, the property tax rate is considerably lower at around 0.81%.
Sales Tax
Texas does not have a state income tax, and Fort Worth's combined sales tax rate is 8.25%. Arizona has a state income tax, and Scottsdale has a combined sales tax rate of 7.75%.
Income
Type
Fort Worth
Scottsdale
Estimated median household income
$68,235
$99,097
Estimated per capita income
$34,106
$74,952
Cost of living index (U.S. average is 100)
95.4
105
If you make $50,000 in Fort Worth, you will have to make $55,031 in Scottsdale to maintain the same standard of living.
Geographical Conditions
Fort Worth is located in the North Central part of Texas and offers a mix of prairies, forests, and lakes. Scottsdale is nested in the Sonoran Desert surrounded by mountains and characterized by its desert landscape.
Both cities have excellent educational facilities. Fort Worth is home to multiple high-ranking public and private schools. The city also hosts universities like Texas Christian University and Texas Wesleyan University. In Scottsdale, schools offer high-quality education, whereas colleges and universities around include the Scottsdale Community College, and proximity to the University of Arizona and Arizona State University.
Fort Worth's economy is highly diversified ranging from oil and gas, aerospace, healthcare, and logistics. The city also has a robust tourist industry due to its rich history and vibrant arts scene. Scottsdale has a bustling economy, with its main economic activities including retail trade, healthcare, and professional, scientific, and technical services. Tourism, particularly golf tourism, is also a significant contributor to the city's economy.
Biggest Employers
The biggest employers in Fort Worth include Lockheed Martin Aeronautics, American Airlines, and Bell Helicopter. Scottsdale's largest employers include HonorHealth, CVS Health, and the Vanguard Group.
There were 7,236 building permits issued in Fort Worth in 2012 (4810 more than in 2011) compared to 553 building permits issued in Scottsdale in 2012 (405 more than in 2011).
In Fort Worth (Tarrant County), 41.4% voted for Democrats and 57.1% for Republicans in 2012 Presidential Election. In Scottsdale (Maricopa County), 43.6% voted for Democrats and 54.3% for Republicans.
Elections
Type
Democrats
Republicans
Other
Year
Fort Worth
Scottsdale
Fort Worth
Scottsdale
Fort Worth
Scottsdale
2020
49.3%
50.2%
49.1%
48.0%
1.6%
1.8%
2016
43.2%
44.9%
51.8%
47.7%
5.0%
7.5%
2012
41.4%
43.6%
57.1%
54.3%
1.4%
2.1%
2008
43.8%
44.0%
55.5%
54.5%
0.7%
1.5%
2004
37.0%
42.4%
62.5%
57.0%
0.5%
0.6%
2000
36.9%
43.0%
60.9%
53.4%
2.3%
3.6%
1996
41.6%
44.5%
50.9%
47.2%
7.5%
8.2%
Breakdown of population affiliated with a religious congregation
Type
Adherents
Congregations
Religion
Fort Worth
Scottsdale
Fort Worth
Scottsdale
SOUTHERN BAPTIST CONVENTION
17.3%
1.9%
33.3%
6.5%
CATHOLIC CHURCH
11.1%
13.6%
1.9%
4.3%
MUSLIM ESTIMATE
2.2%
0.2%
0.9%
1.0%
LUTHERAN CHURCH
0.5%
0.5%
0.9%
1.5%
SEVENTH DAY ADVENTIST CHURCH
0.4%
0.4%
1.6%
2.0%
EPISCOPAL CHURCH
0.3%
0.3%
0.8%
1.3%
EVANGELICAL LUTHERAN CHURCH IN AMERICA
0.3%
0.8%
0.9%
2.0%
VINEYARD USA
0.0%
0.3%
0.2%
0.6%
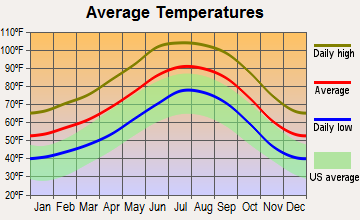
Weather
In Fort Worth, the climate is categorized as humid subtropical with hot, humid summers and cool winters. The city experiences an average rainfall, while snowfall is infrequent. Conversely, Scottsdale enjoys a desert climate, which means hot summers and mild winters. Rainfall here is significantly lower compared to the national average, and snow is practically non-existent.
Weather and climate
Type
Fort Worth
Scottsdale
Temperature - Average
65°F
71.6°F
Humidity - Average morning or afternoon humidity
71.4%
37.5%
Humidity - Differences between morning and afternoon humidity
34.1%
48%
Humidity - Maximum monthly morning or afternoon humidity
82.1%
60%
Humidity - Minimum monthly morning or afternoon humidity
48%
12%
Precipitation - Yearly average
35 in
9.9 in
Snowfall - Yearly average
4.2 in
0 in
Clouds - Number of days clear of clouds
22.8%
35.3%
Sunshine amount - Average
66.6%
92.8%
Sunshine amount - Differences during a year
20%
16%
Sunshine amount - Maximum monthly
74%
95%
Sunshine amount - Minimum monthly
54%
79%
Wind speed - Average
10.3 mph
6.6 mph
Average climate in Fort Worth, Texas
Average climate in Scottsdale, Arizona
Air pollution
Type
AQI
CO
NO2
OZONE
PM10
PM25
SO2
Year
Fort Worth
Scottsdale
Fort Worth
Scottsdale
Fort Worth
Scottsdale
Fort Worth
Scottsdale
Scottsdale
Fort Worth
Scottsdale
Fort Worth
Scottsdale
2018
67
150
N/A
0.35
5.8
15.0
27.1
31.7
35.6
N/A
N/A
7.8
N/A
0.6
2017
67
116
N/A
0.37
6.2
15.7
27.2
31.9
33.1
N/A
N/A
7.4
N/A
1.4
2016
56
106
N/A
0.35
6.3
15.4
25.5
31.2
32.1
N/A
N/A
7.1
N/A
0.4
2015
61
101
N/A
0.35
6.5
17.2
24.8
29.7
27.1
N/A
N/A
7.3
N/A
0.9
2014
56
116
0.22
0.39
6.8
19.2
26.6
29.8
35.1
N/A
N/A
8.3
N/A
1.1
2013
64
127
0.25
0.35
6.4
19.5
26.5
31.2
32.0
N/A
N/A
7.8
N/A
0.9
2012
87
157
0.26
0.37
7.8
20.8
30.3
31.2
36.9
N/A
N/A
8.8
N/A
1.3
2011
79
204
0.23
0.38
7.9
17.2
30.7
31.3
38.7
N/A
N/A
9.5
N/A
0.9
2010
70
100
0.23
0.38
8.5
13.7
27.7
30.8
28.6
N/A
N/A
8.3
N/A
1.3
2009
81
109
0.25
0.40
8.7
13.9
29.5
30.3
36.5
N/A
N/A
N/A
N/A
0.8
2008
69
106
0.25
0.36
9.6
14.5
25.8
30.6
38.3
N/A
N/A
N/A
N/A
0.8
2007
75
134
0.30
0.42
10.6
16.1
24.6
28.3
46.5
N/A
N/A
N/A
N/A
1.7
2006
90
138
0.34
0.46
10.2
19.3
29.7
29.1
49.6
N/A
N/A
N/A
N/A
1.7
2005
102
109
0.34
0.61
10.9
19.7
28.4
26.6
42.0
N/A
11.3
N/A
0.9
1.5
2004
78
98
0.39
0.62
10.6
19.5
25.4
24.3
32.9
N/A
N/A
N/A
N/A
1.4
2003
82
101
0.40
0.65
11.1
22.1
27.2
25.2
42.6
N/A
N/A
N/A
N/A
1.4
2002
94
111
0.37
0.73
11.8
23.4
25.8
23.4
41.8
N/A
N/A
N/A
N/A
1.6
2001
16
106
0.48
0.73
N/A
21.4
N/A
23.5
37.8
N/A
N/A
N/A
N/A
1.5
2000
17
117
0.55
0.82
N/A
30.2
N/A
26.1
45.6
N/A
N/A
N/A
N/A
1.7
Natural disasters
Type
Fort Worth
Scottsdale
Tornado activity compared to U.S. average
249.6%
18%
Earthquake activity compared to U.S. average
562.8%
2,492.5%
Natural disasters compared to U.S. average
23%
16%
Transportation
Fort Worth provides various methods of public transportation including buses, trains, and bikes, while also being car-friendly for residents who prefer driving. Scottsdale has public buses and trolleys and is primarily car-dependent with a well-maintained road network.
Transport
Type
Fort Worth
Scottsdale
Amtrak stations
1
0
Amtrak stations nearby
1
3
FAA registered aircraft
2
726
FAA registered aircraft manufacturers and dealers
19
44
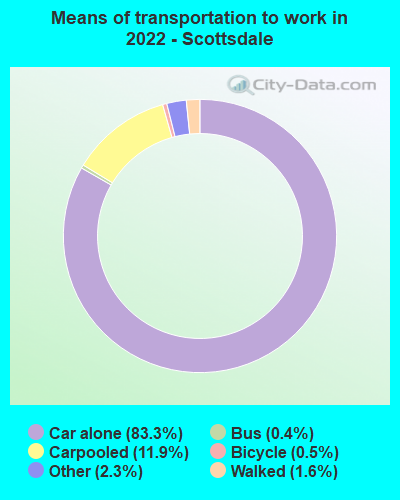
Means of transportation to work
Type
Fort Worth
Scottsdale
Bicycle
0.1%
0.6%
Bus
0.4%
0.8%
Carpooled
11%
9.8%
Car alone
85.8%
85%
Motorcycle
0.1%
0.3%
Taxicab
0.1%
0.1%
Walked
1.3%
2.1%
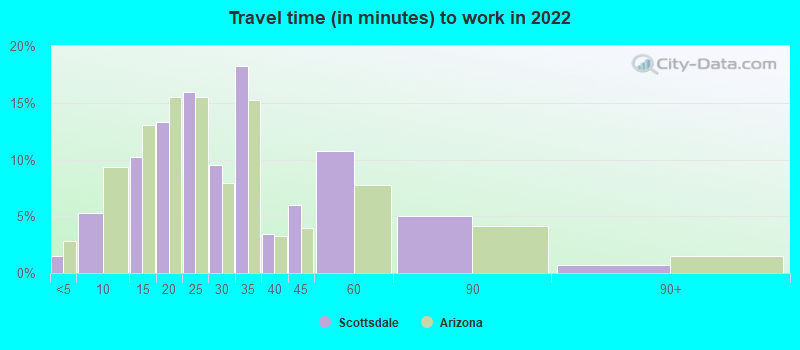
Average travel time to work
Type
Fort Worth
Scottsdale
Average
28.5 min
27.8 min
Other means
25.3 min
24.9 min
Public transportation
41.8 min
39.7 min
Private vehicle occupancy
Type
Fort Worth
Scottsdale
Average
1.2
1.1
Drove alone
87.6%
94%
In 2 person carpool
8.5%
4.9%
In 3 person carpool
2.5%
0.3%
In 4 person carpool
1.1%
0.3%
In 5-6 person carpool
0.3%
0.5%
How many people usually rode to work in the car, truck or van.
Real Estate
Real estate trends in Fort Worth exhibit more affordability, making it a viable option for new homebuyers. Scottsdale, on the contrary, is renowned for its luxury real estate market. The city offers a wealth of high-end homes, residences within golf communities, and desert property.
Neighborhoods
Fort Worth neighborhoods cater to a variety of lifestyles, from the historic and arts-focused Near Southside to the family-friendly suburbs of Keller. In Scottsdale, neighborhoods vary from the family-oriented McDowell Mountain Ranch to the upscale, golf-centered DC Ranch.
Houses and residents
Type
Fort Worth
Scottsdale
Houses
361,341
138,984
Average household size (people)
2.8
2.1
Median year apartment built
1991
1990
Median year house/condo built
1995
1990
Length of stay in the house since moving in
11.2 years
11.5 years
Houses occupied
334,286 (92.5%)
119,122 (85.7%)
Houses occupied by owners
185,197 (55.4%)
80,132 (67.3%)
Houses occupied by renters
149,089 (44.6%)
38,990 (32.7%)
Median rent asked for vacant for-rent units
$1,068
$2,198
Median monthly housing costs
$1,328
$1,623
Median price asked for vacant for-sale houses and condos
$288,576
$300,483
Estimated median house or condo value
$249,000
$674,900
Median numbers of rooms
5.3
5.6
Median number of rooms in apartments
4.2
4
Median number of rooms in houses and condos
6.3
6.5
Median house price - detached houses
$279,885
Over $1,000,000
Median house price - in 2-unit structures
Over $1,000,000
$590,277
Median house price - in 3-to-4-unit structures
$337,081
$378,674
Median house price - in 5 or more unit structures
$298,062
$394,962
Median house price - mobile homes
$58,470
$86,054
Median house price - Townhouses or other attached units
$279,957
$530,134
Median house price - All housing units
$279,281
$872,565
Median house age
29
31
Renting percentage
40.8%
31.9%
Housing density (houses/condos per square mile)
1,235.2
754.5
House value disparities
31.8%
27.3%
Household income disparities
43.6%
41.8%
Median household income for houses/condes with a mortgage
$106,170
$137,177
Median household income for apartments without a mortgage
$72,147
$87,918
Housing units without a mortgage
2,986 (2.4%)
658 (1.3%)
Housing units with both a second mortgage and home equity loan
3,696 (3%)
6,221 (12.5%)
Housing units with a mortgage
121,099 (97.6%)
49,289 (98.7%)
Housing units with a home equity loan
66 (0.1%)
188 (0.4%)
Housing units with a second mortgage
5,171 (4.2%)
7,674 (15.4%)
House/condo owner moved in on average (years ago)
8
8
House/condo renter moved in on average (years ago)
1
1
Housing units lacking complete kitchen facilities
1.8%
1.4%
Housing units lacking complete plumbing facilities
0.7%
0.4%
Housing units in structures
Housing units in structures
Fort Worth
Scottsdale
One, detached
65.4%
53.1%
One, attached
2.9%
13.7%
Two
1.6%
0.6%
3 or 4
4.1%
3.9%
5 to 9
5.8%
5.1%
10 to 19
6.5%
5.6%
20 to 49
4.6%
3.7%
50 or more
7.0%
13.4%
Mobile homes
2.1%
1.0%
Median real estate property taxes paid for housing units
Self-employed workers in own not incorporated business
27,257
8,963
State government workers
8,587
4,079
Unpaid family workers
392
171
Industries and Occupations
The industries and occupations in Fort Worth are broad, including sectors like healthcare, education, transport, and logistics. Scottsdale has a prosperous economy with dominant sectors including healthcare, retail, and finance. The city is also known for its growing tech industry.
Fort Worth boasts excellent healthcare facilities, such as the Baylor Scott & White All Saints Medical Center. Scottsdale is known for its world-class healthcare, hosting the Mayo Clinic's Scottsdale campus, one of the top medical facilities in the country.
Health (county statistics)
Type
Fort Worth
Scottsdale
General health status score of residents in this county from 1 (poor) to 5 (excellent)
Fort Worth's infrastructure caters to a thriving metro with expanding public transportation, networks of freeways, and efficient utilities. The city's Trinity Railway Express provides a vital connection to the Dallas Fort Worth Metroplex. Scottsdale boasts advanced infrastructure with efficient public services, modern healthcare facilities, and a range of public transportation options inclusive of bus routes and trolleys.
Infrastructure
Type
Fort Worth
Scottsdale
Hospitals
76
8
TV stations
25
18
Arenas or stadiums
7
2
Bank branches located here
175
138
Bank institutions located here
42
42
Main business address for public companies
24
18
Drinking water stations with no reported violations in the past
3
3
Drinking water stations with reported violations in the past
HMDA - Conventional home purchase loans - Applications denied
Year
Fort Worth
Scottsdale
1999
3,575
1,109
2000
2,473
730
2001
2,109
530
2002
1,701
532
2003
2,183
1,056
2004
3,202
1,561
2005
4,261
2,094
2006
4,161
2,107
2007
2,871
1,334
2008
1,256
696
2009
585
476
Culture and Food
Fort Worth offers a vibrant cultural scene, with its western heritage, museums, arts venues, and festivals. The city also boasts Tex-Mex cuisine, BBQ, and southern comfort food. Scottsdale, being pretty cosmopolitan, offers a diverse culture, particularly known for its arts scene including galleries, public art, and festivals. The city's cuisine is Southwestern, influenced by Mexican flavors.
Sports Teams
Fort Worth shares major sports teams with the Dallas Fort-Worth metroplex, including Dallas Cowboys (NFL), Texas Rangers (MLB), and Dallas Mavericks (NBA). Scottsdale does not have its sports teams but is close to Phoenix, home to Arizona Cardinals (NFL), Arizona Diamondbacks (MLB), and Phoenix Suns (NBA).


 Fort Worth, TX
 Scottsdale, AZ