Fresno and Anaheim are two dynamic cities in the Californian state with their unique draws and challenges. Fresno, located in California's Central Valley, is known for its agricultural predominance, while Anaheim, situated in Orange County, is renowned for its amusement parks like Disneyland. Both cities offer distinct living experiences, contributing to a rich Californian culture. The following is a comprehensive comparison of these two cities, considering various critical aspects for those considering relocating or simply visiting.
Distance between
Fresno, CA and
Anaheim, CA : 230.0 miles
Fresno's population is larger by 57%. Its population has grown by 116,858 people (27.3%) since 2000. The population of Anaheim has grown by 17,926 people (5.5%) during that time.
Fresno's crime rate is generally higher than national averages, particularly in specific central Fresno neighborhoods, bringing down the overall safety perception. Crime rate is slightly lower in Anaheim but still above national averages. Both cities continuously work on improving safety measures, advising residents to be aware of their surroundings.
City-data.com crime index counts serious crimes and violent crime more heavily. It adjusts for the number of visitors and daily workers commuting into cities. (higher means more crime, U.S. average = 301.1)
City-data.com crime index counts serious crimes and violent crime more heavily. It adjusts for the number of visitors and daily workers commuting into cities. (higher means more crime, U.S. average = 301.1)
Sex Offenders
According to our data, there are 1,478 registered sex offenders living in Fresno and 366 registered sex offenders living in . The ratio of residents to sex offenders in Fresno is 353 to 1; the ratio in Anaheim is 959 to 1. The number of registered sex offenders compared to the number of residents is much larger in Fresno than that in Anaheim.
Cost of Living
The cost of living in Anaheim is relatively higher compared to Fresno, driven mainly by housing costs. While utilities, groceries, health, and transportation costs are somewhat cheaper in Fresno, making it more attractive for people on a tighter budget.
Income Tax
California's income tax rates are progressive and the same across the state, so Fresno and Anaheim residents encounter the same state income tax ranges from 1% to 13.3% based on their income levels.
Property Tax
Both cities have about an average 0.77% property tax rate, although actual amounts can fluctuate based on home values and local county assessments.
Sales Tax
Both Fresno and Anaheim share California's base sales tax rate of 7.25%. However, when combined with local municipality taxes, the total sales tax in Fresno is 7.975%, while Anaheim's is 8.75%.
Income
Type
Fresno
Anaheim
Estimated median household income
$61,250
$81,747
Estimated per capita income
$28,499
$32,827
Cost of living index (U.S. average is 100)
96.3
88.5
If you make $50,000 in Anaheim, you will have to make $54,407 in Fresno to maintain the same standard of living.
Geographical Conditions
Fresno's geographical location in the Central Valley gives it a mix of urban and rural vistas, with nearby national parks for outdoor activities. Anaheim, located in Orange County, offers coastal beauty and access to beautiful Southern California beaches.
Both cities have a strong network of public and private schools up to high school level, and higher education institutions. Fresno is home to Fresno State University, while Anaheim proximity to top-ranking universities like UC Irvine and Cal State Fullerton is a definite plus.
Fresno's economy primarily focuses on agriculture, with a growing emphasis on medical services. On the other hand, Anaheim has a diverse economy with strong sectors in tourism, manufacturing, and technology. Employment opportunities can vary based on your professional background and industry.
Biggest Employers
Fresno's largest employers include Community Medical Centers, Saint Agnes Medical Center, and Fresno Unified School District. In contrast, Anaheim's top employers are Disneyland Resort, Kaiser Permanente, and Northgate Gonzalez Markets.
There were 1,911 building permits issued in Fresno in 2012 (1205 more than in 2011) compared to 85 building permits issued in Anaheim in 2012 (44 more than in 2011).
In Fresno (Fresno County), 49.8% voted for Democrats and 48.0% for Republicans in 2012 Presidential Election. In Anaheim (Orange County), 45.8% voted for Democrats and 52.0% for Republicans.
Elections
Type
Democrats
Republicans
Other
Year
Fresno
Anaheim
Fresno
Anaheim
Fresno
Anaheim
2020
53.0%
53.6%
45.2%
44.6%
1.8%
1.8%
2016
49.2%
50.9%
43.2%
42.4%
7.5%
6.7%
2012
49.8%
45.8%
48.0%
52.0%
2.2%
2.3%
2008
50.2%
47.8%
48.1%
50.3%
1.8%
1.9%
2004
42.0%
39.3%
57.8%
60.2%
0.3%
0.5%
2000
43.2%
40.4%
53.3%
55.9%
3.5%
3.7%
1996
45.3%
37.9%
47.4%
51.7%
7.3%
10.5%
Breakdown of population affiliated with a religious congregation
Type
Adherents
Congregations
Religion
Fresno
Anaheim
Fresno
Anaheim
CATHOLIC CHURCH
31.0%
26.5%
6.1%
4.4%
SOUTHERN BAPTIST CONVENTION
1.6%
2.3%
8.1%
8.8%
SEVENTH DAY ADVENTIST CHURCH
0.7%
0.4%
2.6%
1.3%
AMERICAN BAPTIST CHURCHES IN THE USA
0.6%
0.2%
2.4%
1.7%
EVANGELICAL LUTHERAN CHURCH IN AMERICA
0.5%
0.4%
2.0%
2.3%
MUSLIM ESTIMATE
0.3%
0.8%
0.6%
1.3%
LUTHERAN CHURCH
0.1%
0.6%
0.7%
2.0%
EPISCOPAL CHURCH
0.0%
0.4%
0.1%
1.4%
REFORMED CHURCH IN AMERICA
0.0%
0.3%
0.1%
0.2%
Weather
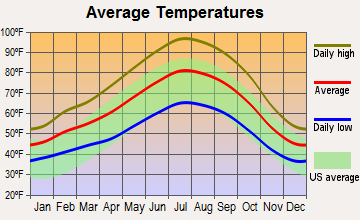
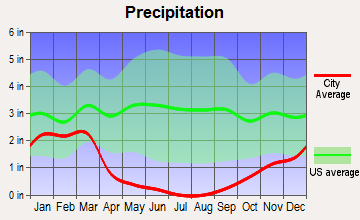
Fresno features a semi-arid climate, with very hot, dry summers and mild winters, which are considerably wetter. Anaheim experiences a warmer Mediterranean climate, with warm, dry summers and mild, wet winters. The weather is more temperate in Anaheim, making it more appealing for tourists and residents alike.
Weather and climate
Type
Fresno
Anaheim
Temperature - Average
63°F
64.9°F
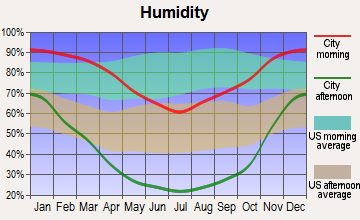
Humidity - Average morning or afternoon humidity
60.9%
69.6%
Humidity - Differences between morning and afternoon humidity
67%
25.9%
Humidity - Maximum monthly morning or afternoon humidity
88%
77.9%
Humidity - Minimum monthly morning or afternoon humidity
21%
52%
Precipitation - Yearly average
11.6 in
12 in
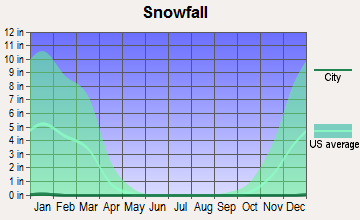
Snowfall - Yearly average
0 in
0 in
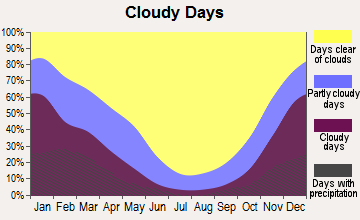
Clouds - Number of days clear of clouds
32.4%
26.6%
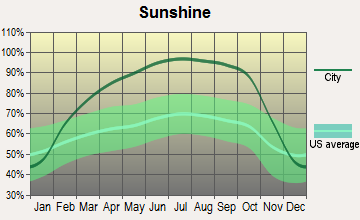
Sunshine amount - Average
82.8%
78.4%
Sunshine amount - Differences during a year
52%
22%
Sunshine amount - Maximum monthly
96%
84.9%
Sunshine amount - Minimum monthly
44%
63%
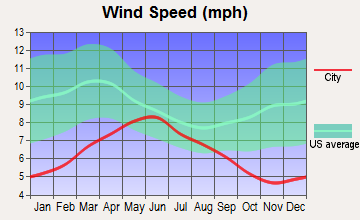
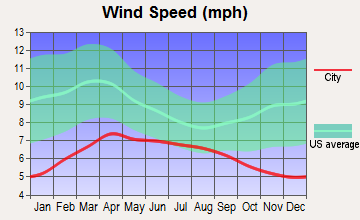
Wind speed - Average
6.5 mph
5.7 mph
Average climate in Fresno, California
Average climate in Anaheim, California
Air pollution
Type
AQI
CO
NO2
OZONE
PB
PM10
PM25
SO2
Year
Fresno
Anaheim
Fresno
Anaheim
Fresno
Anaheim
Fresno
Anaheim
Fresno
Anaheim
Fresno
Anaheim
Fresno
Anaheim
Fresno
Anaheim
2018
128
139
0.35
0.36
9.7
13.7
31.7
26.8
N/A
0.007
39.7
27.5
14.8
12.1
0.6
0.7
2017
132
145
0.35
0.50
9.2
14.8
33.2
26.7
N/A
0.007
38.3
26.7
14.3
13.5
0.6
0.6
2016
128
132
0.35
0.57
8.4
14.5
31.4
26.3
N/A
0.007
34.7
24.1
13.5
12.9
0.5
0.3
2015
134
142
0.32
0.45
8.7
14.7
31.1
26.0
N/A
0.007
34.2
25.0
13.9
14.8
0.5
0.3
2014
139
138
0.33
0.40
10.1
15.0
32.4
26.7
0.004
0.008
39.3
26.7
16.4
16.2
0.5
0.5
2013
136
138
0.37
0.47
11.1
14.8
31.0
25.3
0.005
0.005
43.3
28.3
19.1
13.9
0.6
0.5
2012
140
142
0.36
0.46
9.7
14.5
31.9
25.0
0.004
0.005
36.1
27.0
14.2
14.7
0.6
0.2
2011
139
138
0.34
0.42
8.7
15.9
33.5
26.7
N/A
0.007
30.2
27.4
21.1
16.0
0.8
0.8
2010
121
130
0.27
0.44
6.9
16.7
31.1
25.8
N/A
0.009
N/A
23.5
N/A
14.9
0.7
0.6
2009
107
151
0.31
0.41
7.3
18.0
29.6
26.0
N/A
0.010
N/A
24.4
N/A
15.4
1.6
1.1
2008
130
156
0.33
0.38
9.3
20.3
31.1
26.7
N/A
0.010
N/A
30.2
22.2
18.9
1.0
1.1
2007
146
135
0.34
0.38
10.0
19.5
28.4
26.2
N/A
0.012
N/A
N/A
26.0
N/A
0.7
0.8
2006
104
128
0.36
0.43
11.3
19.1
29.7
26.3
0.006
0.008
N/A
N/A
N/A
N/A
N/A
1.3
2005
101
128
0.33
0.45
10.7
20.7
28.1
31.3
N/A
0.013
N/A
N/A
N/A
N/A
N/A
1.3
2004
103
134
0.34
0.53
11.5
19.9
30.8
37.1
N/A
0.015
N/A
N/A
N/A
N/A
N/A
1.6
2003
115
143
0.44
0.69
15.0
23.7
31.2
23.8
N/A
0.025
N/A
N/A
N/A
N/A
1.2
1.1
2002
139
134
0.43
0.77
15.2
24.1
44.8
21.8
N/A
0.019
N/A
N/A
N/A
N/A
N/A
2.1
2001
143
143
0.42
0.94
15.1
28.4
47.3
24.5
N/A
0.035
N/A
N/A
N/A
N/A
N/A
1.7
2000
136
152
0.51
0.80
15.4
29.4
41.0
23.0
N/A
0.030
N/A
N/A
N/A
N/A
N/A
1.9
Natural disasters
Type
Fresno
Anaheim
Tornado activity compared to U.S. average
9.9%
19.3%
Earthquake activity compared to U.S. average
8,613%
7,039.7%
Natural disasters compared to U.S. average
12%
32%
Transportation
Fresno offers public transportation through buses, with several freeways and highways for commuting. Anaheim has a comprehensive bus and rail system, supported by well-maintained road networks and close proximity to major southern California cities.
Transport
Type
Fresno
Anaheim
Amtrak stations
1
1
Amtrak stations nearby
2
3
FAA registered aircraft
408
136
FAA registered aircraft manufacturers and dealers
36
3
Means of transportation to work
Type
Fresno
Anaheim
Bicycle
0.8%
1%
Bus
1.3%
0.9%
Carpooled
10.7%
10.8%
Car alone
84.4%
83.4%
Motorcycle
0.2%
0.2%
Railroad
0%
0.2%
Subway
0.1%
0.3%
Walked
1.4%
1.6%
Average travel time to work
Type
Fresno
Anaheim
Average
23.7 min
30.8 min
Other means
21.5 min
28.1 min
Public transportation
45.3 min
47.8 min
Private vehicle occupancy
Type
Fresno
Anaheim
Average
1.2
1.2
Drove alone
88.3%
85.3%
In 2 person carpool
8.5%
11.2%
In 3 person carpool
1.8%
1.8%
In 4 person carpool
0.8%
0.8%
In 5-6 person carpool
0.5%
0.9%
In 7+ person carpool
0.1%
0%
How many people usually rode to work in the car, truck or van.
Real Estate
The real estate market in Anaheim is significantly more expensive than in Fresno. However, both cities have seen a rise in property values in recent years, promising a good return on investment.
Neighborhoods
Fresno has a blend of rural and urban neighborhoods, with the Tower District highlighting the city's arts scene. Anaheim is known for its hip downtown with trendy eateries, upscale housing, and a vibrant entertainment scene.
Houses and residents
Type
Fresno
Anaheim
Houses
188,756
110,319
Average household size (people)
3.1
3.4
Median year apartment built
1977
1975
Median year house/condo built
1983
1970
Length of stay in the house since moving in
12.6 years
14.8 years
Houses occupied
181,841 (96.3%)
105,608 (95.7%)
Houses occupied by owners
91,233 (50.2%)
51,684 (48.9%)
Houses occupied by renters
90,608 (49.8%)
53,924 (51.1%)
Median rent asked for vacant for-rent units
$958.34
$2,111
Median monthly housing costs
$1,209
$1,910
Median price asked for vacant for-sale houses and condos
$285,919
$1,256,069
Estimated median house or condo value
$321,300
$688,400
Median numbers of rooms
5
4.7
Median number of rooms in apartments
4
3.6
Median number of rooms in houses and condos
5.9
6.1
Median house price - detached houses
$375,492
$859,592
Median house price - in 2-unit structures
$184,112
$742,035
Median house price - in 3-to-4-unit structures
$196,355
$546,946
Median house price - in 5 or more unit structures
$287,684
$553,561
Median house price - mobile homes
$100,122
$114,904
Median house price - Townhouses or other attached units
$260,277
$619,623
Median house price - All housing units
$358,028
$782,600
Median house age
42
48
Renting percentage
50.9%
51.5%
Housing density (houses/condos per square mile)
1,808.6
2,254.1
House value disparities
29.4%
20.2%
Household income disparities
46.4%
43.6%
Median household income for houses/condes with a mortgage
$97,354
$125,169
Median household income for apartments without a mortgage
$73,445
$86,779
Housing units without a mortgage
1,037 (1.7%)
374 (1%)
Housing units with both a second mortgage and home equity loan
2,880 (4.8%)
2,222 (6%)
Housing units with a mortgage
59,354 (98.3%)
36,875 (99%)
Housing units with a home equity loan
68 (0.1%)
0 (0%)
Housing units with a second mortgage
4,120 (6.8%)
2,794 (7.5%)
House/condo owner moved in on average (years ago)
10
14
House/condo renter moved in on average (years ago)
3
4
Housing units lacking complete kitchen facilities
1.5%
4.5%
Housing units lacking complete plumbing facilities
0.4%
0.1%
Housing units in structures
Housing units in structures
Fresno
Anaheim
One, detached
59.0%
42.7%
One, attached
3.2%
8.3%
Two
3.0%
2.3%
3 or 4
7.8%
7.6%
5 to 9
9.6%
6.8%
10 to 19
3.6%
5.5%
20 to 49
3.4%
6.8%
50 or more
7.5%
17.2%
Mobile homes
2.6%
2.6%
Boats, RVs, vans, etc.
0.1%
0.1%
Median real estate property taxes paid for housing units
Self-employed workers in own not incorporated business
14,428
11,077
State government workers
9,836
5,046
Unpaid family workers
890
65
Industries and Occupations
In Fresno, the major industries include healthcare, agriculture, and education. In contrast, Anaheim hosts diverse industries, including tourism, manufacturing, retail, and technology, offering a broader range of occupation options.
Fresno is home to several acclaimed hospitals and healthcare centers. Similarly, Anaheim has taken strides in healthcare, with top-rated facilities and easy access to renowned healthcare institutes in greater Los Angeles.
Both cities have a solid infrastructure, but Anaheim has an edge due to its well-developed road networks and public amenities, owing to its significant tourist influx.
Infrastructure
Type
Fresno
Anaheim
Hospitals
32
22
TV stations
4
6
Arenas or stadiums
2
2
Bank branches located here
98
46
Bank institutions located here
25
19
Main business address for public companies
1
7
Drinking water stations with no reported violations in the past
5
1
Drinking water stations with reported violations in the past
HMDA - Conventional home purchase loans - Applications denied
Year
Fresno
Anaheim
1999
717
914
2000
484
679
2001
462
632
2002
569
735
2003
1,510
1,047
2004
2,462
1,456
2005
3,394
1,965
2006
3,441
1,999
2007
2,138
1,230
2008
760
599
2009
354
378
Culture and Food
Fresno's culture is a testament to its agricultural heritage, with many cultural festivals, farmers' markets, and farm-to-table eateries. Anaheim has a vibrant cultural scene, thanks to its tourism industry, ensuring a multitude of dining and entertainment options.
Sports Teams
Fresno hosts minor-league baseball and soccer teams, and Fresno State sports are popular. Anaheim is home to the major league teams Anaheim Ducks (NHL) and Los Angeles Angels (MLB), attracting a significant sports fan base.


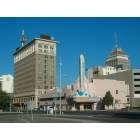

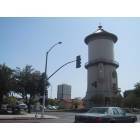


 Fresno, CA
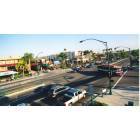
 Anaheim, CA