Houston, TX vs Austin, TX - Advanced U.S. city comparison tool

Houston, TX vs Austin, TX

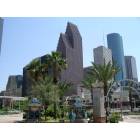
Houston and Austin are two of the most vibrant cities in Texas, each offering its unique blend of culture, economy, and lifestyle. Houston is known for its space, energy, and healthcare sectors, offering a cosmopolitan lifestyle with diverse cuisines and professional sports teams. Austin, on the other hand, flaunts its rich live music scene, tech industry prominence, and laid-back lifestyle. Both cities have their distinct advantages and characteristics.
 
 
Distance between Houston, TX and Austin, TX : 146.2 miles

Houston's population is larger by 137%. Its population has grown by 334,619 people (17.1%) since 2000. The population of Austin has grown by 307,615 people (46.9%) during that time.

Population
Type Houston Austin
Population 2,288,250 964,177
Female / male percentage 50.8% / 49.2%
50.8%
49.2%
49.1% / 50.9%
49.1%
50.9%
Racial makeup - percentage
Ethnicity HoustonAustin
Hispanic 44.0% 32.0%
White Non-Hispanic 24.2% 48.0%
Black 22.0% 7.2%
Asian 7.0% 8.4%
Two or more 2.4% 4.0%
American Indian 0.1% 0.1%
Racial makeup - absolute values
Ethnicity HoustonAustin
Hispanic 1,005,206 308,048
White Non-Hispanic 552,978 462,327
Black 502,346 69,861
Asian 159,087 80,604
Two or more 54,942 38,106
American Indian 2,958 971
Pacific Islander 1,657 214

Crime and Safety

When comparing safety, Austin generally has a lower crime rate than Houston. That said, as in any urban area, certain areas might have higher crime rates than others. Houston tends to have higher property and violent crime rates than Austin, but it's also larger and more densely populated. It's important to research individual neighborhoods for a comprehensive picture of safety.

Crime by year per 100,000 residents
Type City-data.com crime indexRobberies per 100,000Murders per 100,000Rapes per 100,000Assaults per 100,000Burglaries per 100,000Theft per 100,000Auto theft per 100,000Arson per 100,000
Year HoustonAustinHoustonAustinHoustonAustinHoustonAustinHoustonAustinHoustonAustinHoustonAustinHoustonAustinHoustonAustin
2020 560.9 316.8 373.2 110.1 17.0 4.4 48.5 47.8 817.5 304.7 672.9 477.3 2,875.9 2,747.3 630.0 406.6 22.7 13.4
2019 527.1 307.7 389.0 102.6 11.9 3.3 56.6 58.3 620.9 246.5 724.4 440.6 3,046.3 2,969.3 557.3 307.8 21.1 10.4
2018 500.9 304.1 374.8 104.9 11.9 3.3 57.0 80.9 589.0 193.1 685.0 467.4 2,809.3 2,729.6 510.6 260.8 21.8 5.8
2017 523.5 299.1 418.0 101.5 11.5 2.7 58.4 85.8 607.3 224.9 731.7 450.6 2,900.8 2,525.0 495.9 213.9 28.4 7.8
2016 520.7 312.4 426.8 109.5 12.9 4.1 51.8 78.1 534.9 216.2 792.0 548.8 2,982.8 2,738.4 545.7 221.4 28.6 7.7
2015 514.4 296.7 451.7 99.0 13.3 2.5 43.3 51.9 458.3 219.2 872.8 532.6 2,928.7 2,990.0 596.0 248.3 29.5 9.7
2014 528.7 328.0 458.8 96.6 10.9 3.5 36.6 63.2 485.1 232.9 974.3 634.2 3,068.8 3,255.0 650.6 253.1 32.3 10.5
2013 533.6 329.1 453.6 88.8 9.8 3.0 28.3 25.3 471.0 246.4 1,088.4 762.4 3,374.8 3,834.8 623.5 252.5 32.5 12.2
2012 536.4 361.2 431.0 117.4 10.0 3.7 30.5 25.1 521.0 262.6 1,223.1 869.7 3,122.2 4,071.7 600.3 277.9 34.6 14.5
2011 534.2 367.6 375.7 137.0 9.2 3.3 36.0 26.1 553.7 263.4 1,281.0 872.6 3,200.0 4,097.7 572.9 265.0 35.7 15.7
2010 586.7 416.8 450.1 155.7 12.8 4.8 33.9 33.5 574.5 285.4 1,330.1 1,106.9 3,552.5 4,406.3 610.5 284.7 41.2 15.4
2009 596.6 444.4 499.9 184.0 12.6 2.9 36.2 34.5 576.8 302.0 1,287.7 1,138.3 3,389.0 4,818.7 641.9 288.6 42.2 12.5
2008 573.6 435.3 473.6 176.9 13.1 3.1 33.5 36.2 586.5 306.0 1,203.6 1,139.4 3,063.9 4,456.6 679.5 349.4 42.7 11.5
2007 631.1 467.1 529.1 203.3 16.2 4.2 32.0 45.8 555.0 286.8 1,338.7 1,120.4 3,448.5 4,807.5 897.2 413.1 48.3 16.2
2006 659.2 434.4 548.3 191.3 18.2 2.8 41.2 44.9 561.7 276.3 1,295.7 1,052.0 3,524.6 4,446.5 1,017.2 358.4 54.1 12.4
2005 559.2 361.5 544.0 170.6 16.3 3.8 42.6 45.0 569.6 270.3 1,346.3 1,051.2 3,542.8 4,593.7 997.6 367.7 61.7 16.6
2004 553.9 370.8 498.3 205.8 13.3 3.8 44.4 44.3 590.4 271.2 1,326.7 996.6 3,658.1 4,674.1 1,055.2 385.8 61.4 17.0
2003 552.8 360.0 538.2 183.3 13.6 4.0 37.6 33.1 585.8 241.7 1,299.4 1,061.1 3,529.1 4,727.8 1,051.0 406.1 76.1 20.5

City-data.com crime index counts serious crimes and violent crime more heavily. It adjusts for the number of visitors and daily workers commuting into cities. (higher means more crime, U.S. average = 301.1)


Crime per year
Type City-data.com crime indexRobberiesMurdersRapesAssaultsBurglariesTheftAuto theftArson
Year HoustonAustinHoustonAustinHoustonAustinHoustonAustinHoustonAustinHoustonAustinHoustonAustinHoustonAustinHoustonAustin
2019 527.1 307.7 9,164 1,012 280 33 1,334 575 14,625 2,431 17,064 4,345 71,758 29,279 13,127 3,035 497 103
2018 500.9 304.1 8,788 1,021 280 32 1,336 787 13,813 1,880 16,062 4,549 65,877 26,568 11,974 2,538 511 56
2017 523.5 299.1 9,773 987 269 26 1,366 834 14,201 2,186 17,108 4,380 67,828 24,542 11,596 2,079 665 76
2016 520.7 312.4 9,962 1,048 301 39 1,210 747 12,487 2,069 18,488 5,252 69,630 26,204 12,738 2,119 668 74
2015 514.4 296.7 10,278 929 303 23 986 487 10,427 2,058 19,859 5,000 66,634 28,068 13,560 2,331 671 91
2014 528.7 328.0 10,186 873 242 32 812 571 10,768 2,105 21,629 5,733 68,125 29,423 14,443 2,288 716 95
2013 533.6 329.1 9,891 763 214 26 618 217 10,270 2,117 23,733 6,550 73,591 32,948 13,595 2,169 708 105
2012 536.4 361.2 9,385 978 217 31 665 209 11,343 2,187 26,630 7,244 67,978 33,913 13,070 2,315 754 121
2011 534.2 367.6 8,054 1,106 198 27 771 211 11,869 2,126 27,459 7,042 68,596 33,069 12,281 2,139 765 127
2010 586.7 416.8 9,449 1,231 269 38 712 265 12,061 2,256 27,924 8,749 74,582 34,827 12,817 2,250 865 122
2009 596.6 444.4 11,367 1,415 287 22 823 265 13,116 2,322 29,279 8,753 77,058 37,054 14,596 2,219 959 96
2008 573.6 435.3 10,603 1,333 294 23 750 273 13,132 2,306 26,947 8,586 68,598 33,582 15,214 2,633 956 87
2007 631.1 467.1 11,479 1,457 351 30 694 328 12,040 2,056 29,044 8,031 74,817 34,461 19,465 2,961 1,047 116
2006 659.2 434.4 11,371 1,358 377 20 854 319 11,648 1,961 26,869 7,467 73,091 31,562 21,093 2,544 1,121 88
2005 559.2 361.5 11,128 1,182 334 26 872 312 11,653 1,873 27,541 7,285 72,476 31,835 20,408 2,548 1,262 115
2004 553.9 370.8 10,182 1,406 272 26 908 303 12,065 1,853 27,110 6,810 74,752 31,938 21,563 2,636 1,255 116
2003 552.8 360.0 10,985 1,251 278 27 768 226 11,957 1,649 26,522 7,240 72,032 32,259 21,451 2,771 1,553 140

City-data.com crime index counts serious crimes and violent crime more heavily. It adjusts for the number of visitors and daily workers commuting into cities. (higher means more crime, U.S. average = 301.1)

Sex Offenders

According to our data, there are 7,864 registered sex offenders living in Houston and 1,422 registered sex offenders living in .
The ratio of residents to sex offenders in Houston is 293 to 1; the ratio in Austin is 667 to 1.
The number of registered sex offenders compared to the number of residents is larger in Houston than in Austin.

Cost of Living

Houston is usually less expensive than Austin. This is mainly due to the cost of housing, which is generally lower in Houston. Although the cost of goods and services is relatively similar in both cities, the median home price in Austin is noticeably higher.

Income Tax

Texas is one of the seven states in the U.S. that doesn't impose a state income tax. Therefore, residents of both Houston and Austin do not pay city or state income taxes.

Property Tax

Property tax rates do vary between Austin and Houston. Houston typically has higher property tax rates compared to Austin due, in part, to higher local tax levies.

Sales Tax

Austin and Houston both have an 8.25% combined state and local sales tax rate. Since Texas doesn't levy any city or county level sales taxes, both cities have the same sales tax rates.
Income
Type Houston Austin
Estimated median household income $55,499 $79,542
Estimated per capita income $36,265 $53,937
Cost of living index (U.S. average is 100) 97.2 96.4

If you make $50,000 in Austin, you will have to make $50,415 in Houston to maintain the same standard of living.

Geographical Conditions

Houston lies near the Gulf of Mexico, leading to a flat topography prone to flooding. Austin is located in Central Texas and is characterized by its hill country, swimming holes and rivers, which may appeal to outdoor enthusiasts.
Geographical information
Type Houston Austin
Land area 579.4 sq. miles 251.5 sq. miles
Population density 3,949.2 people per sq. mile 3,833.4 people per sq. mile
Relative area comparison
Houston, TX Austin, TX
First ancestry reported - percentage
Ancestry HoustonAustin
English 2.7% 4.4%
German 2.0% 4.7%
Irish 1.4% 3.3%
Italian 0.9% 1.3%
French 0.5% 0.7%
Polish 0.4% 0.7%
Arab 0.3% 0.1%
Scottish 0.3% 1.0%
Czech 0.2% 0.4%
Greek 0.2% 0.3%
Russian 0.2% 0.4%
Scotch-Irish 0.2% 0.8%
Dutch 0.1% 0.3%
Norwegian 0.1% 0.4%
Swedish 0.1% 0.4%
Ukrainian 0.1% 0.2%
Population origin - absolute values
Ancestry HoustonAustin
English 41,532 21,730
German 31,057 23,339
Irish 21,330 16,704
Italian 14,557 6,324
French 7,393 3,488
Polish 5,776 3,685
Scottish 4,562 5,082
Arab 3,869 532
Russian 3,338 2,007
Scotch-Irish 3,185 4,002
Czech 3,030 2,119
French Canadian 2,898 922
Greek 2,745 1,317
Dutch 2,111 1,343
Swedish 1,989 2,050
Norwegian 1,901 2,052
Portuguese 1,785 519
Welsh 1,455 926
Swiss 924 590
Ukrainian 860 999
Foreign born residents - absolute values
Type Count
Region HoustonAustin
All 657,913 181,296
Africa 37,822 8,476
Asia 136,470 61,021
Europe 24,988 14,661
Latin America 451,966 91,669
North America 4,558 3,055
Oceania 2,109 863
Foreign born residents - percentage
Type Percentage
Region HoustonAustin
All 28.8% 18.6%
Africa 1.7% 0.9%
Asia 6.0% 6.3%
Europe 1.1% 1.5%
Latin America 19.8% 9.4%
North America 0.2% 0.3%

Education

Both cities are known for their quality education. Houston is home to many top-rated K-12 schools and colleges, including Rice University. Austin, on the other hand, is home to the University of Texas, one of the largest universities in the U.S. Both cities offer strong academic opportunities and resources.
School enrollment
Type Houston Austin
Nursery, preschool 31,978 (5.7%) 11,123 (5%)
Kindergarten 29,885 (5.3%) 9,376 (4.2%)
Grade 1 to 4 109,619 (19.4%) 41,790 (18.9%)
Grade 5 to 8 120,976 (21.4%) 37,907 (17.1%)
Grade 9 to 12 119,576 (21.1%) 41,993 (19%)
College undergrad 110,842 (19.6%) 55,830 (25.2%)
Graduate or professional 42,645 (7.5%) 23,263 (10.5%)
Students in private schools - absolute values
Type Count
Grade HoustonAustin
Grades 1 to 8 (elementary and middle school) 27,482 9,143
Grades 9 to 12 (high school) 8,867 2,975
Undergraduate colleges 20,329 8,830
Students in private schools - percentage
Type Percentage
Grade HoustonAustin
Grades 1 to 8 (elementary and middle school) 11.9% 11.5%
Grades 9 to 12 (high school) 7.4% 7.1%
Undergraduate colleges 18.3% 15.8%
Educational attainment
Type Houston Austin
Less than high school 21% 7.2%
High school or equiv. 21.2% 14.4%
Less than 1 year of college 4.7% 4.1%
1 or more years of college 11.2% 8.6%
Associate degree 5.6% 5.8%
Bachelor's degree 21.5% 37.9%
Master's degree 9.3% 15.7%
Profess. school degree 3.3% 3.6%
Doctorate degree 2.2% 2.6%
Education level (25-year-olds and older)
Type Houston Austin
Bachelor's degree or higher 36.3% 59.9%
Graduate or professional degree 14.8% 21.9%
High school or higher 79% 92.8%

Work and Economy

Houston's economy is largely influenced by oil, gas, aeronautics, and healthcare sectors, with opportunities for high-paying jobs. Austin, dubbed "Silicon Hills", is known for its booming high-tech industry, with many tech giants like Google and Dell having major operations in the city. Both cities have strong job markets, but opportunities vary depending on the industry.

Biggest Employers

Houston's largest employers include Texas Medical Center, NASA's Johnson Space Center, and various energy companies like ExxonMobil. In Austin, the tech industry dominates with Dell, IBM, and Apple being the top employers. The State of Texas and the University of Texas are also major employers in Austin.
Employment and residency - absolute values
Kind HoustonAustin
Work and live in this city 681,785 307,600
Work and live in this county 1,004,465 520,570
Workers who work outside the city they live in 1,271,846 348,962
Workers who work outside the county they live in 84,491 44,693
Working at home 170,371 219,183
Not working at home 918,585 346,080
Daytime population change due to commuting 403,313 127,328
Employment and residency - percentage
Kind HoustonAustin
Work and live in this city 81.0% 87.1%
Work and live in this county 92.2% 92.1%
Workers who work outside the city they live in 19.0% 12.9%
Workers who work outside the county they live in 7.8% 7.9%
Working at home 15.6% 38.8%
Not working at home 84.4% 61.2%
Daytime population change due to commuting 20.6% 19.4%
Geographical mobility: all
Type all
Mobility HoustonAustin
Same house 1 year ago 83.0% 78.4%
Moved from abroad 1% 1.4%
Moved within same county 11.9% 11.2%
Moved from different state 1.8% 4.2%
Moved within same state 2.3% 4.8%
Geographical mobility: Asian
Type Asian
Mobility HoustonAustin
Same house 1 year ago 80.0% 76.0%
Moved from abroad 1.5% 1.8%
Moved within same county 8.6% 8.8%
Moved from different state 6.1% 8.3%
Moved within same state 3.8% 5.2%
Geographical mobility: Black
Type Black
Mobility HoustonAustin
Same house 1 year ago 79.7% 72.8%
Moved from abroad 0.5% 0.9%
Moved within same county 15.5% 16.1%
Moved from different state 2.2% 4.3%
Moved within same state 2.2% 5.8%
Geographical mobility: White
Type White
Mobility HoustonAustin
Same house 1 year ago 80.6% 78.5%
Moved from abroad 1.0% 1.9%
Moved within same county 12.0% 9.6%
Moved from different state 2.8% 5.1%
Moved within same state 3.5% 4.9%
Building permits
Type Average valueCount
City HoustonAustinHoustonAustin
1997 $142,400 $113,500 3,589 2,380
1998 $155,400 $116,000 3,978 3,521
1999 $161,400 $124,400 4,089 3,302
2000 $158,800 $141,200 4,680 3,361
2001 $137,500 $136,600 4,366 2,119
2002 $125,800 $133,400 4,547 2,431
2003 $129,500 $120,000 5,552 3,117
2004 $135,200 $120,600 6,083 3,533
2005 $144,300 $127,600 7,194 4,569
2006 $155,300 $135,100 7,503 4,340
2007 $164,800 $165,100 6,035 3,155
2008 $173,500 $139,500 3,684 1,928
2009 $179,300 $139,900 2,579 1,951
2010 $175,600 $162,200 2,452 1,664
2011 $181,500 $151,000 2,575 1,713
2012 $194,900 $146,400 3,513 2,539
2013 $203,600 $184,600 5,198 2,573
2014 $213,300 $209,800 5,398 2,800
2015 $224,500 $211,200 5,112 2,846
2016 $233,700 $202,400 4,169 3,705
2017 $230,300 $208,300 5,326 4,440
2018 $235,200 $208,400 5,417 4,433
2019 $237,000 $218,000 5,120 4,568
2020 $219,600 $201,000 5,923 4,113
2021 $235,000 $167,300 7,146 4,180

There were 7,146 building permits issued in Houston in 2012 (4571 more than in 2011) compared to 4,180 building permits issued in Austin in 2012 (2467 more than in 2011).

In Houston (Harris County), 49.4% voted for Democrats and 49.3% for Republicans in 2012 Presidential Election. In Austin (Travis County), 60.2% voted for Democrats and 36.2% for Republicans.

Elections
Type DemocratsRepublicansOther
Year HoustonAustinHoustonAustinHoustonAustin
2020 56.0% 71.7% 42.7% 26.5% 1.3% 1.8%
2016 54.0% 65.8% 41.6% 27.2% 4.4% 7.0%
2012 49.4% 60.2% 49.3% 36.2% 1.3% 3.6%
2008 50.5% 63.8% 48.9% 34.4% 0.6% 1.8%
2004 44.6% 56.1% 54.9% 42.1% 0.5% 1.8%
2000 43.0% 41.7% 54.4% 47.0% 2.6% 11.3%
1996 45.2% 52.4% 49.2% 40.0% 5.6% 7.7%
Breakdown of population affiliated with a religious congregation
Type AdherentsCongregations
Religion HoustonAustinHoustonAustin
CATHOLIC CHURCH 18.1% 17.3% 3.6% 4.5%
SOUTHERN BAPTIST CONVENTION 14.2% 8.0% 26.8% 22.8%
MUSLIM ESTIMATE 2.9% 1.2% 1.6% 0.7%
EPISCOPAL CHURCH 1.0% 1.4% 1.4% 2.8%
LUTHERAN CHURCH 0.7% 0.9% 1.5% 2.1%
EVANGELICAL LUTHERAN CHURCH IN AMERICA 0.3% 1.0% 1.1% 2.5%
SEVENTH DAY ADVENTIST CHURCH 0.3% 0.2% 1.7% 1.0%

Weather

The weather in both cities is similar, characterized by hot summers and mild winters, although Houston's proximity to the Gulf of Mexico can make it more humid and prone to hurricanes. Austin, in contrast, has a more inland climate.
Weather and climate
Type Houston Austin
Temperature - Average 69.7°F 68.5°F
Humidity - Average morning or afternoon humidity 80.3% 75.2%
Humidity - Differences between morning and afternoon humidity 36.7% 40%
Humidity - Maximum monthly morning or afternoon humidity 92.8% 89%
Humidity - Minimum monthly morning or afternoon humidity 56.1% 49%
Precipitation - Yearly average 52.9 in 33.7 in
Snowfall - Yearly average 0.6 in 1.4 in
Clouds - Number of days clear of clouds 15% 19.3%
Sunshine amount - Average 60.4% 63.3%
Sunshine amount - Differences during a year 24% 22%
Sunshine amount - Maximum monthly 67% 72%
Sunshine amount - Minimum monthly 43% 50%
Wind speed - Average 8.2 mph 7.2 mph

Average climate in Houston, Texas

Chicago, Illinois average temperatures Chicago, Illinois average precipitation Chicago, Illinois humidity Chicago, Illinois wind speed Chicago, Illinois snowfall Chicago, Illinois sunshine Chicago, Illinois clear and cloudy days
 

Average climate in Austin, Texas

Chicago, Illinois average temperatures Chicago, Illinois average precipitation Chicago, Illinois humidity Chicago, Illinois wind speed Chicago, Illinois snowfall Chicago, Illinois sunshine Chicago, Illinois clear and cloudy days
 

Air pollution
Type AQICONO2OZONEPBPM25SO2
Year HoustonAustinHoustonAustinHoustonAustinHoustonAustinHouston HoustonAustinHoustonAustin
2018 102 76 0.19 N/A 9.2 4.9 21.5 26.7 N/A N/A 10.0 8.7 0.3 0.2
2017 96 76 0.16 N/A 9.4 4.6 23.1 29.7 N/A N/A 9.1 8.3 0.3 0.3
2016 91 71 0.16 N/A 10.4 4.2 22.7 29.5 N/A N/A 8.6 8.2 0.2 0.2
2015 109 78 0.15 N/A 10.1 4.4 21.7 28.9 N/A N/A 9.9 8.6 0.2 0.3
2014 98 74 0.24 N/A 10.4 5.2 21.8 28.3 N/A N/A 10.2 8.7 0.3 0.5
2013 106 78 0.25 0.09 11.1 5.5 23.0 29.5 N/A N/A 10.6 8.6 0.4 0.5
2012 115 86 0.25 0.13 11.6 5.5 23.8 30.1 N/A N/A 11.1 8.6 0.5 N/A
2011 118 83 0.27 0.11 10.8 2.6 24.6 33.0 N/A N/A 11.5 9.1 0.8 N/A
2010 110 77 0.25 0.05 12.8 3.2 22.8 29.4 N/A N/A 11.4 8.8 1.1 N/A
2009 115 76 0.21 0.05 10.5 2.6 22.1 29.7 N/A N/A 11.4 9.0 1.0 N/A
2008 105 81 0.30 0.12 13.1 3.2 22.1 30.7 0.006 N/A 12.4 9.7 1.3 N/A
2007 119 82 0.31 0.12 15.2 3.1 20.5 27.1 0.006 N/A 13.5 9.8 1.9 N/A
2006 134 89 0.32 0.14 14.6 3.8 22.3 31.3 0.006 N/A 13.0 10.0 2.3 0.2
2005 126 92 0.42 0.15 16.3 4.4 22.8 29.0 0.005 N/A 13.9 10.7 3.5 0.2
2004 137 74 0.44 0.16 17.7 3.3 20.4 26.8 0.010 N/A N/A N/A 3.2 N/A
2003 146 85 0.62 0.26 17.0 4.2 20.9 28.9 0.009 N/A N/A N/A 3.2 0.1
2002 128 83 0.55 0.33 16.1 3.9 19.7 27.2 0.007 N/A N/A N/A 1.7 N/A
2001 147 83 0.44 0.31 18.4 4.2 19.6 25.5 0.008 N/A N/A N/A 2.5 N/A
2000 136 86 0.50 0.28 17.0 4.7 22.0 27.8 0.008 N/A N/A N/A 3.1 N/A
Natural disasters
Type Houston Austin
Tornado activity compared to U.S. average 187.3% 137.9%
Earthquake activity compared to U.S. average 63.9% 80.4%
Natural disasters compared to U.S. average 32% 29%

Transportation

Both Houston and Austin have extensive highway systems, but public transportation differs. Houston has a comprehensive Metrorail and bus system that provides services in the inner city. Austin's CapMetro Bus and light rail systems are less extensive but have been improving with ongoing developments.
Transport
Type Houston Austin
Amtrak stations 1 1
Amtrak stations nearby 2 1
FAA registered aircraft 1 911
FAA registered aircraft manufacturers and dealers 44 21
Means of transportation to work
Type Houston Austin
Bicycle 0.5% 0.8%
Bus 2.4% 1.5%
Carpooled 11.1% 7.9%
Car alone 81.2% 85.9%
Motorcycle 0.1% 0.3%
Railroad 0.1% 0%
Taxicab 0.1% 0.1%
Walked 1.6% 2%
Means of transportation to work
Average travel time to work
Type Houston Austin
Average 32 min 29.9 min
Other means 27.1 min 22.7 min
Public transportation 47.6 min 37.9 min
Travel time to work
Time leaving to work
Travel time to work
Time leaving to work
Private vehicle occupancy
Type Houston Austin
Average 1.2 1.1
Drove alone 86.4% 91.2%
In 2 person carpool 9.7% 6.3%
In 3 person carpool 2.4% 1.7%
In 4 person carpool 0.9% 0.6%
In 5-6 person carpool 0.4% 0.1%
In 7+ person carpool 0.3% 0.2%

How many people usually rode to work in the car, truck or van.

Real Estate

Houston real estate is diverse and more affordable, with a wide range of housing options available. Austin's real estate market is highly competitive, with high demand driving up prices, particularly in popular central and downtown neighborhoods.

Neighborhoods

Both cities offer an array of neighborhoods suited to different lifestyles. Houston offers upscale neighborhoods like River Oaks and trendy locales like Montrose. Austin boasts historic neighborhoods like Hyde Park and lively areas like South Congress, known for its vibrant food and music scene.
Houses and residents
Type Houston Austin
Houses 1,028,763 469,156
Average household size (people) 2.6 2.4
Median year apartment built 1985 1997
Median year house/condo built 1976 1988
Length of stay in the house since moving in 14.4 years 12.1 years
Houses occupied 924,981 (89.9%) 449,399 (95.8%)
Houses occupied by owners 390,226 (42.2%) 196,458 (43.7%)
Houses occupied by renters 534,755 (57.8%) 252,941 (56.3%)
Median rent asked for vacant for-rent units $1,323 $1,286
Median monthly housing costs $1,134 $1,521
Median price asked for vacant for-sale houses and condos $334,556 $549,769
Estimated median house or condo value $236,700 $482,900
Median numbers of rooms 4.4 4.4
Median number of rooms in apartments 3.5 3.4
Median number of rooms in houses and condos 6.1 6
Median house price - detached houses $348,048 $595,996
Median house price - in 2-unit structures $232,228 $393,984
Median house price - in 3-to-4-unit structures $205,330 $262,826
Median house price - in 5 or more unit structures $297,061 $576,111
Median house price - mobile homes $68,903 $56,102
Median house price - Townhouses or other attached units $299,072 $459,657
Median house price - All housing units $337,365 $571,154
Median house age 40 28
Renting percentage 54.6% 54.9%
Housing density (houses/condos per square mile) 1,775.5 1,865.3
House value disparities 40.9% 28.4%
Household income disparities 49% 44.8%
Median household income for houses/condes with a mortgage $109,539 $141,177
Median household income for apartments without a mortgage $65,707 $86,430
Housing units without a mortgage 4,386 (2.1%) 1,799 (1.3%)
Housing units with both a second mortgage and home equity loan 7,696 (3.6%) 6,421 (4.8%)
Housing units with a mortgage 207,809 (97.9%) 132,628 (98.7%)
Housing units with a home equity loan 421 (0.2%) 206 (0.2%)
Housing units with a second mortgage 11,969 (5.6%) 8,515 (6.3%)
House/condo owner moved in on average (years ago) 13 9
House/condo renter moved in on average (years ago) 1 1
Housing units lacking complete kitchen facilities 2.4% 0.9%
Housing units lacking complete plumbing facilities 1.5% 0.6%
Housing units in structures
Housing units in structures HoustonAustin
One, detached 43.2% 43.1%
One, attached 4.8% 5.2%
Two 2.2% 2.4%
3 or 4 4.4% 4.1%
5 to 9 7.1% 7.2%
10 to 19 10.9% 11.0%
20 to 49 7.7% 8.9%
50 or more 18.6% 17.2%
Mobile homes 0.9% 1.0%
Boats, RVs, vans, etc. 0.1% 0.0%
Median real estate property taxes paid for housing units
Type Houston Austin
With mortgages $5,066 (1.8%) $7,313 (1.5%)
With no mortgages $2,428 (1.3%) $6,435 (1.4%)
Marital status
Type Houston Austin
Divorced 9.4% 10.6%
Never married 40.8% 42.3%
Now married 42.2% 43.2%
Separated 3.4% 1.2%
Widowed 4.3% 2.6%
Class of workers - percentage
Class of Workers HoustonAustin
Employee of private company 72.8% 67.8%
Self-employed workers in own not incorporated business 6.8% 6.8%
Private not-for-profit wage and salary workers 6.5% 6.9%
Local government workers 5.3% 4.9%
Self-employed in own incorporated business 3.4% 3.8%
State government workers 3.4% 8.1%
Federal government workers 1.6% 1.6%
Unpaid family workers 0.2% 0.0%
Class of workers - absolute values
Class of Workers HoustonAustin
Employee of private company 814,913 386,954
Federal government workers 18,286 9,304
Local government workers 59,583 28,036
Private not-for-profit wage and salary workers 72,379 39,279
Self-employed in own incorporated business 37,594 21,754
Self-employed workers in own not incorporated business 75,956 38,777
State government workers 38,359 46,229
Unpaid family workers 2,429 102

Industries and Occupations

Houston is world-renowned for its energy industry, particularly oil and gas, along with space exploration and healthcare. Ausitn has a diverse economy, with a particular focus on technology, entertainment, and government. The city's ecosystem fosters creativity and innovation, earning it a spot on many best places for business lists.
Most common male industries
Industry HoustonAustin
Construction 18.7% 9.0%
Professional, scientific, and technical services 9.9% 21.6%
Manufacturing 9.7% 10.9%
Retail trade 9.5% 8.7%
Transportation and warehousing 7.3% 4.5%
Administrative and support and waste management services 6.7% 2.8%
Health care and social assistance 5.8% 4.0%
Accommodation and food services 5.7% 6.5%
Educational services 4.9% 6.3%
Other services, except public administration 4.2% 3.3%
Finance and insurance 3.5% 4.8%
Wholesale trade 3.2% 2.2%
Mining, quarrying, and oil and gas extraction 2.8% 0.4%
Public administration 2.0% 4.8%
Real estate and rental and leasing 1.9% 2.7%
Arts, entertainment, and recreation 1.3% 2.1%
Information 1.2% 4.2%
Utilities 0.9% 0.7%
Management of companies and enterprises 0.4% 0.3%
Agriculture, forestry, fishing and hunting 0.4% 0.1%
Most common female industries
Industry HoustonAustin
Health care and social assistance 19.2% 14.7%
Educational services 12.4% 13.8%
Retail trade 10.8% 9.1%
Accommodation and food services 9.0% 6.4%
Professional, scientific, and technical services 7.8% 16.8%
Other services, except public administration 6.5% 6.3%
Administrative and support and waste management services 6.2% 4.0%
Manufacturing 6.0% 4.7%
Finance and insurance 5.0% 4.5%
Transportation and warehousing 3.2% 2.2%
Public administration 2.9% 6.8%
Construction 2.5% 1.2%
Real estate and rental and leasing 2.0% 3.0%
Wholesale trade 1.8% 1.2%
Mining, quarrying, and oil and gas extraction 1.4% 0.1%
Arts, entertainment, and recreation 1.3% 2.0%
Information 0.9% 2.5%
Utilities 0.9% 0.5%
Management of companies and enterprises 0.1% 0.2%
Most common male occupations
Occupation HoustonAustin
Construction and extraction occupations 15.7% 6.7%
Management occupations 9.4% 15.7%
Sales and related occupations 7.5% 9.8%
Transportation occupations 6.4% 3.7%
Business and financial operations occupations 5.9% 8.2%
Building and grounds cleaning and maintenance occupations 5.6% 1.5%
Installation, maintenance, and repair occupations 5.2% 2.4%
Production occupations 5.2% 3.0%
Material moving occupations 5.1% 1.9%
Office and administrative support occupations 4.9% 4.8%
Food preparation and serving related occupations 4.8% 4.9%
Architecture and engineering occupations 4.3% 7.7%
Computer and mathematical occupations 4.2% 12.2%
Educational instruction, and library occupations 3.1% 3.5%
Health diagnosing and treating practitioners and other technical occupations 2.5% 2.0%
Legal occupations 1.9% 1.8%
Life, physical, and social science occupations 1.6% 1.9%
Arts, design, entertainment, sports, and media occupations 1.3% 3.9%
Firefighting and prevention, and other protective service workers including supervisors 1.2% 0.8%
Health technologists and technicians 0.7% 1.1%
Most common female occupations
Occupation HoustonAustin
Office and administrative support occupations 16.6% 12.0%
Sales and related occupations 9.7% 9.3%
Management occupations 8.8% 14.4%
Food preparation and serving related occupations 7.8% 5.1%
Business and financial operations occupations 7.1% 12.0%
Educational instruction, and library occupations 7.1% 9.2%
Health diagnosing and treating practitioners and other technical occupations 6.2% 5.6%
Healthcare support occupations 6.0% 2.5%
Building and grounds cleaning and maintenance occupations 5.9% 2.9%
Personal care and service occupations 3.6% 4.3%
Material moving occupations 3.0% 1.4%
Production occupations 2.9% 1.6%
Arts, design, entertainment, sports, and media occupations 1.9% 3.6%
Legal occupations 1.9% 2.1%
Community and social service occupations 1.9% 2.3%
Computer and mathematical occupations 1.7% 5.1%
Health technologists and technicians 1.7% 1.9%
Architecture and engineering occupations 1.3% 1.6%
Life, physical, and social science occupations 1.3% 1.5%
Transportation occupations 1.3% 0.8%
Food environment data per 10,000 residents
Food environment statistics HoustonAustin
Number of convenience stores (no gas) 3.4 3.1
Number of convenience stores (with gas) 1.4 1.5
Number of full-service restaurants 5.9 8.0
Number of grocery stores 1.9 1.4
Number of supercenters and club stores 0.1 0.1
Food environment - absolute values
Food environment statistics HoustonAustin
Number of convenience stores (no gas) 1,321 301
Number of convenience stores (with gas) 530 141
Number of full-service restaurants 2,302 772
Number of grocery stores 737 133
Number of supercenters and club stores 41 8
Obesity and diabetes
Food environment statistics rate HoustonAustin
Adult diabetes rate 8.9% 6.7%
Adult obesity rate 26.0% 21.7%
Low-income preschool obesity rate 17.1% 15.3%

Health Care

Houston leads in healthcare with the world-famous Texas Medical Center, housing 60 institutions and researching institutions. Austin doesn't have such a large concentration but offers high-quality healthcare services through providers like Seton Medical Center and St. David's Healthcare.
Health (county statistics)
Type Houston Austin
General health status score of residents in this county from 1 (poor) to 5 (excellent) 3.4 3.6
Average weight of females (lbs) 163.7 lbs 159.2 lbs
Average weight of males (lbs) 198.3 lbs 194.2 lbs
Residents visited a dentist within the past year 64.1% 68%
Residents exercised in the past month 68.8% 77.3%
Adult residents drank alcohol in the past 30 days 51.1% 60.5%
Residents smoked 100+ cigarettes in their lives 37.5% 37.3%

Fatal vehicle accidents per 100,000 residents
Type Total count per 100,000Drunk per 100,000Fatal count per 100,000Pedestrian count per 100,000Person count per 100,000Vehicle count per 100,000
Year HoustonAustinHoustonAustinHoustonAustinHoustonAustinHoustonAustinHoustonAustin
2021 15.6 11.1 0.0 0.0 16.3 12.0 5.6 5.3 33.2 23.5 24.6 17.6
2020 12.7 9.4 3.8 2.2 13.3 10.5 5.1 4.2 28.0 19.9 20.9 14.4
2019 11.3 9.5 3.2 1.2 12.0 9.7 4.7 4.0 23.8 19.7 17.6 14.3
2018 9.3 8.0 3.0 1.4 9.7 8.2 3.4 3.5 20.7 15.8 15.6 12.9
2017 11.4 8.2 3.8 2.0 12.2 8.7 3.9 2.9 27.7 15.4 19.1 12.5
2016 11.6 8.8 4.7 1.2 12.0 8.9 4.4 3.5 24.2 17.8 17.8 13.0
2015 9.8 10.4 3.6 3.1 10.4 11.3 3.4 3.8 22.9 24.0 15.6 17.6
2014 11.2 5.9 4.4 1.8 12.1 6.4 3.4 1.4 27.4 14.7 18.5 9.5
2013 9.3 8.0 4.1 2.5 9.7 8.4 2.9 2.8 21.0 18.6 14.7 12.0
2012 9.0 9.3 4.1 2.5 9.8 9.6 2.5 3.8 21.1 20.8 14.8 13.6
2011 9.7 6.3 3.8 1.3 10.2 7.1 3.1 3.0 22.9 15.0 15.8 8.9
2010 10.4 6.6 5.1 3.7 11.1 6.8 2.8 1.5 23.1 14.6 16.0 10.6
2009 9.1 8.1 3.8 2.5 9.9 8.4 2.1 2.0 24.4 20.6 14.3 13.4
2008 9.6 7.2 4.7 3.4 10.2 7.3 3.2 2.1 23.5 16.2 14.4 11.2
2007 10.5 7.7 5.2 2.7 11.5 7.9 3.6 3.5 26.1 21.9 16.4 12.9
2006 10.1 7.9 4.4 3.6 10.8 9.3 2.8 2.3 28.9 23.0 16.9 12.9
2005 10.8 8.0 6.0 2.8 11.8 8.8 3.3 2.7 31.3 23.0 17.2 13.0
2004 10.4 10.2 5.4 4.5 10.9 10.5 2.6 2.0 27.9 28.0 16.2 16.2
2003 10.4 7.6 5.2 2.9 11.2 7.7 3.3 1.2 30.4 21.8 16.6 13.0
2002 12.0 9.6 6.6 5.7 13.4 10.1 3.6 1.9 32.3 24.4 18.9 14.8
2001 12.7 10.5 7.1 3.4 13.7 10.8 4.1 3.1 35.2 30.3 19.9 16.5
2000 12.0 9.4 5.7 2.1 13.3 10.7 4.0 1.8 33.1 26.5 18.8 16.0
1999 11.8 9.4 5.3 2.7 13.1 9.7 3.4 3.6 35.0 35.6 18.1 19.1
1998 12.1 9.4 4.4 2.1 13.4 10.6 4.2 2.9 34.0 36.9 18.8 24.1
1997 9.4 10.6 3.9 3.9 10.1 11.3 3.6 3.0 27.3 29.6 14.0 17.8
1996 10.2 9.1 4.7 2.8 10.9 10.0 3.9 2.8 29.1 25.1 15.0 14.4
1995 10.2 10.6 4.2 2.9 10.7 12.1 4.9 2.9 28.7 31.5 14.7 19.3
1994 9.4 8.1 3.4 2.8 10.3 9.0 3.2 2.2 27.8 21.5 15.2 12.9
1993 10.5 8.4 3.8 3.0 11.3 8.6 4.5 2.2 28.0 26.4 15.3 14.4
1992 11.6 10.2 4.9 3.3 13.0 11.3 5.1 3.6 31.4 28.0 17.6 15.5
1991 13.4 8.2 5.8 3.5 14.8 8.8 4.8 3.5 36.1 22.6 19.7 13.4
1990 14.6 6.8 7.1 3.8 16.1 7.6 0.0 0.0 42.2 21.7 21.8 12.3
1989 14.6 11.5 6.3 5.6 15.4 13.3 0.0 0.0 38.5 32.0 22.2 17.3
1988 12.4 8.2 4.6 4.0 13.6 8.4 0.0 0.0 35.8 22.7 19.4 13.9
1987 10.2 10.3 4.4 4.8 11.0 10.9 0.0 0.0 27.0 23.5 15.0 14.7
1986 11.4 15.1 3.9 6.4 11.9 16.7 0.0 0.0 28.2 38.4 15.7 23.7
1985 13.2 13.1 1.9 3.0 14.5 13.9 0.0 0.0 33.7 35.8 20.0 21.5
1984 14.5 15.5 2.7 4.2 15.4 17.7 0.0 0.0 33.9 39.6 20.6 23.1
1983 19.2 9.7 3.4 2.8 20.6 10.5 0.0 0.0 45.2 25.7 26.9 14.9
1982 22.8 10.5 3.7 4.0 24.8 11.7 0.0 0.0 50.7 24.5 30.7 14.3
1981 24.8 9.5 4.2 2.2 26.0 10.5 0.0 0.0 58.7 25.3 34.0 14.1
1980 21.8 9.5 3.2 2.6 23.1 10.1 0.0 0.0 45.4 21.1 27.9 12.7
1979 20.7 11.5 2.8 2.6 22.3 12.3 0.0 0.0 45.8 29.0 28.5 16.7
1978 17.8 8.2 2.2 1.6 18.8 9.9 0.0 0.0 39.1 20.3 24.3 12.3
1977 14.3 8.0 2.2 1.2 15.6 8.4 0.0 0.0 32.3 20.1 19.5 12.1
1976 15.2 7.0 0.1 0.0 16.1 8.0 0.0 0.0 34.0 17.3 20.1 9.7
1975 15.6 7.0 0.1 0.0 16.5 8.0 0.0 0.0 34.9 17.3 20.6 9.7

Fatal vehicle accidents
Type Total countDrunkFatal countPedestrian countPerson countVehicle count
Year HoustonAustinHoustonAustinHoustonAustinHoustonAustinHoustonAustinHoustonAustin
1975 220 35 2 0 233 40 0 0 493 86 291 48
1976 220 35 2 0 233 40 0 0 493 86 291 48
1977 212 40 32 6 232 42 0 0 480 100 290 60
1978 271 41 34 8 287 49 0 0 596 101 370 61
1979 322 57 43 13 347 61 0 0 714 144 444 83
1980 347 47 51 13 369 50 0 0 724 105 445 63
1981 397 47 67 11 416 52 0 0 939 126 544 70
1982 365 52 59 20 397 58 0 0 812 122 492 71
1983 308 48 55 14 330 52 0 0 725 128 432 74
1984 234 77 43 21 248 88 0 0 545 197 332 115
1985 213 65 30 15 234 69 0 0 544 178 322 107
1986 184 75 63 32 192 83 0 0 456 191 253 118
1987 165 51 71 24 178 54 0 0 438 117 243 73
1988 201 41 74 20 220 42 0 0 581 113 315 69
1989 237 57 102 28 250 66 0 0 626 159 362 86
1990 250 34 121 19 275 38 0 0 720 108 373 61
1991 233 42 101 18 257 45 84 18 625 115 341 68
1992 204 53 86 17 228 59 89 19 552 146 310 81
1993 186 45 67 16 200 46 79 12 495 141 271 77
1994 167 44 60 15 182 49 57 12 494 117 269 70
1995 181 59 75 16 190 67 88 16 511 175 262 107
1996 182 51 85 16 195 56 70 16 522 141 269 81
1997 169 60 71 22 183 64 65 17 494 168 253 101
1998 221 54 81 12 245 61 77 17 622 213 344 139
1999 217 55 97 16 241 57 63 21 647 209 335 112
2000 234 62 112 14 259 70 78 12 647 174 367 105
2001 254 72 142 23 274 74 81 21 701 208 397 113
2002 242 66 133 39 269 69 73 13 649 167 381 101
2003 211 52 105 20 227 53 68 8 619 150 337 89
2004 215 71 112 31 224 73 53 14 574 195 334 113
2005 225 57 125 20 246 62 69 19 649 163 358 92
2006 219 58 96 26 235 68 61 17 626 168 367 94
2007 232 58 115 20 253 59 79 26 576 164 362 97
2008 214 55 106 26 228 56 71 16 526 124 322 86
2009 206 64 85 20 223 66 47 16 552 162 323 105
2010 219 52 108 29 233 54 59 12 486 115 335 84
2011 209 52 81 11 218 58 66 25 491 123 339 73
2012 195 78 88 21 211 81 55 32 456 175 319 115
2013 204 71 91 22 213 74 63 25 462 165 322 106
2014 250 54 99 16 270 58 76 13 614 134 414 87
2015 223 96 82 29 237 104 77 35 522 221 356 162
2016 267 83 108 11 277 84 102 33 558 167 410 122
2017 264 78 89 19 282 83 90 28 641 147 441 119
2018 215 77 70 13 225 79 78 34 478 152 361 124
2019 262 93 74 12 277 95 108 39 551 193 408 140
2020 291 91 87 21 306 101 117 40 645 192 481 139
2021 357 107 0 0 373 116 129 51 760 227 564 170
Police full-time law enforcement employees
Year HoustonAustin
2021 6,249 2,087
2020 6,223 2,290
2019 6,337 2,469
2018 6,258 2,422
2017 6,334 2,366
2016 6,632 2,361
2015 6,577 2,290
2014 6,604 2,306
2013 0 2,233
2012 6,663 2,252
2011 6,531 2,211
2010 7,054 2,141
2009 7,139 2,146
2008 6,750 2,034
2007 6,338 1,995
2006 6,223 1,946
2005 6,027 1,835
2004 6,298 1,826
2003 6,804 1,744
Police full-time law enforcement employees (per 1,000 residents)
Year HoustonAustin
2021 2.7 2.1
2020 2.7 2.3
2019 2.7 2.5
2018 2.7 2.5
2017 2.7 2.4
2016 2.8 2.5
2015 2.9 2.4
2014 3.0 2.6
2013 0.0 2.6
2012 3.1 2.7
2011 3.0 2.7
2010 3.4 2.7
2009 3.1 2.8
2008 3.0 2.7
2007 2.9 2.8
2006 3.0 2.7
2005 2.9 2.6
2004 3.1 2.7
2003 3.3 2.6
Local government: full-time employees
Job HoustonAustin
Airports 1,086 498
Financial administration 732 587
Firefighters 3,906 1,129
Fire - other 171 152
Health 1,068 1,142
Judicial and legal 422 261
Local libraries 426 400
Other and unallocable 2,813 624
Other government administration 536 524
Parks and recreation 594 1,168
Police - other 1,112 608
Police protection - officers 5,231 1,858
Sewerage 656 509
Solid waste management 422 476
Streets and highways 765 814
Totals for government 20,758 13,367
Water supply 635 579
Local government: part-time employees
Job HoustonAustin
Airports 1 8
Financial administration 10 39
Fire - other 22 2
Health 110 69
Judicial and legal 53 16
Local libraries 53 36
Other and unallocable 85 34
Other government administration 13 24
Parks and recreation 162 709
Police - other 1 18
Sewerage 0 19
Solid waste management 16 13
Streets and highways 3 241
Totals for government 538 1,331
Water supply 0 16
Place of birth - Foreign born
Residents HoustonAustin
All residents 28.8% 18.2%
American Indian / Alaska Native residents 42.7% 7.1%
Asian residents 70.0% 60.4%
Black or African American residents 8.0% 11.6%
Native Hawaiian / Pacific Islander residents 1.7% 4.1%
Other race residents 50.1% 37.4%
Two or more races residents 37.7% 16.8%
White residents 12.6% 7.9%
White alone, not Hispanic / Latino residents 10.1% 5.7%
Place of birth - Native, outside of US
Residents HoustonAustin
All residents 1.7% 2.5%
American Indian / Alaska Native residents 0.4% 0.0%
Asian residents 1.9% 1.8%
Black or African American residents 0.8% 1.3%
Native Hawaiian / Pacific Islander residents 19.7% 3.2%
Other race residents 1.9% 2.3%
Two or more races residents 2.2% 3.8%
White residents 1.8% 2.0%
White alone, not Hispanic / Latino residents 1.5% 1.7%
Place of birth - Born in state of residence
Residents HoustonAustin
All residents 51.1% 47.2%
American Indian / Alaska Native residents 45.1% 56.7%
Asian residents 19.6% 23.0%
Black or African American residents 67.6% 54.4%
Native Hawaiian / Pacific Islander residents 59.0% 33.0%
Other race residents 44.0% 53.4%
Two or more races residents 49.8% 55.7%
White residents 52.5% 47.9%
White alone, not Hispanic / Latino residents 51.2% 48.1%
Place of birth - Born in other state
Residents HoustonAustin
All residents 18.5% 32.1%
American Indian / Alaska Native residents 11.9% 36.2%
Asian residents 8.6% 14.8%
Black or African American residents 23.6% 32.7%
Native Hawaiian / Pacific Islander residents 19.6% 59.6%
Other race residents 3.9% 7.0%
Two or more races residents 10.3% 23.7%
White residents 33.0% 42.3%
White alone, not Hispanic / Latino residents 37.3% 44.6%
English speakers (speaking English at home)
Type Houston Austin
Born in the United States residents 86.4% 91.1%
Foreign born residents 9.8% 15.7%
Native, born elsewhere residents 41% 58.1%
Total residents 51.9% 69.5%
Mechanisms of homicide
Mechanism HoustonAustin
Homicides from 2000 to 2006 2,569 223
Cut / Pierce 240 48
Firearm 1,857 97
Fire / Burn 29 0
Struck by / against 28 0
Suffocation 76 0
Mechanisms of homicide per 1,000,000 residents
Mechanism HoustonAustin
Homicides from 2000 to 2006 101.5 36.6
Cut / Pierce 9.5 7.9
Firearm 73.4 15.9
Fire / Burn 1.1 0
Struck by / against 1.1 0
Suffocation 3.0 0
Mechanisms of suicide per 1,000,000 residents
Mechanism HoustonAustin
Suicides from 2000 to 2006 95.8 115.5
Cut / Pierce 1.3 0
Fall 2.4 0
Firearm 54.0 54.2
Poisoning 17.2 25.6
Suffocation 17.9 27.4

Infrastructure

Houston has a more expansive infrastructure, given its size and population. Austin, however, is known for its extensive park system and developing tech infrastructure. Both cities have faced challenges with traffic congestion and road maintenance but continue to invest in infrastructure improvements.
Infrastructure
Type Houston Austin
Hospitals 156 65
TV stations 26 20
Arenas or stadiums 6 2
Bank branches located here 755 264
Bank institutions located here 81 43
Main business address for public companies 197 44
Drinking water stations with no reported violations in the past 49 46
Drinking water stations with reported violations in the past 122 95

Schools

School facilities
Type Houston Austin
Private elementary/middle schools 104 35
Private high schools 50 22
Public elementary/middle schools 546 184
Public high schools 167 54
Colleges/Universities 73 37
HMDA - Conventional home purchase loans - Applications denied
Year HoustonAustin
1999 9,163 4,733
2000 0 2,950
2001 0 2,038
2002 0 1,772
2003 8,173 2,213
2004 11,803 2,458
2005 15,127 3,121
2006 16,911 3,367
2007 10,643 2,560
2008 4,410 1,747
2009 2,279 1,067

Culture and Food

Houston, being one of the most diverse cities in the U.S., offers an array of international cuisines. Austin, famously known as the "Live Music Capital of the World," has a food scene dominated by food trucks, microbreweries, and barbecue. Both cities have active arts scenes and music festivals.

Sports Teams

Houston enthralls sports fans with professional teams in all major sports: the Texans (NFL), Astros (MLB), Rockets (NBA), and Dynamo (MLS). Austin has one MLS team, Austin FC, though it lacks teams in other major leagues, but the city's college sports scene is vibrant due to the University of Texas.
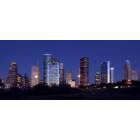
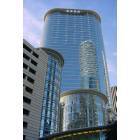
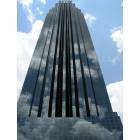