Indianapolis, IN vs Arlington, VA - Advanced U.S. city comparison tool

Indianapolis, IN vs Arlington, VA

Indianapolis, IN, and Arlington, VA, both offer unique qualities and attractions that make them desired locations. Indianapolis, known as the "Crossroads of America," is a hotspot for sports enthusiasts, while Arlington is lauded for its rich historical landmarks and proximity to Washington D.C. The differences span across crime rates, living costs, education, work opportunities, culture, and more. This comparison will aid those considering a move to either city or simply planning a visit.
 
 
Distance between Indianapolis, IN and Arlington, VA : 486.9 miles

Indianapolis's population is larger by 279%. Its population has grown by 100,169 people (12.8%) since 2000. The population of Arlington has grown by 43,512 people (23.0%) during that time.

Population
Type Indianapolis Arlington
Population 882,039 232,965
Female / male percentage 51.2% / 48.8%
51.2%
48.8%
49.6% / 50.4%
49.6%
50.4%
Racial makeup - percentage
Ethnicity IndianapolisArlington
White Non-Hispanic 51.1% 58.8%
Black 27.9% 8.9%
Hispanic 11.2% 15.6%
Two or more 4.8% 5.7%
Asian 4.1% 10.3%
Racial makeup - absolute values
Ethnicity IndianapolisArlington
White Non-Hispanic 451,187 136,920
Black 246,609 20,788
Hispanic 98,852 36,284
Two or more 42,035 13,213
Asian 36,008 24,109
American Indian 234 77
Pacific Islander 0 46

Crime and Safety

Living in Indianapolis is generally considered less safe than Arlington. According to FBI crime data, Indianapolis's crime rate stands higher than the national average. On the other hand, Arlington is often ranked among the safest cities in the nation. A relatively low crime rate and vigilant police force provide a sense of safety for residents and tourists alike.

Cost of Living

Indianapolis's cost of living is significantly lower than Arlington's. Housing is notably more affordable in Indianapolis, making it a more attractive option for home buyers. Arlington, being part of the Washington DC metropolitan area, has a higher cost of living, with housing being the biggest factor.

Income Tax

In Indiana, the top income tax rate is flat at 3.23%, plus a county tax of up to 3.38% in Indianapolis. Virginia has a progressive income tax, with rates from 2% to 5.75%. Arlington County does not impose an additional income tax.

Property Tax

Homeowners in Indianapolis pay a lower property tax rate compared to Arlington. The average rate in Indianapolis is around 0.85%, while in Arlington, it's about 1.026%.

Sales Tax

Indianapolis residents face a state sales tax of 7%, with no additional local sales tax. In Arlington, the combined sales tax rate is 6%—5.3% state sales tax and 0.7% Arlington tax.
Income
Type Indianapolis Arlington
Estimated median household income $58,479 $125,651
Estimated per capita income $32,792 $80,996
Cost of living index (U.S. average is 100) 87.7 171.8

If you make $50,000 in Indianapolis, you will have to make $97,948 in Arlington to maintain the same standard of living.

Geographical Conditions

Indianapolis is located in the Midwest, with a landscape dominated by farmland, forest, and small hills. Arlington, located on the Potomac River's west bank, offers rolling hills and green space links to numerous national parks.
Geographical information
Type Indianapolis Arlington
Land area 361.5 sq. miles 25.9 sq. miles
Population density 2,440.1 people per sq. mile 9,005.3 people per sq. mile
First ancestry reported - percentage
Ancestry IndianapolisArlington
German 8.9% 3.9%
English 4.8% 3.3%
Irish 4.3% 5.2%
Italian 1.1% 3.1%
Scottish 0.9% 0.9%
Polish 0.7% 1.1%
French 0.5% 0.8%
Scotch-Irish 0.4% 0.5%
Dutch 0.4% 0.3%
Welsh 0.2% 0.3%
Swedish 0.2% 0.4%
Norwegian 0.2% 0.5%
Russian 0.2% 1.2%
Greek 0.2% 1.0%
French Canadian 0.1% 0.3%
Ukrainian 0.1% 0.7%
Arab 0.1% 0.2%
Portuguese 0.0% 0.3%
Population origin - absolute values
Ancestry IndianapolisArlington
German 41,186 4,544
English 22,059 3,936
Irish 19,931 6,091
Italian 4,960 3,630
Scottish 3,947 1,076
Polish 3,361 1,291
French 2,276 987
Scotch-Irish 2,031 619
Dutch 1,710 339
Swedish 953 423
Norwegian 927 533
Greek 886 1,174
Russian 851 1,395
Welsh 726 343
French Canadian 586 366
Swiss 547 83
Hungarian 416 207
Arab 395 249
Ukrainian 388 840
Czech 258 155
Foreign born residents - absolute values
Type Count
Region IndianapolisArlington
All 91,704 52,696
Africa 17,067 6,190
Asia 26,426 20,069
Europe 4,722 6,777
Latin America 39,630 18,505
North America 441 526
Oceania 258 319
Foreign born residents - percentage
Type Percentage
Region IndianapolisArlington
All 10.4% 22.6%
Africa 1.9% 2.7%
Asia 3.0% 8.6%
Europe 0.5% 2.9%
Latin America 4.5% 7.9%
North America 0.1% 0.2%
Oceania 0.0% 0.1%

Education

Indianapolis public schools serve over 30,000 students across 70 schools, with additional charter and private school options. When it comes to higher education, It's home to reputable institutions like Indiana University-Purdue University Indianapolis. Arlington, on the other hand, has a strong reputation for education, with renowned high-performing schools and proximity to prestigious universities like Georgetown University and George Washington University.
School enrollment
Type Indianapolis Arlington
Nursery, preschool 11,998 (5.5%) 3,652 (7.6%)
Kindergarten 11,472 (5.3%) 2,762 (5.8%)
Grade 1 to 4 45,817 (21.1%) 9,837 (20.6%)
Grade 5 to 8 50,108 (23.1%) 7,839 (16.4%)
Grade 9 to 12 46,328 (21.4%) 8,602 (18%)
College undergrad 36,567 (16.9%) 5,675 (11.9%)
Graduate or professional 14,587 (6.7%) 9,469 (19.8%)
Students in private schools - absolute values
Type Count
Grade IndianapolisArlington
Grades 1 to 8 (elementary and middle school) 21,080 2,590
Grades 9 to 12 (high school) 9,278 674
Undergraduate colleges 8,480 1,731
Students in private schools - percentage
Type Percentage
Grade IndianapolisArlington
Grades 1 to 8 (elementary and middle school) 22.0% 14.7%
Grades 9 to 12 (high school) 20.0% 7.8%
Undergraduate colleges 23.2% 30.5%
Educational attainment
Type Indianapolis Arlington
Less than high school 11.7% 4.7%
High school or equiv. 27.4% 7.4%
Less than 1 year of college 7.3% 2.1%
1 or more years of college 11.4% 5.4%
Associate degree 7.5% 3.8%
Bachelor's degree 22% 34.9%
Master's degree 8.7% 29%
Profess. school degree 2.5% 8.1%
Doctorate degree 1.5% 4.6%
Education level (25-year-olds and older)
Type Indianapolis Arlington
Bachelor's degree or higher 34.7% 76.6%
Graduate or professional degree 12.7% 41.7%
High school or higher 88.3% 95.3%

Work and Economy

Indianapolis has a robust economy, with a focus on manufacturing, health care, and education. Arlington boasts a stronger job market due to its proximity to Washington, D.C, offering a diverse mix of governmental, technology, and service jobs. The federal government is a significant employer in Arlington.

Biggest Employers

In Indianapolis, some of the biggest employers include IU Health, St. Vincent, and Eli Lilly and Co. In Arlington, top employers comprise the Department of Defense, Arlington County, and Deloitte.
Employment and residency - absolute values
Kind IndianapolisArlington
Work and live in this city 315,658 34,379
Work and live in this county 341,614 97,636
Workers who work outside the city they live in 466,212 155,074
Workers who work outside the county they live in 88,012 45,017
Working at home 70,856 69,593
Not working at home 358,770 73,060
Daytime population change due to commuting 121,962 47,600
Employment and residency - percentage
Kind IndianapolisArlington
Work and live in this city 81.9% 29.6%
Work and live in this county 79.5% 68.4%
Workers who work outside the city they live in 18.1% 70.4%
Workers who work outside the county they live in 20.5% 31.6%
Working at home 16.5% 48.8%
Not working at home 83.5% 51.2%
Daytime population change due to commuting 15.6% 25.1%
Geographical mobility: all
Type all
Mobility IndianapolisArlington
Same house 1 year ago 86.0% 78.0%
Moved from abroad 0.7% 2.3%
Moved within same county 8.4% 8.4%
Moved from different state 1.7% 7.7%
Moved within same state 3.2% 3.6%
Geographical mobility: Asian
Type Asian
Mobility IndianapolisArlington
Same house 1 year ago 88.1% 71.7%
Moved from abroad 0.7% 5.2%
Moved within same county 7.6% 10.6%
Moved from different state 3.0% 9.5%
Moved within same state 0.6% 2.9%
Geographical mobility: Black
Type Black
Mobility IndianapolisArlington
Same house 1 year ago 88.3% 78.1%
Moved from abroad 1.3% 1.9%
Moved within same county 8.0% 5.0%
Moved from different state 1.3% 12.2%
Moved within same state 1.2% 2.7%
Geographical mobility: White
Type White
Mobility IndianapolisArlington
Same house 1 year ago 85.7% 75.7%
Moved from abroad 0.2% 2.4%
Moved within same county 7.9% 10.0%
Moved from different state 1.7% 8.3%
Moved within same state 4.4% 3.5%

In Indianapolis (Marion County), 60.1% voted for Democrats and 37.9% for Republicans in 2012 Presidential Election. In Arlington (Arlington County), 69.3% voted for Democrats and 29.4% for Republicans.

Elections
Type DemocratsRepublicansOther
Year IndianapolisArlingtonIndianapolisArlingtonIndianapolisArlington
2020 63.7% 80.6% 34.5% 17.1% 1.9% 2.3%
2016 58.2% 75.8% 35.6% 16.6% 6.2% 7.5%
2012 60.1% 69.3% 37.9% 29.4% 2.0% 1.3%
2008 63.8% 71.8% 35.4% 27.2% 0.8% 1.0%
2004 50.6% 67.6% 48.7% 31.3% 0.7% 1.1%
2000 48.0% 60.4% 49.3% 34.3% 2.8% 5.3%
1996 44.6% 60.5% 47.8% 34.6% 7.7% 4.9%
Breakdown of population affiliated with a religious congregation
Type AdherentsCongregations
Religion IndianapolisArlingtonIndianapolisArlington
CATHOLIC CHURCH 11.1% 14.6% 4.6% 6.2%
SOUTHERN BAPTIST CONVENTION 1.6% 1.3% 5.7% 16.8%
AMERICAN BAPTIST CHURCHES IN THE USA 1.2% 0.5% 3.4% 2.7%
LUTHERAN CHURCH 0.8% 0.3% 1.5% 0.9%
EVANGELICAL LUTHERAN CHURCH IN AMERICA 0.5% 0.6% 1.6% 2.7%
SEVENTH DAY ADVENTIST CHURCH 0.5% 0.1% 1.6% 1.8%
EPISCOPAL CHURCH 0.4% 2.0% 1.1% 8.0%
MUSLIM ESTIMATE 0.3% 1.7% 1.1% 0.9%

Weather

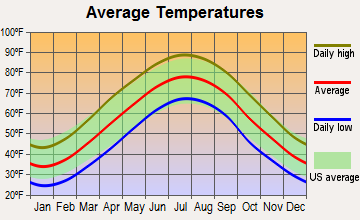
Indianapolis experiences four distinct seasons with hot, humid summers, and sometimes severe winters. Spring and fall are generally mild and pleasing. Contrastingly, Arlington also has four seasons but with milder winters owing to its coastal location. It can be humid in summers, but winter temperatures are milder compared to Indianapolis.
Weather and climate
Type Indianapolis Arlington
Temperature - Average 52.1°F 56.6°F
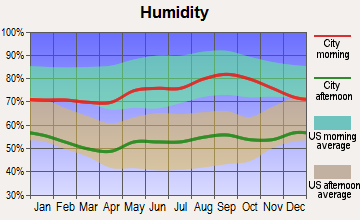
Humidity - Average morning or afternoon humidity 77% 68.8%
Humidity - Differences between morning and afternoon humidity 31% 33%
Humidity - Maximum monthly morning or afternoon humidity 86% 81%
Humidity - Minimum monthly morning or afternoon humidity 55% 48%
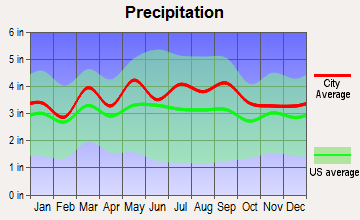
Precipitation - Yearly average 40.6 in 43.4 in
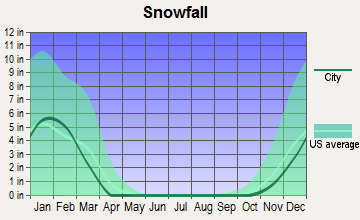
Snowfall - Yearly average 51 in 32.4 in
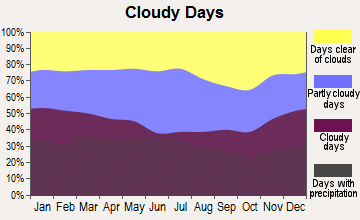
Clouds - Number of days clear of clouds 14.7% 15.9%
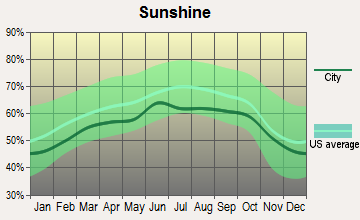
Sunshine amount - Average 56.2% 61.5%
Sunshine amount - Differences during a year 33% 21%
Sunshine amount - Maximum monthly 65% 66%
Sunshine amount - Minimum monthly 32% 45%
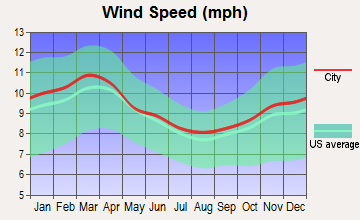
Wind speed - Average 10.3 mph 9.7 mph

Average climate in Indianapolis, Indiana

Chicago, Illinois average temperatures Chicago, Illinois average precipitation Chicago, Illinois humidity Chicago, Illinois wind speed Chicago, Illinois snowfall Chicago, Illinois sunshine Chicago, Illinois clear and cloudy days
 

Average climate in Arlington, Virginia

Chicago, Illinois average temperatures Chicago, Illinois average precipitation Chicago, Illinois humidity Chicago, Illinois wind speed Chicago, Illinois snowfall Chicago, Illinois sunshine Chicago, Illinois clear and cloudy days
 

Air pollution
Type AQICONO2OZONEPBPM10PM25SO2
Year IndianapolisArlingtonIndianapolisArlingtonIndianapolisArlingtonIndianapolisArlingtonIndianapolisArlingtonIndianapolisArlingtonIndianapolisArlingtonIndianapolisArlington
2018 94 88 0.58 0.30 13.2 9.1 23.1 26.2 N/A N/A 18.2 16.4 10.4 8.4 0.3 0.7
2017 87 84 0.82 0.25 12.4 9.5 23.0 27.7 N/A N/A 17.6 16.5 10.1 9.0 0.4 0.7
2016 91 98 0.62 0.25 13.0 10.6 22.5 27.5 N/A 0.002 18.0 17.2 9.9 8.7 0.4 0.8
2015 89 91 0.73 0.34 14.9 10.9 22.9 26.7 N/A 0.002 19.7 17.0 9.9 9.5 1.1 1.1
2014 100 85 0.62 0.27 16.1 10.9 25.1 26.2 N/A 0.002 20.6 17.1 12.1 9.3 3.2 1.0
2013 94 90 0.69 0.33 11.5 10.9 26.3 26.6 N/A 0.002 19.9 17.3 12.8 10.1 2.6 0.8
2012 103 104 0.65 0.33 10.4 11.7 25.7 27.9 N/A 0.002 20.8 N/A 12.9 10.9 2.9 1.0
2011 105 105 0.68 0.18 11.3 12.3 22.9 28.4 N/A 0.002 N/A N/A 16.3 11.0 2.4 1.5
2010 101 114 0.54 0.23 12.7 12.9 21.6 29.8 N/A 0.003 N/A N/A 15.9 9.7 3.3 2.5
2009 97 90 0.73 0.24 11.4 12.7 23.2 24.7 N/A 0.002 N/A N/A 13.8 8.1 1.9 2.7
2008 91 103 0.62 0.23 11.5 13.3 N/A 25.8 0.010 0.003 N/A N/A 13.2 8.9 3.0 4.3
2007 103 113 0.69 0.28 13.1 15.6 N/A 27.7 0.011 0.004 N/A N/A 14.9 10.4 3.6 4.5
2006 95 114 0.59 0.49 14.5 17.7 N/A 25.9 0.009 0.004 N/A N/A 14.5 10.9 3.6 4.3
2005 121 105 0.65 0.30 15.2 21.0 N/A 23.6 0.014 0.006 N/A N/A 18.0 11.7 4.3 5.7
2004 104 114 0.62 0.22 15.8 21.6 N/A 23.5 0.010 0.004 N/A N/A 15.1 11.3 4.6 5.9
2003 113 108 0.67 0.36 16.6 26.0 N/A 21.7 0.010 N/A N/A N/A 15.8 12.2 4.2 6.1
2002 125 131 0.76 0.48 17.4 21.8 N/A 25.9 0.009 N/A N/A N/A 16.8 N/A 3.9 6.0
2001 105 111 0.81 0.43 16.6 22.1 N/A 24.1 0.031 0.017 N/A N/A 16.3 N/A 3.8 7.2
2000 98 110 0.87 0.50 17.3 22.7 N/A 20.2 N/A N/A N/A N/A N/A N/A 4.5 10.1
Natural disasters
Type Indianapolis Arlington
Tornado activity compared to U.S. average 226.7% 110%
Earthquake activity compared to U.S. average 179.6% 43.5%
Natural disasters compared to U.S. average 16% 14%

Transportation

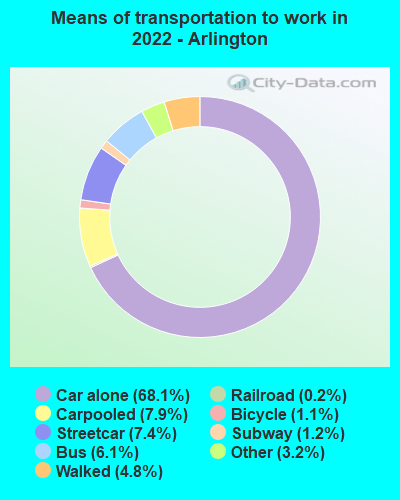
In Indianapolis, most residents commute by car. The city has a bus system, but it's less extensive than Arlington, which boasts a robust public transportation system including the Metrorail and Metrobus systems, complemented by bike-sharing services.
Transport
Type Indianapolis Arlington
Amtrak stations 1 0
Amtrak stations nearby 1 3
FAA registered aircraft 739 103
FAA registered aircraft manufacturers and dealers 18 5
Means of transportation to work
Type Indianapolis Arlington
Bicycle 0.5% 0.8%
Bus 1.2% 3.6%
Carpooled 8.5% 6.5%
Car alone 87.3% 71.3%
Motorcycle 0% 0.1%
Railroad 0% 0.4%
Streetcar 0% 7.8%
Subway 0% 1.1%
Taxicab 0.1% 0.4%
Walked 1.6% 6%
Means of transportation to work
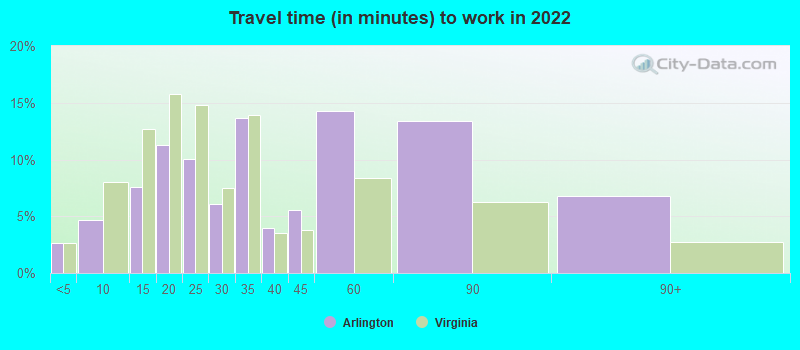
Average travel time to work
Type Indianapolis Arlington
Average 28.1 min 34.8 min
Other means 22.5 min 25.7 min
Public transportation 40.2 min 36.7 min
Travel time to work
Time leaving to work
Travel time to work
Time leaving to work
Private vehicle occupancy
Type Indianapolis Arlington
Average 1.2 1.1
Drove alone 88.2% 92.8%
In 2 person carpool 9.4% 6.3%
In 3 person carpool 1.3% 0.8%
In 4 person carpool 0.5% 0.1%
In 5-6 person carpool 0.4% 0%
In 7+ person carpool 0.1% 0%

How many people usually rode to work in the car, truck or van.

Real Estate

The real estate market in Indianapolis is considered more accessible due to lower home prices compared to Arlington. In contrast, Arlington's real estate market is highly competitive, with home prices significantly higher, due to the influx of high-income earners and its proximity to Washington, D.C.

Neighborhoods

Indianapolis is known for its diverse neighborhoods, offering a mix of urban and suburban living, with Broad Ripple Village and Meridian-Kessler being popular. Arlington is renowned for its high-end neighborhoods like Ballston and Clarendon, known for their walkability, shops, and dining options.
Houses and residents
Type Indianapolis Arlington
Houses 399,820 119,446
Average household size (people) 2.4 2.1
Median year apartment built 1977 1983
Median year house/condo built 1971 1959
Length of stay in the house since moving in 13 years 12.7 years
Houses occupied 358,150 (89.6%) 108,396 (90.7%)
Houses occupied by owners 201,149 (56.2%) 47,577 (43.9%)
Houses occupied by renters 157,001 (43.8%) 60,819 (56.1%)
Median rent asked for vacant for-rent units $876.58 $3,620
Median monthly housing costs $980 $2,164
Median price asked for vacant for-sale houses and condos $283,027 $891,291
Estimated median house or condo value $188,700 $779,400
Median numbers of rooms 5.5 4.1
Median number of rooms in apartments 4.3 3.3
Median number of rooms in houses and condos 6.5 6.7
Median house price - detached houses $231,490 Over $1,000,000
Median house price - in 2-unit structures $257,253 $648,538
Median house price - in 3-to-4-unit structures $240,688 $442,578
Median house price - in 5 or more unit structures $247,275 $566,559
Median house price - Townhouses or other attached units $222,424 $703,291
Median house price - All housing units $229,666 $877,770
Median house age 48 47
Renting percentage 44.2% 56.7%
Housing density (houses/condos per square mile) 1,106.1 4,617.2
House value disparities 36.1% 24.9%
Household income disparities 44.4% 37.5%
Median household income for houses/condes with a mortgage $86,008 $201,635
Median household income for apartments without a mortgage $61,922 $133,857
Housing units without a mortgage 4,552 (3.2%) 596 (1.6%)
Housing units with both a second mortgage and home equity loan 9,787 (6.8%) 3,235 (8.9%)
Housing units with a mortgage 138,622 (96.8%) 35,674 (98.4%)
Housing units with a home equity loan 271 (0.2%) 101 (0.3%)
Housing units with a second mortgage 12,987 (9.1%) 4,221 (11.6%)
House/condo owner moved in on average (years ago) 11 10
House/condo renter moved in on average (years ago) 1 1
Housing units lacking complete kitchen facilities 3.4% 0.7%
Housing units lacking complete plumbing facilities 1.1% 0.2%
Housing units in structures
Housing units in structures IndianapolisArlington
One, detached 59.0% 25.1%
One, attached 9.2% 9.6%
Two 2.5% 0.8%
3 or 4 6.2% 3.5%
5 to 9 7.7% 5.2%
10 to 19 6.3% 5.0%
20 to 49 3.1% 4.6%
50 or more 5.0% 46.1%
Mobile homes 1.0% 0.2%
Median real estate property taxes paid for housing units
Type Indianapolis Arlington
With mortgages $1,803 (0.9%) $6,796 (0.9%)
With no mortgages $1,619 (1%) $7,305 (0.9%)
Marital status
Type Indianapolis Arlington
Divorced 13.2% 7.4%
Never married 39% 43.6%
Now married 41.9% 44.6%
Separated 1.5% 1.1%
Widowed 4.4% 3.2%
Class of workers - percentage
Class of Workers IndianapolisArlington
Employee of private company 69.2% 54.8%
Private not-for-profit wage and salary workers 11.1% 12.7%
Local government workers 5.7% 5.7%
Self-employed workers in own not incorporated business 3.9% 4.4%
State government workers 3.5% 1.3%
Self-employed in own incorporated business 3.2% 2.6%
Federal government workers 3.0% 18.5%
Unpaid family workers 0.4% 0.0%
Class of workers - absolute values
Class of Workers IndianapolisArlington
Employee of private company 302,893 76,844
Federal government workers 13,085 25,967
Local government workers 24,951 7,926
Private not-for-profit wage and salary workers 48,421 17,832
Self-employed in own incorporated business 13,885 3,618
Self-employed workers in own not incorporated business 17,131 6,119
State government workers 15,502 1,820
Unpaid family workers 1,601 32

Industries and Occupations

Key industries in Indianapolis include advanced manufacturing, health and life sciences, and logistics. The city accommodates many health and biotechnology firms. In Arlington, IT, government, and professional services dominate, supporting high-income jobs due to the presence of federal government offices and defense contractors.
Most common male industries
Industry IndianapolisArlington
Manufacturing 13.3% 2.9%
Retail trade 13.2% 4.9%
Transportation and warehousing 11.8% 1.3%
Construction 9.8% 5.2%
Professional, scientific, and technical services 8.9% 32.0%
Accommodation and food services 6.0% 3.3%
Health care and social assistance 5.1% 3.3%
Administrative and support and waste management services 4.7% 3.0%
Educational services 4.7% 5.5%
Finance and insurance 4.6% 6.7%
Public administration 4.2% 17.8%
Wholesale trade 3.9% 0.3%
Other services, except public administration 3.5% 3.4%
Arts, entertainment, and recreation 1.9% 2.5%
Real estate and rental and leasing 1.3% 3.8%
Utilities 1.3% 0.4%
Information 1.2% 3.4%
Agriculture, forestry, fishing and hunting 0.6% 0.0%
Management of companies and enterprises 0.1% 0.2%
Mining, quarrying, and oil and gas extraction 0.1% 0.0%
Most common female industries
Industry IndianapolisArlington
Health care and social assistance 22.1% 11.8%
Retail trade 11.7% 2.5%
Educational services 11.5% 12.7%
Manufacturing 8.4% 2.4%
Professional, scientific, and technical services 7.0% 24.1%
Finance and insurance 6.5% 4.2%
Accommodation and food services 6.3% 4.4%
Transportation and warehousing 5.2% 0.7%
Public administration 5.1% 15.2%
Other services, except public administration 4.2% 9.8%
Administrative and support and waste management services 3.8% 2.6%
Arts, entertainment, and recreation 2.0% 2.1%
Real estate and rental and leasing 1.8% 3.0%
Wholesale trade 1.5% 0.4%
Information 1.1% 3.2%
Construction 1.1% 0.3%
Agriculture, forestry, fishing and hunting 0.4% 0.0%
Management of companies and enterprises 0.4% 0.0%
Utilities 0.1% 0.7%
Most common male occupations
Occupation IndianapolisArlington
Management occupations 10.7% 16.5%
Material moving occupations 9.8% 1.7%
Office and administrative support occupations 8.7% 3.0%
Sales and related occupations 8.0% 7.8%
Construction and extraction occupations 8.0% 2.1%
Production occupations 7.3% 1.4%
Transportation occupations 6.2% 2.1%
Business and financial operations occupations 6.0% 15.1%
Installation, maintenance, and repair occupations 5.3% 3.8%
Food preparation and serving related occupations 4.7% 1.6%
Computer and mathematical occupations 3.9% 14.5%
Educational instruction, and library occupations 2.8% 4.2%
Health diagnosing and treating practitioners and other technical occupations 2.7% 1.2%
Building and grounds cleaning and maintenance occupations 2.6% 1.1%
Architecture and engineering occupations 2.6% 2.9%
Arts, design, entertainment, sports, and media occupations 2.3% 5.9%
Law enforcement workers including supervisors 1.4% 1.2%
Legal occupations 1.3% 8.3%
Life, physical, and social science occupations 1.2% 3.0%
Firefighting and prevention, and other protective service workers including supervisors 1.2% 0.5%
Most common female occupations
Occupation IndianapolisArlington
Office and administrative support occupations 18.7% 7.4%
Management occupations 9.2% 16.4%
Business and financial operations occupations 7.8% 16.8%
Sales and related occupations 7.7% 4.4%
Educational instruction, and library occupations 7.6% 10.5%
Health diagnosing and treating practitioners and other technical occupations 6.3% 5.6%
Healthcare support occupations 6.0% 1.0%
Food preparation and serving related occupations 5.1% 3.6%
Material moving occupations 4.9% 0.1%
Production occupations 4.3% 0.8%
Personal care and service occupations 3.7% 2.9%
Health technologists and technicians 3.3% 1.0%
Community and social service occupations 2.9% 1.8%
Building and grounds cleaning and maintenance occupations 2.2% 1.6%
Computer and mathematical occupations 1.9% 9.2%
Arts, design, entertainment, sports, and media occupations 1.8% 5.4%
Transportation occupations 1.5% 0.0%
Legal occupations 1.4% 5.0%
Life, physical, and social science occupations 1.3% 3.7%
Architecture and engineering occupations 0.8% 2.1%
Food environment data per 10,000 residents
Food environment statistics IndianapolisArlington
Number of convenience stores (no gas) 3.0 1.4
Number of convenience stores (with gas) 0.4 2.0
Number of full-service restaurants 7.2 10.8
Number of grocery stores 1.7 2.2
Number of supercenters and club stores 0.2 0.1
Food environment - absolute values
Food environment statistics IndianapolisArlington
Number of convenience stores (no gas) 264 28
Number of convenience stores (with gas) 31 40
Number of full-service restaurants 634 221
Number of grocery stores 150 44
Number of supercenters and club stores 20 1
Obesity and diabetes
Food environment statistics rate IndianapolisArlington
Adult diabetes rate 9.0% 6.9%
Adult obesity rate 28.5% 20.7%
Low-income preschool obesity rate 15.0% 22.0%

Health Care

Indianapolis boasts renowned healthcare facilities, including the highly ranked Indiana University Health Medical Center. Arlington benefits from being near top-rated hospitals in Washington, D.C., and it's home to the Virginia Hospital Center, a top-ranked facility in Virginia.

Fatal vehicle accidents per 100,000 residents
Type Total count per 100,000Drunk per 100,000Fatal count per 100,000Pedestrian count per 100,000Person count per 100,000Vehicle count per 100,000
Year IndianapolisArlingtonIndianapolisArlingtonIndianapolisArlingtonIndianapolisArlingtonIndianapolisArlingtonIndianapolisArlington
2021 15.9 3.4 0.0 0.0 16.8 3.4 4.5 0.5 35.9 7.7 27.1 5.3
2020 14.2 2.4 3.7 1.0 15.3 2.9 5.5 1.0 32.2 3.4 22.8 3.4
2019 11.2 2.9 2.9 0.5 11.6 2.9 3.0 1.9 25.2 3.4 19.4 3.4
2018 11.1 1.0 2.5 1.0 11.9 1.0 3.8 0.5 23.6 1.9 18.0 1.4
2017 10.6 2.4 1.9 0.5 11.1 2.4 3.9 1.0 23.3 3.9 15.7 2.9
2016 10.9 0.5 2.9 0.0 11.6 0.5 3.4 0.0 24.3 0.5 17.5 0.5
2015 10.1 2.4 1.4 0.5 11.1 2.4 3.9 0.5 23.5 3.9 15.8 3.9
2014 9.2 2.4 0.7 1.0 9.8 2.4 2.7 1.0 20.3 2.9 15.1 3.4
2013 8.2 1.0 1.7 0.5 9.1 1.0 2.7 0.5 20.9 1.9 12.1 1.0
2012 9.0 1.9 2.9 0.0 9.2 1.9 2.4 1.9 24.4 2.4 14.1 2.4
2011 9.4 2.9 1.8 0.5 10.2 2.9 3.5 2.4 21.0 2.9 14.6 2.9
2010 8.3 2.4 3.4 0.5 8.5 2.4 2.6 0.0 20.4 3.4 13.4 3.9
2009 6.8 2.3 2.1 0.5 6.8 2.3 1.9 1.8 15.5 4.6 11.1 2.3
2008 9.9 3.3 4.6 1.4 10.9 3.8 2.0 0.5 25.1 9.5 15.6 5.7
2007 8.8 2.9 1.6 1.0 9.7 2.9 1.9 0.5 21.8 7.4 14.9 5.4
2006 9.7 1.0 2.8 0.5 10.5 1.0 2.1 0.5 21.8 1.5 15.6 1.0
2005 9.2 4.0 3.8 2.0 9.8 4.5 2.3 2.0 26.6 16.5 16.6 6.5
2004 8.6 0.5 2.8 0.0 8.9 0.5 1.9 0.0 23.9 0.5 13.8 0.5
2003 6.0 1.0 1.1 0.0 6.2 1.0 2.0 0.0 18.1 1.5 9.4 1.5
2002 4.6 0.5 1.7 0.5 4.8 0.5 0.9 0.0 10.8 1.0 7.0 1.0
2001 6.6 3.1 2.2 2.6 7.1 3.1 2.0 1.6 16.9 5.7 9.5 3.6
2000 5.0 1.6 1.4 1.6 5.0 2.1 1.3 0.0 13.4 6.9 8.1 4.2
1999 6.5 2.9 2.0 1.1 7.0 3.4 2.0 0.0 16.8 8.6 10.3 5.1
1998 7.2 0.0 2.3 0.0 7.8 0.0 1.5 0.0 18.8 0.0 10.7 0.0
1997 6.6 0.0 2.7 0.0 7.1 0.0 1.6 0.0 16.9 0.0 10.6 0.0
1996 7.1 0.0 1.7 0.0 7.8 0.0 2.7 0.0 22.7 0.0 12.3 0.0
1995 6.3 0.6 1.3 0.0 6.8 0.6 2.4 0.0 22.9 2.3 9.2 1.7
1994 5.6 0.6 1.9 0.6 6.2 0.6 2.1 0.0 15.1 2.3 9.2 1.1
1993 6.8 0.0 2.5 0.0 7.0 0.0 1.9 0.0 19.5 0.0 10.9 0.0
1992 5.8 0.0 1.9 0.0 6.3 0.0 1.7 0.0 18.2 0.0 9.7 0.0
1991 5.4 0.0 3.0 0.0 6.1 0.0 1.4 0.0 15.6 0.0 8.4 0.0
1990 7.4 0.0 3.5 0.0 8.6 0.0 0.0 0.0 22.4 0.0 11.7 0.0
1989 6.3 0.0 3.0 0.0 6.8 0.0 0.0 0.0 20.9 0.0 11.9 0.0
1988 6.1 0.0 3.5 0.0 7.6 0.0 0.0 0.0 16.0 0.0 10.2 0.0
1987 7.8 0.0 3.8 0.0 7.9 0.0 0.0 0.0 19.1 0.0 11.7 0.0
1986 7.5 0.0 4.2 0.0 8.0 0.0 0.0 0.0 20.6 0.0 12.0 0.0
1985 10.1 0.0 3.7 0.0 11.0 0.0 0.0 0.0 27.8 0.0 16.0 0.0
1984 11.9 0.0 3.3 0.0 12.8 0.0 0.0 0.0 30.7 0.0 17.2 0.0
1983 6.5 0.0 1.6 0.0 7.0 0.0 0.0 0.0 18.1 0.0 10.1 0.0
1982 7.6 0.0 2.9 0.0 8.2 0.0 0.0 0.0 18.7 0.0 11.9 0.0
1981 12.7 0.0 4.6 0.0 14.2 0.0 0.0 0.0 28.2 0.0 17.2 0.0
1980 13.0 0.0 3.7 0.0 14.6 0.0 0.0 0.0 31.1 0.0 18.7 0.0
1979 15.1 0.0 2.7 0.0 16.8 0.0 0.0 0.0 34.1 0.0 19.5 0.0
1978 13.1 0.0 4.4 0.0 14.7 0.0 0.0 0.0 34.4 0.0 20.9 0.0
1977 12.1 3.1 2.7 1.9 14.0 3.1 0.0 0.0 30.8 6.9 16.2 3.8
1976 10.6 0.0 0.3 0.0 11.9 0.0 0.0 0.0 29.7 0.0 15.5 0.0
1975 10.6 0.0 0.3 0.0 11.9 0.0 0.0 0.0 29.7 0.0 15.5 0.0

Fatal vehicle accidents
Type Total countDrunkFatal countPedestrian countPerson countVehicle count
Year IndianapolisArlingtonIndianapolisArlingtonIndianapolisArlingtonIndianapolisArlingtonIndianapolisArlingtonIndianapolisArlington
1975 78 0 2 0 87 0 0 0 218 0 114 0
1976 78 0 2 0 87 0 0 0 218 0 114 0
1977 89 5 20 3 103 5 0 0 226 11 119 6
1978 96 0 32 0 108 0 0 0 252 0 153 0
1979 111 0 20 0 123 0 0 0 250 0 143 0
1980 95 0 27 0 107 0 0 0 228 0 137 0
1981 93 0 34 0 104 0 0 0 207 0 126 0
1982 56 0 21 0 60 0 0 0 137 0 87 0
1983 48 0 12 0 51 0 0 0 133 0 74 0
1984 87 0 24 0 94 0 0 0 225 0 126 0
1985 74 0 27 0 81 0 0 0 204 0 117 0
1986 55 0 31 0 59 0 0 0 151 0 88 0
1987 57 0 28 0 58 0 0 0 140 0 86 0
1988 45 0 26 0 56 0 0 0 117 0 75 0
1989 46 0 22 0 50 0 0 0 153 0 87 0
1990 54 0 26 0 63 0 0 0 164 0 86 0
1991 40 0 22 0 45 0 10 0 115 0 62 0
1992 43 0 14 0 47 0 13 0 135 0 72 0
1993 51 0 19 0 52 0 14 0 145 0 81 0
1994 42 1 14 1 46 1 16 0 113 4 69 2
1995 47 1 10 0 51 1 18 0 171 4 69 3
1996 53 0 13 0 58 0 20 0 169 0 92 0
1997 49 0 20 0 53 0 12 0 126 0 79 0
1998 53 0 17 0 58 0 11 0 139 0 79 0
1999 48 5 15 2 52 6 15 0 124 15 76 9
2000 39 3 11 3 39 4 10 0 105 13 63 8
2001 52 6 17 5 56 6 16 3 133 11 75 7
2002 36 1 13 1 38 1 7 0 85 2 55 2
2003 47 2 9 0 49 2 16 0 142 3 74 3
2004 68 1 22 0 70 1 15 0 188 1 109 1
2005 73 8 30 4 77 9 18 4 210 33 131 13
2006 77 2 22 1 83 2 17 1 173 3 124 2
2007 70 6 13 2 77 6 15 1 174 15 119 11
2008 79 7 37 3 87 8 16 1 201 20 125 12
2009 55 5 17 1 55 5 15 4 125 10 90 5
2010 68 5 28 1 70 5 21 0 167 7 110 8
2011 78 6 15 1 84 6 29 5 174 6 121 6
2012 75 4 24 0 77 4 20 4 204 5 118 5
2013 69 2 14 1 77 2 23 1 176 4 102 2
2014 78 5 6 2 83 5 23 2 172 6 128 7
2015 86 5 12 1 95 5 33 1 201 8 135 8
2016 94 1 25 0 100 1 29 0 209 1 150 1
2017 92 5 16 1 96 5 34 2 201 8 136 6
2018 97 2 22 2 104 2 33 1 206 4 157 3
2019 98 6 25 1 102 6 26 4 221 7 170 7
2020 126 5 33 2 136 6 49 2 286 7 202 7
2021 140 7 0 0 148 7 40 1 317 16 239 11
Place of birth - Foreign born
Residents IndianapolisArlington
All residents 10.9% 22.1%
American Indian / Alaska Native residents 30.3% 55.7%
Asian residents 70.7% 62.3%
Black or African American residents 10.0% 27.2%
Native Hawaiian / Pacific Islander residents 31.3% 7.2%
Other race residents 43.1% 63.1%
Two or more races residents 13.3% 24.2%
White residents 2.8% 9.1%
White alone, not Hispanic / Latino residents 1.7% 8.7%
Place of birth - Native, outside of US
Residents IndianapolisArlington
All residents 1.0% 3.2%
American Indian / Alaska Native residents 0.0% 3.3%
Asian residents 0.1% 2.0%
Black or African American residents 1.1% 2.8%
Native Hawaiian / Pacific Islander residents 22.2% 17.2%
Other race residents 3.6% 3.8%
Two or more races residents 1.8% 5.6%
White residents 0.7% 2.9%
White alone, not Hispanic / Latino residents 0.5% 2.3%
Place of birth - Born in state of residence
Residents IndianapolisArlington
All residents 65.4% 22.4%
American Indian / Alaska Native residents 48.6% 11.2%
Asian residents 20.2% 13.3%
Black or African American residents 66.7% 27.1%
Native Hawaiian / Pacific Islander residents 29.8% 8.7%
Other race residents 37.3% 20.1%
Two or more races residents 64.4% 27.7%
White residents 71.1% 22.5%
White alone, not Hispanic / Latino residents 72.0% 21.6%
Place of birth - Born in other state
Residents IndianapolisArlington
All residents 22.7% 52.4%
American Indian / Alaska Native residents 21.1% 29.8%
Asian residents 9.0% 22.4%
Black or African American residents 22.2% 42.9%
Native Hawaiian / Pacific Islander residents 16.7% 67.0%
Other race residents 16.1% 13.0%
Two or more races residents 20.4% 42.4%
White residents 25.5% 65.5%
White alone, not Hispanic / Latino residents 25.8% 67.4%
English speakers (speaking English at home)
Type Indianapolis Arlington
Born in the United States residents 92.5% 90.6%
Foreign born residents 18.2% 18%
Native, born elsewhere residents 55.3% 63.5%
Total residents 85.6% 71.1%
Mechanisms of homicide
Mechanism IndianapolisArlington
Homicides from 2000 to 2006 813 37
Cut / Pierce 23 0
Firearm 585 0
Struck by / against 45 0
Suffocation 47 0
Mechanisms of homicide per 1,000,000 residents
Mechanism IndianapolisArlington
Homicides from 2000 to 2006 134.0 26.9
Cut / Pierce 3.8 0
Firearm 96.4 0
Struck by / against 7.4 0
Suffocation 7.7 0
Mechanisms of suicide per 1,000,000 residents
Mechanism IndianapolisArlington
Suicides from 2000 to 2006 120.8 84.5
Firearm 67.8 35.0
Poisoning 20.3 0
Suffocation 25.7 18.9

Infrastructure

Indianapolis is known for its efficient road network, orienting towards the city center. It boasts an international airport and ample taxi services. On the other hand, Arlington's infrastructure is impressive with its high-speed Metrorail system, multiple bus services, biking trails, and proximity to major airports.
Infrastructure
Type Indianapolis Arlington
Hospitals 76 6
TV stations 19 25
Bank branches located here 259 82
Bank institutions located here 27 25
Main business address for public companies 28 17
Drinking water stations with no reported violations in the past 1 0
Drinking water stations with reported violations in the past 19 3

Schools

School facilities
Type Indianapolis Arlington
Private elementary/middle schools 50 7
Private high schools 25 2
Public elementary/middle schools 171 27
Public high schools 55 4
Colleges/Universities 39 14
HMDA - Conventional home purchase loans - Applications denied
Year IndianapolisArlington
1999 3,358 226
2000 3,562 196
2001 2,649 164
2002 1,915 146
2003 2,519 288
2004 3,702 461
2005 6,057 589
2006 5,811 563
2007 3,456 412
2008 1,247 272
2009 565 173

Culture and Food

Indianapolis is known for its burgeoning food scene, with a focus on farm-to-table dining, and its love for racing, evident in the iconic Indianapolis 500. Arlington offers a melting pot of cuisines, reflecting its diverse community. It's known for its historical sites and its urban village community design.

Sports Teams

Sports fans in Indianapolis enjoy watching the Indianapolis Colts (NFL), Indiana Pacers (NBA), and Indy Eleven (USL). Arlington, while not having its teams, is close to Washington, D.C., allowing access to teams like the Washington Football Team (NFL), Washington Nationals (MLB), and Washington Capitals (NHL).