This comparison between life in Indianapolis, Indiana, and Knoxville, Tennessee offers a comprehensive dive into the essential factors to consider when looking to relocate or visit either city. Factors such as crime and safety, weather, cost of living, education, work and economy, infrastructure, employers, real estate, commuting, taxes, culture, sports, geographical conditions, and healthcare are all painstakingly analyzed. Truly, the essence of each city is captured, to bring potential movers and visitors one step closer to making their choice.
Distance between
Indianapolis, IN and
Knoxville, TN : 289.9 miles
Indianapolis's population is larger by 358%. Its population has grown by 100,169 people (12.8%) since 2000. The population of Knoxville has grown by 18,758 people (10.8%) during that time.
Comparatively, Knoxville is slightly safer than Indianapolis. However, both cities have higher crime rates than the national average. It's important to keep in mind that crime rates can significantly vary from neighborhood to neighborhood in both cities. Overall, both cities have been investing more in their police departments to improve public safety.
City-data.com crime index counts serious crimes and violent crime more heavily. It adjusts for the number of visitors and daily workers commuting into cities. (higher means more crime, U.S. average = 301.1)
City-data.com crime index counts serious crimes and violent crime more heavily. It adjusts for the number of visitors and daily workers commuting into cities. (higher means more crime, U.S. average = 301.1)
Sex Offenders
According to our data, there are 81 registered sex offenders living in Indianapolis and 610 registered sex offenders living in . The ratio of residents to sex offenders in Indianapolis is 10,525 to 1; the ratio in Knoxville is 305 to 1. The number of registered sex offenders compared to the number of residents is a lot smaller in Indianapolis than in Knoxville.
Cost of Living
At a glance, the cost of living in Knoxville is somewhat lower than in Indianapolis, primarily due to differences in housing costs. Food, clothing, transportation, personal care, and entertainment costs are roughly similar in both cities, making Knoxville an attractive option for families and individuals searching for a more affordable lifestyle.
Income Tax
Indiana imposes a flat state income tax rate of 3.23% with additional county taxes that can push the total to about 5%, whereas, Tennessee does not charge any state or city income tax.
Property Tax
Indiana's averaged property tax rate is lower than Tennessee's. Indianapolis sits at about 0.85%, while Knoxville averages around 0.94%. These rates can vary depending on exact location and the appraised value of one's property.
Sales Tax
Indiana has a flat state sales tax of 7%, applicable statewide, including Indianapolis. Tennessee's sales tax is 7%, but with Knoxville's additional 2.25% city sales tax, the total is 9.25%.
Income
Type
Indianapolis
Knoxville
Estimated median household income
$58,479
$45,700
Estimated per capita income
$32,792
$31,855
Cost of living index (U.S. average is 100)
87.7
86.5
If you make $50,000 in Knoxville, you will have to make $50,694 in Indianapolis to maintain the same standard of living.
Geographical Conditions
Indianapolis is characterised by flatlands. In contrast, Knoxville displays diverse geography with the surrounding Great Smoky Mountains and Tennessee River, offering beautiful natural settings and outdoor recreational activities.
Both cities have excellent educational opportunities. Indianapolis is home to three significant universities: Indiana University-Purdue University, Butler University, and the University of Indianapolis. Meanwhile, Knoxville houses the University of Tennessee, one of the oldest public universities in the country. Both cities also have numerous public and private schools for K-12 education.
Indianapolis boosts a diverse economy with significant sectors in healthcare, education, finance, and tourism. Conversely, Knoxville's economy leans more towards the retail, health care, and educational sectors. Both cities provide ample opportunities for employment and business.
Biggest Employers
In Indianapolis, the biggest employers include Community Health Network, St. Vincent Health, and Indiana University Health. Knoxville's largest employers are the University of Tennessee, the US Department of Energy, and Covenant Health.
There were 1,221 building permits issued in Indianapolis in 2012 (704 more than in 2011) compared to 261 building permits issued in Knoxville in 2012 (94 more than in 2011).
In Indianapolis (Marion County), 60.1% voted for Democrats and 37.9% for Republicans in 2012 Presidential Election. In Knoxville (Knox County), 34.5% voted for Democrats and 63.7% for Republicans.
Elections
Type
Democrats
Republicans
Other
Year
Indianapolis
Knoxville
Indianapolis
Knoxville
Indianapolis
Knoxville
2020
63.7%
41.8%
34.5%
56.9%
1.9%
1.3%
2016
58.2%
34.9%
35.6%
58.8%
6.2%
6.3%
2012
60.1%
34.5%
37.9%
63.7%
2.0%
1.8%
2008
63.8%
37.8%
35.4%
60.9%
0.8%
1.3%
2004
50.6%
37.0%
48.7%
62.1%
0.7%
0.9%
2000
48.0%
40.6%
49.3%
57.9%
2.8%
1.5%
1996
44.6%
22.6%
47.8%
74.4%
7.7%
3.0%
Breakdown of population affiliated with a religious congregation
Type
Adherents
Congregations
Religion
Indianapolis
Knoxville
Indianapolis
Knoxville
CATHOLIC CHURCH
11.1%
5.1%
4.6%
1.3%
SOUTHERN BAPTIST CONVENTION
1.6%
29.7%
5.7%
32.9%
AMERICAN BAPTIST CHURCHES IN THE USA
1.2%
0.1%
3.4%
0.2%
LUTHERAN CHURCH
0.8%
0.4%
1.5%
0.5%
EVANGELICAL LUTHERAN CHURCH IN AMERICA
0.5%
0.5%
1.6%
0.9%
SEVENTH DAY ADVENTIST CHURCH
0.5%
0.3%
1.6%
1.3%
EPISCOPAL CHURCH
0.4%
1.0%
1.1%
1.4%
EVANGELICAL PRESBYTERIAN CHURCH
0.2%
1.0%
0.2%
0.5%
PRESBYTERIAN CHURCH IN AMERICA
0.1%
0.4%
0.5%
0.7%
CUMBERLAND PRESBYTERIAN CHURCH
0.0%
0.5%
0.1%
1.3%
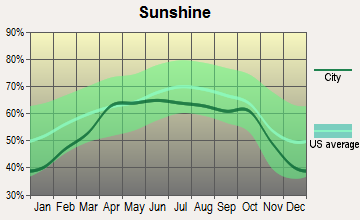
Weather
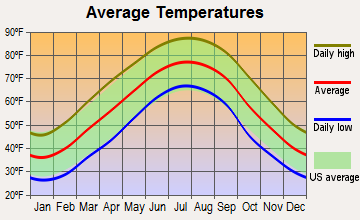
The weather of these two cities welcomes residents and visitors with different appeals. Indianapolis offers a humid continental climate, translating to freezing winters, hot and often humid summers, and delightful springs and autumns. Meanwhile, Knoxville, with its humid subtropical climate, provides milder winters and sweltering, humid summers but very colorful autumns.
Weather and climate
Type
Indianapolis
Knoxville
Temperature - Average
52.1°F
57.4°F
Humidity - Average morning or afternoon humidity
77%
76.7%
Humidity - Differences between morning and afternoon humidity
31%
39%
Humidity - Maximum monthly morning or afternoon humidity
86%
90%
Humidity - Minimum monthly morning or afternoon humidity
55%
51%
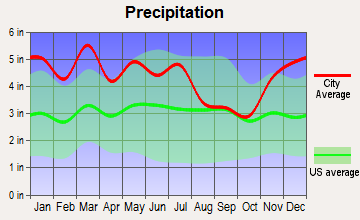
Precipitation - Yearly average
40.6 in
52.1 in
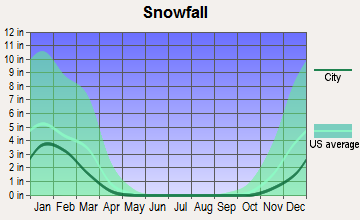
Snowfall - Yearly average
51 in
18 in
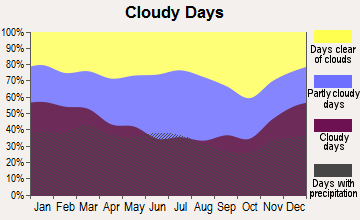
Clouds - Number of days clear of clouds
14.7%
16.8%
Sunshine amount - Average
56.2%
62.4%
Sunshine amount - Differences during a year
33%
26%
Sunshine amount - Maximum monthly
65%
67%
Sunshine amount - Minimum monthly
32%
41%
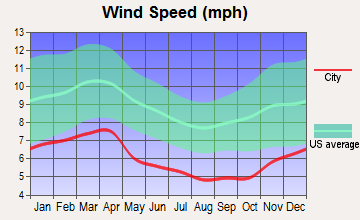
Wind speed - Average
10.3 mph
6.5 mph
Average climate in Indianapolis, Indiana
Average climate in Knoxville, Tennessee
Air pollution
Type
AQI
CO
NO2
OZONE
PB
PM10
PM25
SO2
Year
Indianapolis
Knoxville
Indianapolis
Knoxville
Indianapolis
Knoxville
Indianapolis
Knoxville
Indianapolis
Knoxville
Indianapolis
Knoxville
Indianapolis
Knoxville
Indianapolis
Knoxville
2018
94
71
0.58
0.17
13.2
0.6
23.1
28.8
N/A
N/A
18.2
17.0
10.4
9.4
0.3
0.6
2017
87
68
0.82
0.16
12.4
0.6
23.0
30.6
N/A
N/A
17.6
16.5
10.1
8.5
0.4
0.2
2016
91
71
0.62
0.18
13.0
0.8
22.5
32.7
N/A
N/A
18.0
19.1
9.9
N/A
0.4
0.5
2015
89
68
0.73
0.17
14.9
0.8
22.9
28.8
N/A
0.009
19.7
26.0
9.9
N/A
1.1
1.8
2014
100
62
0.62
0.14
16.1
N/A
25.1
29.2
N/A
0.011
20.6
23.7
12.1
N/A
3.2
1.6
2013
94
60
0.69
0.14
11.5
N/A
26.3
28.9
N/A
N/A
19.9
22.3
12.8
N/A
2.6
0.6
2012
103
92
0.65
0.16
10.4
N/A
25.7
32.1
N/A
N/A
20.8
24.9
12.9
N/A
2.9
0.4
2011
105
91
0.68
0.20
11.3
N/A
22.9
34.0
N/A
N/A
N/A
28.1
16.3
N/A
2.4
0.6
2010
101
94
0.54
0.18
12.7
0.9
21.6
32.3
N/A
N/A
N/A
29.2
15.9
N/A
3.3
0.9
2009
97
66
0.73
0.17
11.4
0.7
23.2
28.7
N/A
0.018
N/A
23.6
13.8
N/A
1.9
0.7
2008
91
96
0.62
0.18
11.5
N/A
N/A
33.2
0.010
0.023
N/A
32.5
13.2
N/A
3.0
1.5
2007
103
105
0.69
0.16
13.1
N/A
N/A
35.5
0.011
0.017
N/A
36.0
14.9
N/A
3.6
1.6
2006
95
98
0.59
N/A
14.5
N/A
N/A
30.2
0.009
0.024
N/A
36.3
14.5
N/A
3.6
2.3
2005
121
108
0.65
N/A
15.2
N/A
N/A
27.7
0.014
N/A
N/A
34.6
18.0
N/A
4.3
N/A
2004
104
103
0.62
N/A
15.8
N/A
N/A
24.9
0.010
0.015
N/A
41.2
15.1
N/A
4.6
N/A
2003
113
112
0.67
N/A
16.6
N/A
N/A
23.4
0.010
0.010
N/A
40.7
15.8
N/A
4.2
2.8
2002
125
112
0.76
N/A
17.4
N/A
N/A
28.3
0.009
N/A
N/A
35.1
16.8
N/A
3.9
3.4
2001
105
109
0.81
N/A
16.6
N/A
N/A
28.9
0.031
N/A
N/A
35.6
16.3
N/A
3.8
3.3
2000
98
122
0.87
N/A
17.3
11.8
N/A
25.2
N/A
N/A
N/A
34.2
N/A
N/A
4.5
2.5
Natural disasters
Type
Indianapolis
Knoxville
Tornado activity compared to U.S. average
226.7%
64.8%
Earthquake activity compared to U.S. average
179.6%
177.6%
Natural disasters compared to U.S. average
16%
13%
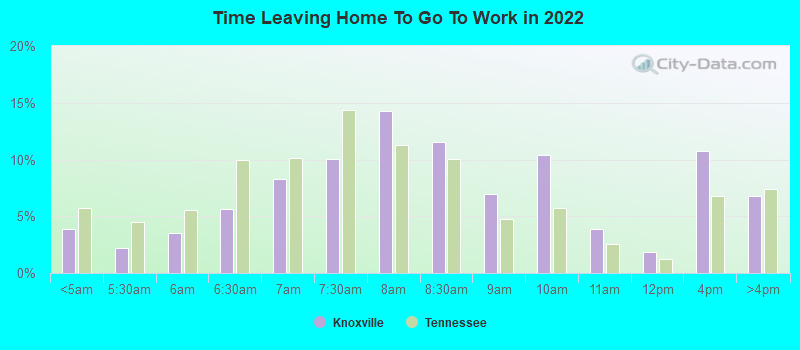
Transportation
Indianapolis residents benefit from the efficient and affordable Indigo bus system, while Knoxville has KAT (Knoxville Area Transit). However, both cities are considered car-dependent, with most residents opting to drive.
Transport
Type
Indianapolis
Knoxville
Amtrak stations
1
0
Amtrak stations nearby
1
0
FAA registered aircraft
739
366
FAA registered aircraft manufacturers and dealers
18
19
Means of transportation to work
Type
Indianapolis
Knoxville
Bicycle
0.5%
0%
Bus
1.2%
0.6%
Carpooled
8.5%
5.5%
Car alone
87.3%
91.4%
Walked
1.6%
1.5%
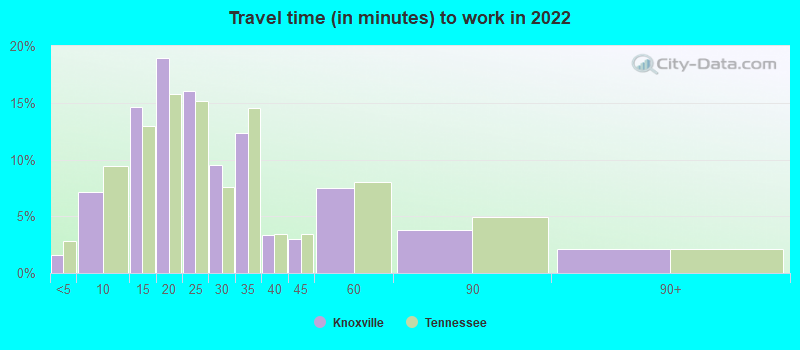
Average travel time to work
Type
Indianapolis
Knoxville
Average
28.1 min
26.5 min
Other means
22.5 min
20.9 min
Public transportation
40.2 min
33.4 min
Private vehicle occupancy
Type
Indianapolis
Knoxville
Average
1.2
1.1
Drove alone
88.2%
91.4%
In 2 person carpool
9.4%
6.8%
In 3 person carpool
1.3%
0.7%
In 4 person carpool
0.5%
0.5%
In 5-6 person carpool
0.4%
0.2%
In 7+ person carpool
0.1%
0%
How many people usually rode to work in the car, truck or van.
Real Estate
Indianapolis houses tend to be less expensive per square foot, but Knoxville homes often come with more land. Rental prices are generally comparable in both cities, although it can vary significantly based on location and property quality.
Neighborhoods
Indianapolis neighborhoods such as Broad Ripple and Fountain Square offer lively arts and music scenes. Over in Knoxville, areas like Old City and Market Square provide rich history and a wealth of entertainment options.
Houses and residents
Type
Indianapolis
Knoxville
Houses
399,820
94,457
Average household size (people)
2.4
2.2
Median year apartment built
1977
1978
Median year house/condo built
1971
1964
Length of stay in the house since moving in
13 years
13.2 years
Houses occupied
358,150 (89.6%)
85,151 (90.1%)
Houses occupied by owners
201,149 (56.2%)
40,535 (47.6%)
Houses occupied by renters
157,001 (43.8%)
44,616 (52.4%)
Median rent asked for vacant for-rent units
$876.58
$882.25
Median monthly housing costs
$980
$945
Median price asked for vacant for-sale houses and condos
$283,027
$134,979
Estimated median house or condo value
$188,700
$193,600
Median numbers of rooms
5.5
5
Median number of rooms in apartments
4.3
4.1
Median number of rooms in houses and condos
6.5
6.2
Median house price - detached houses
$231,490
$261,152
Median house price - in 2-unit structures
$257,253
$185,738
Median house price - in 3-to-4-unit structures
$240,688
$206,216
Median house price - in 5 or more unit structures
$247,275
$237,681
Median house price - mobile homes
$58,413
$92,571
Median house price - Townhouses or other attached units
$222,424
$225,200
Median house price - All housing units
$229,666
$256,619
Median house age
48
49
Renting percentage
44.2%
50.8%
Housing density (houses/condos per square mile)
1,106.1
1,019.4
House value disparities
36.1%
34.8%
Household income disparities
44.4%
47.9%
Median household income for houses/condes with a mortgage
$86,008
$76,198
Median household income for apartments without a mortgage
$61,922
$58,442
Housing units without a mortgage
4,552 (3.2%)
497 (1.9%)
Housing units with both a second mortgage and home equity loan
9,787 (6.8%)
1,206 (4.7%)
Housing units with a mortgage
138,622 (96.8%)
25,330 (98.1%)
Housing units with a home equity loan
271 (0.2%)
167 (0.6%)
Housing units with a second mortgage
12,987 (9.1%)
1,649 (6.4%)
House/condo owner moved in on average (years ago)
11
10
House/condo renter moved in on average (years ago)
1
1
Housing units lacking complete kitchen facilities
3.4%
2.6%
Housing units lacking complete plumbing facilities
1.1%
1.8%
Housing units in structures
Housing units in structures
Indianapolis
Knoxville
One, detached
59.0%
54.1%
One, attached
9.2%
5.2%
Two
2.5%
3.2%
3 or 4
6.2%
4.2%
5 to 9
7.7%
8.3%
10 to 19
6.3%
9.2%
20 to 49
3.1%
6.5%
50 or more
5.0%
8.7%
Mobile homes
1.0%
0.7%
Median real estate property taxes paid for housing units
Self-employed workers in own not incorporated business
17,131
6,351
State government workers
15,502
7,257
Unpaid family workers
1,601
197
Industries and Occupations
Indianapolis is known for its thriving healthcare and education sectors, with occupations in these areas very well-represented. It's also the second-largest FedEx Express hub globally. Meanwhile, Knoxville is a retail powerhouse led by large companies, such as Regal Cinemas and Pilot Flying J.
Both cities have excellent healthcare facilities. Indianapolis has some top-rated hospitals such as Indiana University Health and the Sidney & Lois Eskenazi Hospital. Knoxville also boasts notable hospitals like the University of Tennessee Medical Center and Fort Sanders Regional Medical Center.
Health (county statistics)
Type
Indianapolis
Knoxville
General health status score of residents in this county from 1 (poor) to 5 (excellent)
When it comes to infrastructure, Indianapolis provides more metropolitan vibes, boasting several highways, a light rail system, and a robust public transportation network. Knoxville, however, offers a smaller-scale, cozier feel with less traffic congestion and more accessible destinations.
Infrastructure
Type
Indianapolis
Knoxville
Hospitals
76
20
TV stations
19
15
Arenas or stadiums
3
2
Bank branches located here
259
152
Bank institutions located here
27
38
Main business address for public companies
28
6
Drinking water stations with no reported violations in the past
1
6
Drinking water stations with reported violations in the past
HMDA - Conventional home purchase loans - Applications denied
Year
Indianapolis
Knoxville
1999
3,358
1,372
2000
3,562
1,152
2001
2,649
886
2002
1,915
1,367
2003
2,519
1,014
2004
3,702
1,080
2005
6,057
1,218
2006
5,811
1,159
2007
3,456
701
2008
1,247
329
2009
565
222
Culture and Food
Indianapolis offers a rich cultural scene, including world-class art museums, theaters, and delicious culinary experiences like St. Elmo Steak House. Knoxville, on the other hand, boasts a thriving music scene, historical architecture, and Southern cuisine, including famous barbecue.
Sports Teams
Indianapolis is home to several professional sports teams, including the Colts (NFL) and Pacers (NBA), while Knoxville doesn't have any professional teams but hosts the University of Tennessee's Volunteers who have a significant following.


 Indianapolis, IN and
  Knoxville, TN : 289.9 miles