Portland, OR and Indianapolis, IN offer distinct lifestyles underpinned by their unique cultural, economic, and environmental circumstances. Broadly speaking, Portland has a reputation as a eco-friendly, progressive city known for its vibrant arts and food scenes, while Indianapolis provides a Midwest charm with low cost of living and robust sports culture. Both cities display their generous share of opportunities and challenges.
Distance between
Indianapolis, IN and
Portland, OR : 1,879.0 miles
Indianapolis's population is larger by 38%. Its population has grown by 100,169 people (12.8%) since 2000. The population of Portland has grown by 112,041 people (21.2%) during that time.
Portland has a slightly higher crime rate than the national average, compared to Indianapolis, which demonstrates significantly higher rates, especially for violent and property crimes. Both cities, however, are putting measures in place to address these issues. Portland deploys community-oriented public safety initiatives, while Indianapolis uses modern policing strategies that include hotspot and predictive policing.
City-data.com crime index counts serious crimes and violent crime more heavily. It adjusts for the number of visitors and daily workers commuting into cities. (higher means more crime, U.S. average = 301.1)
City-data.com crime index counts serious crimes and violent crime more heavily. It adjusts for the number of visitors and daily workers commuting into cities. (higher means more crime, U.S. average = 301.1)
Sex Offenders
According to our data, there are 82 registered sex offenders living in Indianapolis and 374 registered sex offenders living in . The ratio of residents to sex offenders in Indianapolis is 10,396 to 1; the ratio in Portland is 1,710 to 1. The number of registered sex offenders compared to the number of residents is a lot smaller in Indianapolis than in Portland.
Cost of Living
Indianapolis is a city with a lower cost of living than Portland. Housing, in particular, is quite affordable in Indianapolis. While Portland's cost of living is higher than the national average, its rich natural environment, vibrant arts and food scene may justify the higher cost for some.
Income Tax
Both states have a graduated income tax. Oregon’s top marginal income tax rate of 9.9% is one of the highest in the U.S. In contrast, Indiana provides a flat rate of 3.23%.
Property Tax
Indiana has a lower property tax rate than Oregon, providing a more reasonable environment for homeowners in Indianapolis. Oregon's property taxes, while not the highest by nationwide standards, are nevertheless substantial.
Sales Tax
Oregon is one of five states that do not have a sales tax, making Portland an appealing city for shoppers. Meanwhile, Indianapolis residents and visitors experience a 7% sales tax.
Income
Type
Indianapolis
Portland
Estimated median household income
$58,479
$79,057
Estimated per capita income
$32,792
$49,003
Cost of living index (U.S. average is 100)
87.7
106.5
If you make $50,000 in Indianapolis, you will have to make $60,718 in Portland to maintain the same standard of living.
Geographical Conditions
Portland's landscape is influenced by the Pacific Ocean and Cascade Mountain Range, making it ideal for outdoor activities from surfing to skiing. Indianapolis is primarily flat with some small rivers and creeks, ideal for boating and fishing.
Both cities provide quality education with each having well-ranked schools and universities. Portland offers superior educational options with more top-rated schools, while Indianapolis continues to improve its education system through reform initiatives.
While both cities have diverse economies, Indianapolis has a strong manufacturing sector and is home to the second largest FedEx hub in the world. Portland, in contrast, specializes in high-tech industry and is home to companies like Nike and Intel. Portland’s tech boom has often been compared to Silicon Valley, offering high-paying tech jobs.
Biggest Employers
In Indianapolis, some of the biggest employers include Anthem Inc., Indiana University Health, and St. Vincent. In contrast, Portland's major employers include Intel, Providence Health & Services, and Nike, reflecting the city's more high-tech orientation.
There were 1,221 building permits issued in Indianapolis in 2012 (704 more than in 2011) compared to 474 building permits issued in Portland in 2012 (23 more than in 2011).
In Indianapolis (Marion County), 60.1% voted for Democrats and 37.9% for Republicans in 2012 Presidential Election. In Portland (Multnomah County), 75.4% voted for Democrats and 20.6% for Republicans.
Elections
Type
Democrats
Republicans
Other
Year
Indianapolis
Portland
Indianapolis
Portland
Indianapolis
Portland
2020
63.7%
79.2%
34.5%
17.9%
1.9%
2.9%
2016
58.2%
73.3%
35.6%
17.0%
6.2%
9.7%
2012
60.1%
75.4%
37.9%
20.6%
2.0%
4.0%
2008
63.8%
76.7%
35.4%
20.6%
0.8%
2.7%
2004
50.6%
71.6%
48.7%
27.1%
0.7%
1.3%
2000
48.0%
63.8%
49.3%
28.3%
2.8%
7.9%
1996
44.6%
59.2%
47.8%
26.3%
7.7%
14.4%
Breakdown of population affiliated with a religious congregation
Type
Adherents
Congregations
Religion
Indianapolis
Portland
Indianapolis
Portland
CATHOLIC CHURCH
11.1%
15.2%
4.6%
6.7%
SOUTHERN BAPTIST CONVENTION
1.6%
0.5%
5.7%
3.8%
AMERICAN BAPTIST CHURCHES IN THE USA
1.2%
0.8%
3.4%
2.7%
LUTHERAN CHURCH
0.8%
0.4%
1.5%
2.2%
EVANGELICAL LUTHERAN CHURCH IN AMERICA
0.5%
0.9%
1.6%
4.0%
SEVENTH DAY ADVENTIST CHURCH
0.5%
0.9%
1.6%
3.4%
EPISCOPAL CHURCH
0.4%
0.7%
1.1%
2.2%
Weather
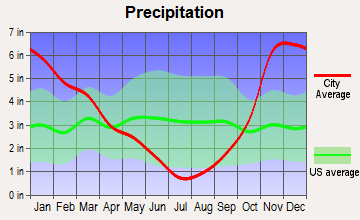
The weather in these two cities shows considerable contrast. Portland experiences a more moderate climate with rainy winters and dry, warm summers. Indianapolis, on the other hand, experiences more pronounced seasonality – hot, humid summers, and cold, snowy winters. This weather diversity may be tourist-friendly in Indianapolis, offering a variety of seasonal activities.
Weather and climate
Type
Indianapolis
Portland
Temperature - Average
52.1°F
53.9°F
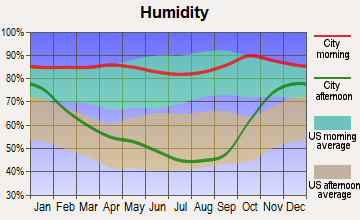
Humidity - Average morning or afternoon humidity
77%
76.5%
Humidity - Differences between morning and afternoon humidity
31%
42%
Humidity - Maximum monthly morning or afternoon humidity
86%
86%
Humidity - Minimum monthly morning or afternoon humidity
55%
44%
Precipitation - Yearly average
40.6 in
41.6 in
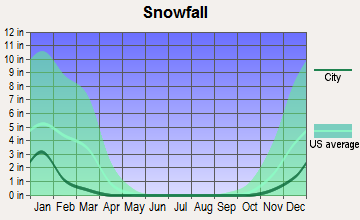
Snowfall - Yearly average
51 in
12.8 in
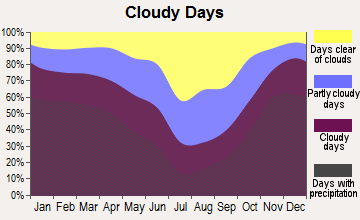
Clouds - Number of days clear of clouds
14.7%
11.3%
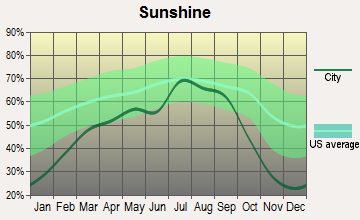
Sunshine amount - Average
56.2%
54.7%
Sunshine amount - Differences during a year
33%
52%
Sunshine amount - Maximum monthly
65%
72%
Sunshine amount - Minimum monthly
32%
20%
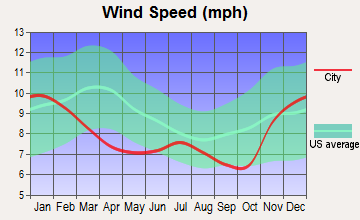
Wind speed - Average
10.3 mph
8.1 mph
Average climate in Indianapolis, Indiana
Average climate in Portland, Oregon
Air pollution
Type
AQI
CO
NO2
OZONE
PB
PM10
PM25
SO2
Year
Indianapolis
Portland
Indianapolis
Portland
Indianapolis
Portland
Indianapolis
Portland
Indianapolis
Portland
Indianapolis
Indianapolis
Portland
Indianapolis
Portland
2018
94
79
0.58
0.26
13.2
8.8
23.1
21.4
N/A
N/A
18.2
N/A
10.4
7.2
0.3
0.4
2017
87
93
0.82
0.26
12.4
8.7
23.0
22.6
N/A
N/A
17.6
N/A
10.1
7.1
0.4
0.4
2016
91
72
0.62
0.25
13.0
8.7
22.5
20.8
N/A
N/A
18.0
N/A
9.9
5.2
0.4
0.2
2015
89
91
0.73
0.28
14.9
9.2
22.9
20.1
N/A
N/A
19.7
N/A
9.9
7.4
1.1
0.5
2014
100
91
0.62
0.24
16.1
8.5
25.1
21.0
N/A
N/A
20.6
N/A
12.1
6.3
3.2
0.8
2013
94
85
0.69
0.29
11.5
9.6
26.3
17.9
N/A
N/A
19.9
N/A
12.8
8.6
2.6
1.1
2012
103
78
0.65
0.30
10.4
9.1
25.7
21.0
N/A
N/A
20.8
N/A
12.9
7.4
2.9
0.6
2011
105
89
0.68
0.34
11.3
9.4
22.9
18.5
N/A
N/A
N/A
N/A
16.3
8.1
2.4
0.8
2010
101
80
0.54
0.33
12.7
9.1
21.6
19.4
N/A
N/A
N/A
N/A
15.9
6.4
3.3
1.4
2009
97
95
0.73
0.32
11.4
10.2
23.2
20.0
N/A
N/A
N/A
N/A
13.8
8.4
1.9
1.6
2008
91
101
0.62
0.34
11.5
10.9
N/A
19.2
0.010
N/A
N/A
N/A
13.2
8.8
3.0
1.0
2007
103
101
0.69
0.35
13.1
11.4
N/A
18.1
0.011
N/A
N/A
N/A
14.9
8.8
3.6
1.3
2006
95
106
0.59
N/A
14.5
N/A
N/A
N/A
0.009
N/A
N/A
N/A
14.5
7.8
3.6
1.5
2005
121
96
0.65
N/A
15.2
N/A
N/A
N/A
0.014
N/A
N/A
N/A
18.0
8.9
4.3
1.7
2004
104
92
0.62
N/A
15.8
N/A
N/A
N/A
0.010
N/A
N/A
N/A
15.1
9.8
4.6
N/A
2003
113
77
0.67
N/A
16.6
N/A
N/A
N/A
0.010
0.008
N/A
N/A
15.8
8.6
4.2
N/A
2002
125
68
0.76
N/A
17.4
N/A
N/A
N/A
0.009
0.010
N/A
N/A
16.8
8.4
3.9
N/A
2001
105
73
0.81
N/A
16.6
N/A
N/A
N/A
0.031
0.008
N/A
N/A
16.3
8.9
3.8
N/A
2000
98
52
0.87
N/A
17.3
N/A
N/A
N/A
N/A
N/A
N/A
N/A
N/A
N/A
4.5
N/A
Natural disasters
Type
Indianapolis
Portland
Tornado activity compared to U.S. average
226.7%
8.4%
Earthquake activity compared to U.S. average
179.6%
1,575.5%
Natural disasters compared to U.S. average
16%
9%
Transportation
Both cities are making strides in improving their transit systems. Indianapolis has recently introduced new bus routes and dedicated lanes, while Portland is recognized nationally for its bike lanes, light rail, and streetcar system - a definite boon to tourists and residents alike.
Transport
Type
Indianapolis
Portland
Amtrak stations
1
1
Amtrak stations nearby
1
3
FAA registered aircraft
739
804
FAA registered aircraft manufacturers and dealers
18
6
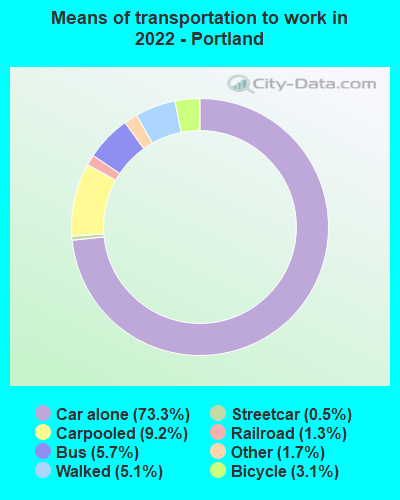
Means of transportation to work
Type
Indianapolis
Portland
Bicycle
0.5%
3.1%
Bus
1.2%
4.6%
Carpooled
8.5%
9.4%
Car alone
87.3%
76.2%
Motorcycle
0%
0.2%
Railroad
0%
0.9%
Streetcar
0%
0.3%
Walked
1.6%
3.8%
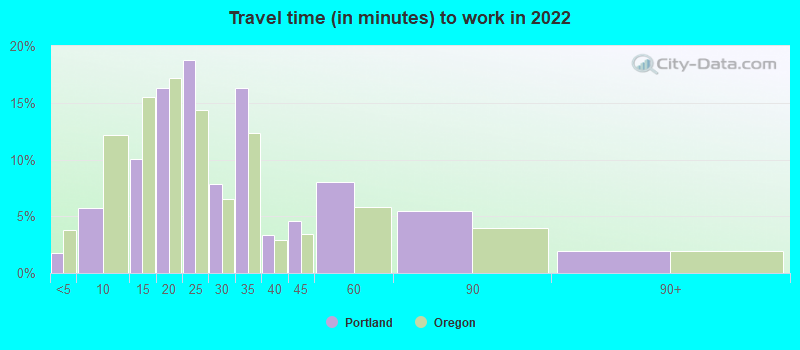
Average travel time to work
Type
Indianapolis
Portland
Average
28.1 min
28.8 min
Other means
22.5 min
21.8 min
Public transportation
40.2 min
38.2 min
Private vehicle occupancy
Type
Indianapolis
Portland
Average
1.2
1.2
Drove alone
88.2%
88.2%
In 2 person carpool
9.4%
8.4%
In 3 person carpool
1.3%
1.6%
In 4 person carpool
0.5%
0.8%
In 5-6 person carpool
0.4%
0.6%
In 7+ person carpool
0.1%
0.4%
How many people usually rode to work in the car, truck or van.
Real Estate
Indianapolis real estate market is designed for affordability. It’s accessible to first-time homebuyers and attracts real estate investors looking for rental properties. Portland's real estate market is hotter, with higher home values but also greater appreciation rates.
Neighborhoods
Indianapolis features a kaleidoscope of neighborhoods, from the up-and-coming Fountain Square to the family-friendly Broad Ripple. Portland is known for its quirky, diverse neighborhoods like Pearl District and Hawthorne, each possessing its unique character and charm.
Houses and residents
Type
Indianapolis
Portland
Houses
399,820
303,483
Average household size (people)
2.4
2.3
Median year apartment built
1977
1976
Median year house/condo built
1971
1954
Length of stay in the house since moving in
13 years
12.1 years
Houses occupied
358,150 (89.6%)
286,734 (94.5%)
Houses occupied by owners
201,149 (56.2%)
153,121 (53.4%)
Houses occupied by renters
157,001 (43.8%)
133,613 (46.6%)
Median rent asked for vacant for-rent units
$876.58
$1,917
Median monthly housing costs
$980
$1,535
Median price asked for vacant for-sale houses and condos
$283,027
$248,225
Estimated median house or condo value
$188,700
$520,200
Median numbers of rooms
5.5
4.8
Median number of rooms in apartments
4.3
3.4
Median number of rooms in houses and condos
6.5
6.2
Median house price - detached houses
$231,490
$568,464
Median house price - in 2-unit structures
$257,253
$576,814
Median house price - in 3-to-4-unit structures
$240,688
$426,181
Median house price - in 5 or more unit structures
$247,275
$466,898
Median house price - mobile homes
$58,413
$136,996
Median house price - Townhouses or other attached units
$222,424
$416,951
Median house price - All housing units
$229,666
$544,799
Median house age
48
56
Renting percentage
44.2%
46.3%
Housing density (houses/condos per square mile)
1,106.1
2,259.4
House value disparities
36.1%
23.1%
Household income disparities
44.4%
44.7%
Median household income for houses/condes with a mortgage
$86,008
$122,948
Median household income for apartments without a mortgage
$61,922
$72,663
Housing units without a mortgage
4,552 (3.2%)
2,404 (2.2%)
Housing units with both a second mortgage and home equity loan
9,787 (6.8%)
11,239 (10.1%)
Housing units with a mortgage
138,622 (96.8%)
108,864 (97.8%)
Housing units with a home equity loan
271 (0.2%)
396 (0.4%)
Housing units with a second mortgage
12,987 (9.1%)
12,832 (11.5%)
House/condo owner moved in on average (years ago)
11
9
House/condo renter moved in on average (years ago)
1
1
Housing units lacking complete kitchen facilities
3.4%
1.2%
Housing units lacking complete plumbing facilities
1.1%
0.9%
Housing units in structures
Housing units in structures
Indianapolis
Portland
One, detached
59.0%
53.3%
One, attached
9.2%
5.7%
Two
2.5%
3.5%
3 or 4
6.2%
4.5%
5 to 9
7.7%
4.0%
10 to 19
6.3%
4.7%
20 to 49
3.1%
6.6%
50 or more
5.0%
16.2%
Mobile homes
1.0%
1.2%
Boats, RVs, vans, etc.
0.0%
0.3%
Median real estate property taxes paid for housing units
Self-employed workers in own not incorporated business
17,131
25,437
State government workers
15,502
15,615
Unpaid family workers
1,601
688
Industries and Occupations
Industries in Indianapolis are led by manufacturing, health care, and retail, while Portland's economy is steered by manufacturing, software, health care, and education services. Both cities offer robust job markets, although Portland stands out for its strong startup scene.
Both cities boast excellent healthcare services. Indianapolis has a world-class medical industry led by IU Health and renowned specialty clinics. Portland provides top-rated medical care, especially in cancer treatment and specialized care for children.
Health (county statistics)
Type
Indianapolis
Portland
General health status score of residents in this county from 1 (poor) to 5 (excellent)
Indianapolis, designed around a wheel-and-spoke model, is known for its excellent road infrastructure. The city's transit system is ever improving, with new bus routes and dedicated lanes being introduced. Comparatively, Portland's robust infrastructure, including its well-regarded public transit system, Cycle tracks, and eco-friendly buildings, creates a pedestrian and biker's paradise.
Infrastructure
Type
Indianapolis
Portland
Hospitals
76
21
TV stations
19
18
Arenas or stadiums
3
3
Bank branches located here
259
208
Bank institutions located here
27
30
Main business address for public companies
28
32
Drinking water stations with no reported violations in the past
1
2
Drinking water stations with reported violations in the past
HMDA - Conventional home purchase loans - Applications denied
Year
Indianapolis
Portland
1999
3,358
1,922
2000
3,562
1,651
2001
2,649
1,193
2002
1,915
1,235
2003
2,519
1,844
2004
3,702
2,651
2005
6,057
3,396
2006
5,811
3,510
2007
3,456
3,008
2008
1,247
1,465
2009
565
712
Culture and Food
Both cities have vibrant food scenes. Portland is recognized for its foodie culture, boasting diverse cuisines and innovative chefs. Indianapolis also offers a growing food scene with an increasingly diverse range of culinary experiences. From food trucks to fine dining, both cities provide a treat to its residents and tourists.
Sports Teams
In the world of sports, Portland has the Trail Blazers (NBA) and Timbers (MLS). Indianapolis is famous for its Colts (NFL) and Pacers (NBA), and the city is synonymous with auto racing, hosting the Indy 500, the world's largest single-day sporting event.


 Indianapolis, IN and
  Portland, OR : 1,879.0 miles