Jacksonville, FL, and Arlington, TX, are two vibrant US cities offering diverse experiences in terms of lifestyle, climate, culture, and economy. Each city has its unique characteristics and attractions, adding a distinctive charm to their locales. The comparison below examines various aspects such as safety, climate, cost of living, education, economy, and more, thereby providing a comprehensive view for those considering relocation or just a visit to either of these cities.
Distance between
Jacksonville, FL and
Arlington, TX : 924.7 miles
Jacksonville's population is larger by 143%. Its population has grown by 218,997 people (29.8%) since 2000. The population of Arlington has grown by 59,817 people (18.0%) during that time.
Both Jacksonville and Arlington have crime rates slightly higher than the national average. However, Arlington is considered a bit safer than Jacksonville, with a lower violent crime rate. Both cities have been investing in public safety initiatives and community engagement programs to enhance safety in neighbourhoods. Tourists and residents are advised to take standard precautions typical to any major urban area.
Cost of Living
The cost of living in Jacksonville is slightly lower than the national average, largely due to its affordable housing. Arlington's cost of living is marginally higher than Jacksonville's, mainly because of higher healthcare and transportation costs. However, both cities offer a lower cost of living compared to many other major US cities.
Income Tax
Both Florida (including Jacksonville) and Texas (including Arlington) do not levy a state income tax. This lack of income tax can result in significant savings for residents, making both cities attractive for relocation.
Property Tax
Jacksonville has a lower property tax rate compared to Arlington. Residents in both cities could potentially save on property taxes as both Florida and Texas provide several exemptions and tax relief options for homeowners.
Sales Tax
Florida, including Jacksonville, does not impose a state income tax, an advantage for residents. The state sales tax rate is 6%, with Jacksonville adding a 1% local sales tax. Texas, including Arlington, also does not have a state income tax. Arlington's total sales tax rate is 8%, slightly higher than Jacksonville's.
Income
Type
Jacksonville
Arlington
Estimated median household income
$58,621
$59,889
Estimated per capita income
$32,953
$31,722
Cost of living index (U.S. average is 100)
88.3
95.9
If you make $50,000 in Jacksonville, you will have to make $54,304 in Arlington to maintain the same standard of living.
Geographical Conditions
Jacksonville finds itself in northeastern Florida, enjoying a coastal location with beautiful beaches and the St. Johns River. Arlington is centrally located in Texas, without direct access to coastlines or major water bodies but possessing a mix of plains and low hills.
Jacksonville's Duval County Public Schools is one of Florida's major school districts, offering various educational programs. The city is also home to several colleges and universities, including the University of North Florida. Arlington boasts a robust education landscape with acclaimed public schools in the Arlington Independent School District and noteworthy higher education institutions, including the University of Texas at Arlington.
Both cities exhibit robust economies. Jacksonville's economy is diversified with strong sectors in transportation, logistics, healthcare, and finance. In Arlington, the economy is dominated by entertainment, professional sports, education, and healthcare sectors. Both cities provide ample job opportunities, with average wages ticking upward in recent years.
Biggest Employers
In Jacksonville, some of the biggest employers are the Naval Air Station, Duval County Public Schools, and the City of Jacksonville. For Arlington, the biggest employers include the Arlington Independent School District, the University of Texas at Arlington, and the Texas Health Resources.
There were 1,310 building permits issued in Jacksonville in 2012 (353 more than in 2011) compared to 976 building permits issued in Arlington in 2012 (744 more than in 2011).
In Jacksonville (Duval County), 47.9% voted for Democrats and 51.5% for Republicans in 2012 Presidential Election. In Arlington (Tarrant County), 41.4% voted for Democrats and 57.1% for Republicans.
Elections
Type
Democrats
Republicans
Other
Year
Jacksonville
Arlington
Jacksonville
Arlington
Jacksonville
Arlington
2020
51.3%
49.3%
47.5%
49.1%
1.2%
1.6%
2016
47.2%
43.2%
48.6%
51.8%
4.2%
5.0%
2012
47.9%
41.4%
51.5%
57.1%
0.6%
1.4%
2008
49.0%
43.8%
51.0%
55.5%
0.0%
0.7%
2004
41.7%
37.0%
57.9%
62.5%
0.3%
0.5%
2000
40.9%
36.9%
57.7%
60.9%
1.4%
2.3%
1996
44.2%
41.6%
50.0%
50.9%
5.8%
7.5%
Breakdown of population affiliated with a religious congregation
Type
Adherents
Congregations
Religion
Jacksonville
Arlington
Jacksonville
Arlington
SOUTHERN BAPTIST CONVENTION
15.8%
17.3%
22.3%
33.3%
CATHOLIC CHURCH
9.0%
11.1%
2.8%
1.9%
EPISCOPAL CHURCH
1.2%
0.3%
2.3%
0.8%
MUSLIM ESTIMATE
0.7%
2.2%
0.6%
0.9%
LUTHERAN CHURCH
0.3%
0.5%
0.7%
0.9%
SEVENTH DAY ADVENTIST CHURCH
0.3%
0.4%
1.4%
1.6%
Weather
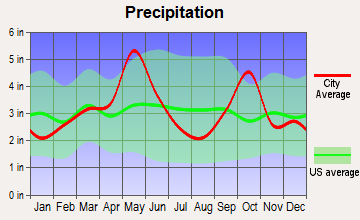
Jacksonville, located in Florida, offers a subtropical climate with hot, humid summers and mild winters, making it a favorite for sunshine lovers. Arlington, in Texas, has a humid subtropical climate with hot summers and mild to cool winters. Unlike Jacksonville, Arlington experiences more significant seasonal temperature swings and is prone to occasional severe weather, including thunderstorms and tornadoes.
Weather and climate
Type
Jacksonville
Arlington
Temperature - Average
68.3°F
65°F
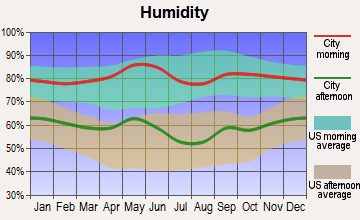
Humidity - Average morning or afternoon humidity
78.4%
71.4%
Humidity - Differences between morning and afternoon humidity
44%
34%
Humidity - Maximum monthly morning or afternoon humidity
92%
82%
Humidity - Minimum monthly morning or afternoon humidity
48%
48%
Precipitation - Yearly average
51.8 in
37.9 in
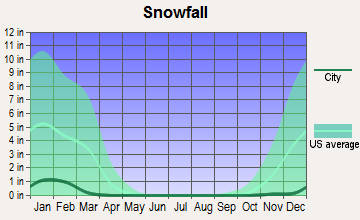
Snowfall - Yearly average
0 in
4.2 in
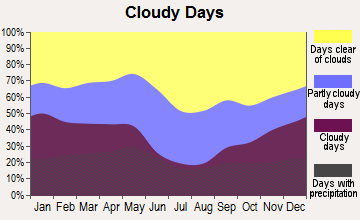
Clouds - Number of days clear of clouds
15.8%
22.7%
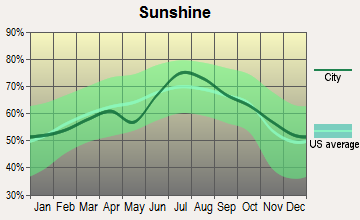
Sunshine amount - Average
69.6%
66.6%
Sunshine amount - Differences during a year
16%
20%
Sunshine amount - Maximum monthly
74%
74%
Sunshine amount - Minimum monthly
58%
54%
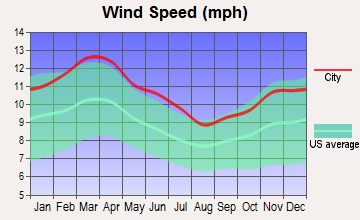
Wind speed - Average
7.2 mph
10.3 mph
Average climate in Jacksonville, Florida
Average climate in Arlington, Texas
Air pollution
Type
AQI
CO
NO2
OZONE
PB
PM25
SO2
Year
Jacksonville
Arlington
Jacksonville
Arlington
Arlington
Jacksonville
Arlington
Jacksonville
Jacksonville
Arlington
Jacksonville
Arlington
2018
78
86
N/A
N/A
5.8
N/A
24.5
27.1
N/A
N/A
7.1
9.4
N/A
0.4
2017
74
86
N/A
N/A
6.2
N/A
24.7
27.2
N/A
N/A
5.8
9.1
0.7
0.3
2016
65
76
0.50
N/A
6.3
N/A
24.9
25.5
N/A
N/A
5.2
8.2
0.4
0.2
2015
63
80
0.35
N/A
6.5
N/A
25.4
24.8
N/A
N/A
4.9
8.6
0.3
0.3
2014
66
78
0.27
0.22
6.8
N/A
24.3
26.6
N/A
N/A
5.9
9.3
0.7
0.3
2013
68
96
0.18
0.25
6.4
N/A
23.0
27.2
N/A
N/A
5.3
11.0
0.7
0.2
2012
66
108
0.10
0.26
7.8
N/A
24.0
30.3
N/A
N/A
5.8
10.5
0.6
0.3
2011
88
96
0.28
0.23
8.2
N/A
26.6
30.7
N/A
N/A
8.1
9.5
0.8
0.6
2010
77
76
0.31
0.23
8.9
N/A
26.4
27.7
N/A
N/A
7.1
8.4
0.8
0.7
2009
72
91
0.16
0.25
8.7
N/A
25.0
29.5
N/A
N/A
8.5
8.5
0.6
0.5
2008
75
92
0.15
0.25
9.6
N/A
27.6
25.8
N/A
N/A
10.0
10.7
0.9
0.5
2007
92
95
0.29
0.30
10.6
N/A
28.4
24.6
N/A
N/A
11.4
9.8
1.2
0.5
2006
87
102
0.35
0.34
10.4
N/A
29.0
29.7
N/A
N/A
10.8
9.9
1.4
0.8
2005
93
110
0.42
0.34
11.7
N/A
26.5
28.4
N/A
N/A
12.2
11.3
1.8
1.0
2004
92
90
0.40
0.39
10.8
N/A
25.2
25.4
N/A
N/A
12.4
N/A
1.4
0.9
2003
55
97
0.43
0.40
11.1
N/A
21.6
27.2
N/A
N/A
N/A
N/A
1.6
1.0
2002
59
97
0.49
0.37
11.8
N/A
22.2
25.8
0.003
N/A
N/A
N/A
1.7
0.6
2001
74
88
0.49
0.48
14.7
N/A
24.0
25.0
0.009
N/A
N/A
N/A
2.5
1.1
2000
85
104
0.52
0.55
14.5
N/A
25.1
26.2
0.017
N/A
N/A
N/A
3.0
1.3
Natural disasters
Type
Jacksonville
Arlington
Tornado activity compared to U.S. average
75.2%
254.3%
Earthquake activity compared to U.S. average
18.1%
558.3%
Natural disasters compared to U.S. average
24%
23%
Transportation
Jacksonville has a fairly extensive public transportation system, including buses and a skyway monorail system serving downtown. In Arlington, public transit options are limited, and most residents rely on personal vehicles. Both cities face commuting challenges typical of growing urban areas, but ongoing improvement initiatives aim to ease traffic conditions.
Transport
Type
Jacksonville
Arlington
Amtrak stations
1
0
Amtrak stations nearby
1
2
FAA registered aircraft
566
362
FAA registered aircraft manufacturers and dealers
34
5
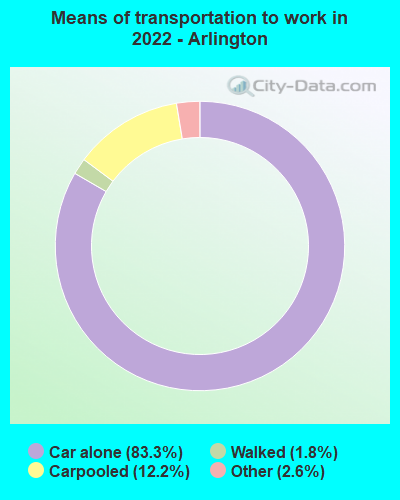
Means of transportation to work
Type
Jacksonville
Arlington
Bicycle
0.2%
0.2%
Bus
1.1%
0%
Carpooled
9%
11.9%
Car alone
86.5%
85%
Motorcycle
0.2%
0.1%
Taxicab
0.2%
0%
Walked
1.2%
1.4%
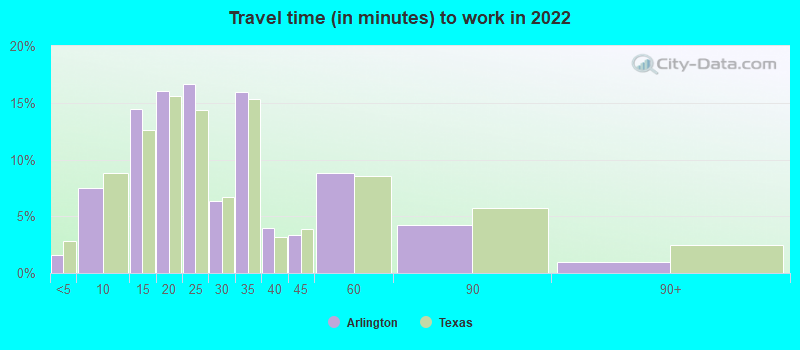
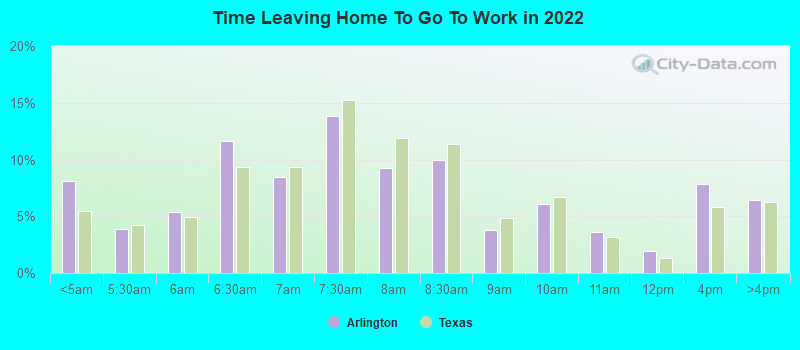
Average travel time to work
Type
Jacksonville
Arlington
Average
27.5 min
26.1 min
Other means
25 min
27.6 min
Public transportation
43.7 min
45.1 min
Private vehicle occupancy
Type
Jacksonville
Arlington
Average
1.1
1.2
Drove alone
89.4%
88.7%
In 2 person carpool
8%
7.8%
In 3 person carpool
1.7%
2.2%
In 4 person carpool
0.7%
0.8%
In 5-6 person carpool
0%
0.4%
In 7+ person carpool
0.2%
0.1%
How many people usually rode to work in the car, truck or van.
Real Estate
Real estate in Jacksonville is relatively affordable, offering a lower median home price than the national average. In contrast, Arlington's real-estate market is more competitive, with prices above the national average due to its convenient location and robust economy.
Neighborhoods
Jacksonville boasts a variety of neighborhoods from beachfront communities to urban districts, catering to varied lifestyle preferences. Arlington, a major suburb in the Dallas-Fort Worth metroplex, offers its unique mix of quiet residential areas and bustling entertainment districts, such as the Arlington Entertainment District.
Houses and residents
Type
Jacksonville
Arlington
Houses
422,315
156,653
Average household size (people)
2.5
2.7
Median year apartment built
1985
1983
Median year house/condo built
1987
1984
Length of stay in the house since moving in
12.5 years
13 years
Houses occupied
386,283 (91.5%)
146,888 (93.8%)
Houses occupied by owners
226,429 (58.6%)
78,883 (53.7%)
Houses occupied by renters
159,854 (41.4%)
68,005 (46.3%)
Median rent asked for vacant for-rent units
$1,444
$1,609
Median monthly housing costs
$1,154
$1,220
Median price asked for vacant for-sale houses and condos
$260,045
$199,415
Estimated median house or condo value
$239,400
$254,700
Median numbers of rooms
5.6
5.4
Median number of rooms in apartments
4.3
4.1
Median number of rooms in houses and condos
6.3
6.5
Median house price - detached houses
$282,276
$265,594
Median house price - in 2-unit structures
$177,341
$415,006
Median house price - in 3-to-4-unit structures
$144,947
$224,044
Median house price - in 5 or more unit structures
$220,508
$131,545
Median house price - mobile homes
$87,589
$92,300
Median house price - Townhouses or other attached units
$213,709
$171,140
Median house price - All housing units
$266,926
$259,527
Median house age
36
37
Renting percentage
38.3%
42.6%
Housing density (houses/condos per square mile)
557.4
1,634.9
House value disparities
33.2%
25%
Household income disparities
44.2%
43.9%
Median household income for houses/condes with a mortgage
$83,160
$97,883
Median household income for apartments without a mortgage
$59,777
$67,452
Housing units without a mortgage
2,439 (1.6%)
948 (2%)
Housing units with both a second mortgage and home equity loan
8,460 (5.5%)
1,684 (3.6%)
Housing units with a mortgage
150,468 (98.4%)
46,456 (98%)
Housing units with a home equity loan
255 (0.2%)
0 (0%)
Housing units with a second mortgage
11,378 (7.4%)
1,967 (4.1%)
House/condo owner moved in on average (years ago)
10
13
House/condo renter moved in on average (years ago)
1
1
Housing units lacking complete kitchen facilities
1.5%
1.7%
Housing units lacking complete plumbing facilities
1.4%
1%
Housing units in structures
Housing units in structures
Jacksonville
Arlington
One, detached
59.4%
60.2%
One, attached
6.1%
10.8%
Two
2.1%
1.5%
3 or 4
5.3%
4.3%
5 to 9
5.0%
5.7%
10 to 19
7.9%
7.7%
20 to 49
4.9%
3.3%
50 or more
5.3%
5.2%
Mobile homes
3.8%
1.3%
Boats, RVs, vans, etc.
0.2%
0.1%
Median real estate property taxes paid for housing units
Self-employed workers in own not incorporated business
19,601
10,953
State government workers
13,692
6,771
Unpaid family workers
1,066
396
Industries and Occupations
Jacksonville's notable industries include healthcare, finance, logistics, and transportation, with major employers like Baptist Health and Bank of America. Arlington, the hub of the automotive and aerospace industries, hosts major employers such as GM and Bell Helicopter, alongside professional sports and entertainment sectors.
Healthcare in Jacksonville is top-notch, home to leading providers like the Mayo Clinic and Baptist Medical Center. Arlington also offers quality healthcare services, with Texas Health Arlington Memorial Hospital among others. Both cities are investing in improving public health facilities and services.
Health (county statistics)
Type
Jacksonville
Arlington
General health status score of residents in this county from 1 (poor) to 5 (excellent)
Jacksonville, the largest city by land area in the US, has an extensive infrastructure network including roads, bridges, airports, and seaports. Arlington, while smaller, is strategically located between Dallas and Fort Worth, providing a well-connected transportation system. Both cities are investing in infrastructure improvements and modernization initiatives.
Infrastructure
Type
Jacksonville
Arlington
Hospitals
25
39
TV stations
17
25
Arenas or stadiums
2
1
Bank branches located here
191
74
Bank institutions located here
31
23
Main business address for public companies
23
2
Drinking water stations with no reported violations in the past
20
0
Drinking water stations with reported violations in the past
HMDA - Conventional home purchase loans - Applications denied
Year
Jacksonville
Arlington
1999
5,422
1,768
2000
4,132
1,198
2001
3,038
1,140
2002
2,017
847
2003
3,563
1,216
2004
4,781
1,504
2005
7,134
2,158
2006
8,812
2,107
2007
5,298
1,390
2008
1,719
558
2009
676
235
Culture and Food
Both cities have a rich cultural scene. Jacksonville's beachside location influences its laid-back culture, and seafood is a staple in its culinary scene. Arlington, with its Texan charm, offers a vibrant food scene, including BBQ, Tex-Mex, and steak. Both cities host numerous festivals, events, and cultural attractions throughout the year.
Sports Teams
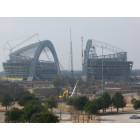
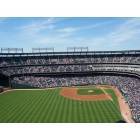
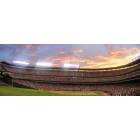
Jacksonville is home to the NFL's Jacksonville Jaguars. The city also hosts the annual Florida-Georgia college football game. Arlington, on the other hand, is a sports haven, housing the NFL's Dallas Cowboys, MLB's Texas Rangers, and eSports team Dallas Fuel. Both cities provide ample sports entertainment for residents and tourists alike.


 Jacksonville, FL
 Arlington, TX