Comparing Jacksonville, FL, to Laredo, TX, one can expect different pros and cons in each city. While Jacksonville boasts of a pleasant coastal climate, vibrant sports culture, and diversified economy, Laredo offers a bilingual and bicultural experience, lower cost of living, and crucial trade link with Mexico. The ensuing comparison diving into various aspects should help those looking to relocate or just visiting in making an informed decision.
Distance between
Jacksonville, FL and
Laredo, TX : 1,094.2 miles
Jacksonville's population is larger by 273%. Its population has grown by 218,997 people (29.8%) since 2000. The population of Laredo has grown by 79,577 people (45.1%) during that time.
Jacksonville struggles with a higher crime rate than the national average, which is worth considering when relocating or visiting. Laredo, conversely, has a lower crime rate than the statewide average of Texas, often ranking as one of the safest cities for its size. Both cities have police forces working to improve safety with varying levels of community outreach and involvement.
Cost of Living
The cost of living in Jacksonville is slightly above the national average, pushed up mainly by transport and housing costs. Laredo offers a lower cost of living, mainly due to affordable housing, which could be attractive for potential residents looking for economic advantages.
Income Tax
Neither Florida nor Texas has a state income tax. This results in residents of Jacksonville and Laredo not needing to pay city or state income tax.
Property Tax
Property tax depends on county rates in both states. Duval County, where Jacksonville is located, has rates around 0.9%, while Webb County, housing Laredo, carries rates close to 2.2%.
Sales Tax
Florida's statewide sales tax is 6% with Jacksonville's county adding 1%. Laredo, on the contrary, has a total sales tax rate of 8.25%, combining state, county and city rates. The difference could have noticeable impact on consumer purchases.
Income
Type
Jacksonville
Laredo
Estimated median household income
$58,621
$52,438
Estimated per capita income
$32,953
$21,785
Cost of living index (U.S. average is 100)
88.3
82.6
If you make $50,000 in Laredo, you will have to make $53,450 in Jacksonville to maintain the same standard of living.
Geographical Conditions
Located on Florida's east coast, Jacksonville boasts of beautiful beaches, rivers, and extensive city parks. Laredo, located on the border of Mexico and the U.S., lies along the Rio Grande and features a more arid landscape with few bodies of water.
Ranging from pre-school to post-secondary institutions, both cities offer an array of public and private options. Jacksonville has more universities and colleges within the city, including the University of North Florida and Jacksonville University. Laredo is home to Texas A&M International University and Laredo College.
Jacksonville boasts a diversified economy with healthcare, finances, logistics, and military sectors playing a significant role. Laredo's economy, on the other hand, is much focused on international trade with Mexico. Job-wise, Jacksonville may offer more options due to the variety of industries.
Biggest Employers
In Jacksonville, the Naval Air Station, Duval County Public School system, City of Jacksonville, and Baptist Health are some major employers. For Laredo, the United Independent School District, Laredo Independent School District, and City of Laredo provide many local jobs.
There were 1,310 building permits issued in Jacksonville in 2012 (353 more than in 2011) compared to 1,462 building permits issued in Laredo in 2012 (822 more than in 2011).
In Jacksonville (Duval County), 47.9% voted for Democrats and 51.5% for Republicans in 2012 Presidential Election. In Laredo (Webb County), 76.4% voted for Democrats and 22.5% for Republicans.
Elections
Type
Democrats
Republicans
Other
Year
Jacksonville
Laredo
Jacksonville
Laredo
Jacksonville
Laredo
2020
51.3%
61.1%
47.5%
37.9%
1.2%
1.0%
2016
47.2%
74.4%
48.6%
22.8%
4.2%
2.9%
2012
47.9%
76.4%
51.5%
22.5%
0.6%
1.1%
2008
49.0%
71.5%
51.0%
28.0%
0.0%
0.4%
2004
41.7%
57.0%
57.9%
42.7%
0.3%
0.3%
2000
40.9%
57.6%
57.7%
41.6%
1.4%
0.8%
1996
44.2%
76.7%
50.0%
19.0%
5.8%
4.3%
Breakdown of population affiliated with a religious congregation
Type
Adherents
Congregations
Religion
Jacksonville
Laredo
Jacksonville
Laredo
SOUTHERN BAPTIST CONVENTION
15.8%
1.2%
22.3%
21.0%
CATHOLIC CHURCH
9.0%
50.6%
2.8%
18.8%
EPISCOPAL CHURCH
1.2%
0.1%
2.3%
0.7%
MUSLIM ESTIMATE
0.7%
1.0%
0.6%
0.7%
SEVENTH DAY ADVENTIST CHURCH
0.3%
0.3%
1.4%
2.9%
Weather
Jacksonville offers a humid subtropical climate with warm, wet summers and mild, dry winters. Contrarily, Laredo features a semi-arid climate; summers can be extremely hot, and winters are generally mild to warm. The amount of rainfall in Laredo is much less than that in Jacksonville.
Weather and climate
Type
Jacksonville
Laredo
Temperature - Average
68.3°F
73.9°F
Humidity - Average morning or afternoon humidity
78.4%
80%
Humidity - Differences between morning and afternoon humidity
44%
36.1%
Humidity - Maximum monthly morning or afternoon humidity
92%
91.2%
Humidity - Minimum monthly morning or afternoon humidity
48%
55.1%
Precipitation - Yearly average
51.8 in
21.5 in
Snowfall - Yearly average
0 in
0.3 in
Clouds - Number of days clear of clouds
15.8%
17.3%
Sunshine amount - Average
69.6%
64.3%
Sunshine amount - Differences during a year
16%
35.1%
Sunshine amount - Maximum monthly
74%
78.3%
Sunshine amount - Minimum monthly
58%
43.1%
Wind speed - Average
7.2 mph
12.1 mph
Average climate in Jacksonville, Florida
Average climate in Laredo, Texas
Air pollution
Type
AQI
CO
OZONE
PB
PM10
PM25
SO2
Year
Jacksonville
Laredo
Jacksonville
Laredo
Jacksonville
Laredo
Jacksonville
Laredo
Laredo
Jacksonville
Jacksonville
2018
78
44
N/A
0.20
24.5
24.2
N/A
N/A
N/A
N/A
7.1
N/A
N/A
N/A
2017
74
N/A
N/A
N/A
24.7
N/A
N/A
N/A
N/A
N/A
5.8
N/A
0.7
N/A
2016
65
37
0.50
0.37
24.9
20.0
N/A
N/A
N/A
N/A
5.2
N/A
0.4
N/A
2015
63
41
0.35
0.26
25.4
21.1
N/A
N/A
N/A
N/A
4.9
N/A
0.3
N/A
2014
66
43
0.27
0.24
24.3
22.6
N/A
N/A
N/A
N/A
5.9
N/A
0.7
N/A
2013
68
51
0.18
0.12
23.0
23.5
N/A
N/A
N/A
N/A
5.3
N/A
0.7
N/A
2012
66
N/A
0.10
N/A
24.0
N/A
N/A
N/A
N/A
N/A
5.8
N/A
0.6
N/A
2011
88
55
0.28
N/A
26.6
28.3
N/A
N/A
N/A
N/A
8.1
N/A
0.8
N/A
2010
77
54
0.31
0.40
26.4
22.4
N/A
N/A
22.3
N/A
7.1
N/A
0.8
N/A
2009
72
50
0.16
0.41
25.0
22.3
N/A
N/A
25.1
N/A
8.5
N/A
0.6
N/A
2008
75
62
0.15
0.40
27.6
20.5
N/A
0.009
28.0
N/A
10.0
N/A
0.9
N/A
2007
92
63
0.29
0.54
28.4
22.2
N/A
0.009
29.5
N/A
11.4
N/A
1.2
N/A
2006
87
116
0.35
0.52
29.0
21.6
N/A
0.010
39.3
N/A
10.8
N/A
1.4
N/A
2005
93
66
0.42
0.53
26.5
22.3
N/A
0.013
27.5
N/A
12.2
N/A
1.8
N/A
2004
92
57
0.40
0.57
25.2
22.4
N/A
0.012
24.2
N/A
12.4
N/A
1.4
N/A
2003
55
62
0.43
0.79
21.6
24.0
N/A
0.011
N/A
N/A
N/A
N/A
1.6
N/A
2002
59
58
0.49
0.84
22.2
24.5
0.003
0.008
N/A
N/A
N/A
N/A
1.7
N/A
2001
74
55
0.49
0.85
24.0
22.8
0.009
0.013
N/A
N/A
N/A
N/A
2.5
N/A
2000
85
60
0.52
0.95
25.1
22.5
0.017
0.020
N/A
N/A
N/A
N/A
3.0
N/A
Natural disasters
Type
Jacksonville
Laredo
Tornado activity compared to U.S. average
75.2%
9.6%
Earthquake activity compared to U.S. average
18.1%
58.7%
Natural disasters compared to U.S. average
24%
16%
Transportation
Jacksonville features more diversified public transportation infrastructure, including buses, a skyway monorail system, and river ferries. For Laredo, the "El Metro" transit system serves the city with buses. Both cities' commuting times depend heavily on private vehicles and traffic.
Transport
Type
Jacksonville
Laredo
Amtrak stations
1
1
Amtrak stations nearby
1
1
FAA registered aircraft
566
135
FAA registered aircraft manufacturers and dealers
34
7
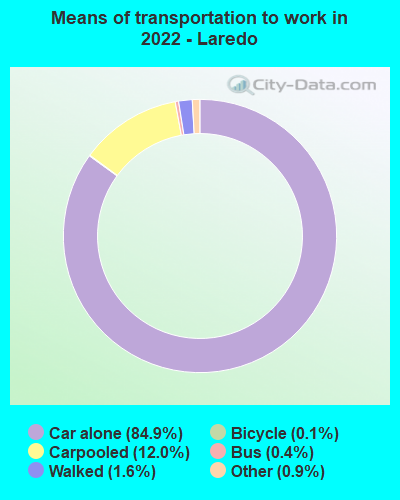
Means of transportation to work
Type
Jacksonville
Laredo
Bicycle
0.2%
0.1%
Bus
1.1%
1.2%
Carpooled
9%
12%
Car alone
86.5%
83.1%
Motorcycle
0.2%
0.1%
Streetcar
0%
0.1%
Taxicab
0.2%
0%
Walked
1.2%
1.2%
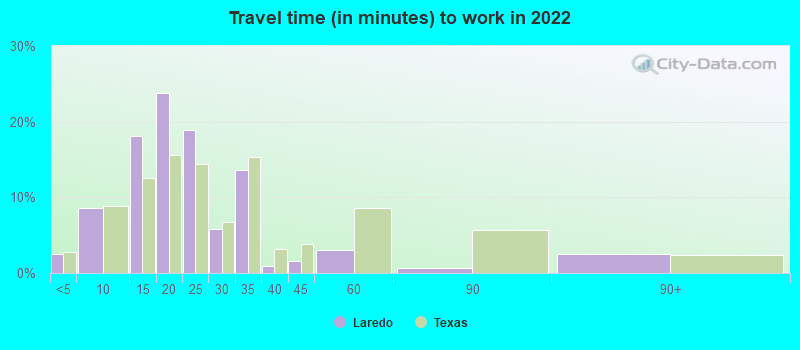
Average travel time to work
Type
Jacksonville
Laredo
Average
27.5 min
21.3 min
Other means
25 min
21.3 min
Public transportation
43.7 min
40.7 min
Private vehicle occupancy
Type
Jacksonville
Laredo
Average
1.1
1.2
Drove alone
89.4%
87%
In 2 person carpool
8%
8.8%
In 3 person carpool
1.7%
2.8%
In 4 person carpool
0.7%
0.8%
In 5-6 person carpool
0%
0.4%
In 7+ person carpool
0.2%
0.1%
How many people usually rode to work in the car, truck or van.
Real Estate
While Jacksonville's real estate market is competitive with diverse options, it might be pricier than Laredo. On the other hand, Laredo offers more affordable housing and commercial options due to the lower demand compared to Florida's coast.
Neighborhoods
Whether it's the historical Riverside in Jacksonville or the tight-knit community feel in Laredo's Del Mar, both cities boast neighborhoods of varied characters. The cost, feel and culture can vary significantly within each city.
Houses and residents
Type
Jacksonville
Laredo
Houses
422,315
82,105
Average household size (people)
2.5
3.7
Median year apartment built
1985
1993
Median year house/condo built
1987
1999
Length of stay in the house since moving in
12.5 years
14.3 years
Houses occupied
386,283 (91.5%)
76,095 (92.7%)
Houses occupied by owners
226,429 (58.6%)
48,145 (63.3%)
Houses occupied by renters
159,854 (41.4%)
27,950 (36.7%)
Median rent asked for vacant for-rent units
$1,444
$660.71
Median monthly housing costs
$1,154
$895
Median price asked for vacant for-sale houses and condos
$260,045
$131,192
Estimated median house or condo value
$239,400
$157,400
Median numbers of rooms
5.6
5.1
Median number of rooms in apartments
4.3
4.1
Median number of rooms in houses and condos
6.3
5.7
Median house price - detached houses
$282,276
$200,897
Median house price - in 2-unit structures
$177,341
$236,063
Median house price - in 3-to-4-unit structures
$144,947
$131,179
Median house price - in 5 or more unit structures
$220,508
$140,731
Median house price - mobile homes
$87,589
$84,838
Median house price - Townhouses or other attached units
$213,709
$167,216
Median house price - All housing units
$266,926
$187,779
Median house age
36
25
Renting percentage
38.3%
36.3%
Housing density (houses/condos per square mile)
557.4
1,046.5
House value disparities
33.2%
37.1%
Household income disparities
44.2%
46.4%
Median household income for houses/condes with a mortgage
$83,160
$78,507
Median household income for apartments without a mortgage
$59,777
$53,572
Housing units without a mortgage
2,439 (1.6%)
313 (1.2%)
Housing units with both a second mortgage and home equity loan
8,460 (5.5%)
431 (1.6%)
Housing units with a mortgage
150,468 (98.4%)
25,985 (98.8%)
Housing units with a home equity loan
255 (0.2%)
3 (0%)
Housing units with a second mortgage
11,378 (7.4%)
605 (2.3%)
House/condo owner moved in on average (years ago)
10
13
House/condo renter moved in on average (years ago)
1
1
Housing units lacking complete kitchen facilities
1.5%
3%
Housing units lacking complete plumbing facilities
1.4%
2.6%
Housing units in structures
Housing units in structures
Jacksonville
Laredo
One, detached
59.4%
66.4%
One, attached
6.1%
2.3%
Two
2.1%
1.7%
3 or 4
5.3%
5.7%
5 to 9
5.0%
3.9%
10 to 19
7.9%
2.6%
20 to 49
4.9%
1.5%
50 or more
5.3%
5.6%
Mobile homes
3.8%
9.8%
Boats, RVs, vans, etc.
0.2%
0.6%
Median real estate property taxes paid for housing units
Self-employed workers in own not incorporated business
19,601
5,131
State government workers
13,692
4,703
Unpaid family workers
1,066
395
Industries and Occupations
Besides the healthcare and finance sector, Jacksonville is also driven by the defense industry with Navy bases. The primary occupations relate to these sectors. In contrast, Laredo's economy is largely dependent on international trade. The most common occupations are in sales, office, and administrative support roles fitting its trade economy.
Jacksonville is a notable medical hub with top-tier health facilities like the Mayo Clinic and Wolfson Children's Hospital. Laredo has quality healthcare services but fewer options, with the Laredo Medical Center being the primary facility.
Health (county statistics)
Type
Jacksonville
Laredo
General health status score of residents in this county from 1 (poor) to 5 (excellent)
Jacksonville, one of the largest cities by area in the U.S, is sprawling with well-developed infrastructures including bridges, ports, road networks, airport, and more. Laredo's infrastructure is concentrated around international trade, boasting bridges across the US-Mexico border and a major interstate highway (I-35).
Infrastructure
Type
Jacksonville
Laredo
Hospitals
25
11
TV stations
17
7
Arenas or stadiums
2
1
Bank branches located here
191
56
Bank institutions located here
31
13
Main business address for public companies
23
1
Drinking water stations with no reported violations in the past
20
2
Drinking water stations with reported violations in the past
HMDA - Conventional home purchase loans - Applications denied
Year
Jacksonville
Laredo
1999
5,422
2,067
2000
4,132
823
2001
3,038
343
2002
2,017
155
2003
3,563
330
2004
4,781
450
2005
7,134
645
2006
8,812
720
2007
5,298
564
2008
1,719
174
2009
676
64
Culture and Food
Jacksonville's coastal culture brings a rich blend of southern and coastal cuisine and a vibrant arts scene. In contrast, Laredo offers a unique bicultural experience, with Mexican-American heritage strongly influencing local festivals, arts, and especially the Tex-Mex cuisine.
Sports Teams
Jacksonville is home to the Jaguars (NFL) and several minor league teams, providing exciting sporting events. Laredo doesn't host major league teams, but the city supports local college and high school sports, and semi-pro and minor league teams.


 Jacksonville, FL
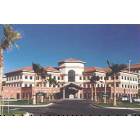
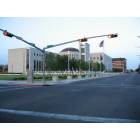
 Laredo, TX