Kansas City, MO and Independence, MO are both cities with unique characteristics. While Kansas City is known for its thriving arts scene, culinary variety, and professional sports, Independence takes pride in its rich historical heritage, lower cost of living, and smaller community vibe. Both cities offer a variety of neighborhoods, public services, and employment opportunities, making them potentially desirable locations for individuals considering relocation or tourists on a visit.
Distance between
Kansas City, MO and
Independence, MO : 8.0 miles
Kansas City's population is larger by 316%. Its population has grown by 66,849 people (15.1%) since 2000. The population of Independence has grown by 8,800 people (7.8%) during that time.
Like many cities, both Kansas City and Independence have varied crime rates depending on the area. Kansas City, being larger, does have higher crime rates overall compared to Independence. That said, many neighborhoods in both cities are considered safe and pleasant. It's important for residents and tourists alike to take standard precautions as they would in any city when it comes to personal safety.
City-data.com crime index counts serious crimes and violent crime more heavily. It adjusts for the number of visitors and daily workers commuting into cities. (higher means more crime, U.S. average = 301.1)
City-data.com crime index counts serious crimes and violent crime more heavily. It adjusts for the number of visitors and daily workers commuting into cities. (higher means more crime, U.S. average = 301.1)
Sex Offenders
According to our data, there are 1,794 registered sex offenders living in Kansas City and 447 registered sex offenders living in . The ratio of residents to sex offenders in Kansas City is 268 to 1; the ratio in Independence is 265 to 1. The number of registered sex offenders compared to the number of residents in Kansas City is near to than in Independence.
Cost of Living
Independence often has a lower cost of living compared to Kansas City. Housing in Independence is particularly more affordable, which can be a key factor for those considering relocation. However, Kansas City offers more variety in terms of luxury housing and downtown living experiences. For tourists, both cities offer a range of accommodations at different price points.
Income Tax
Neither city imposes a city-level income tax, but the state of Missouri does have an income tax that varies from 1.5% to 5.4% depending on the individual's taxable income.
Property Tax
Both Kansas City and Independence have property taxes, but Independence tends to have slightly lower rates. The rate can vary based on the value and location of the property.
Sales Tax
Kansas City has a sales tax rate of 8.6%, while Independence has a sales tax rate of 7.7%. The state sales tax for Missouri is 4.225%.
Income
Type
Kansas City
Independence
Estimated median household income
$63,396
$52,919
Estimated per capita income
$36,456
$30,273
Cost of living index (U.S. average is 100)
87.3
86.2
If you make $50,000 in Independence, you will have to make $50,638 in Kansas City to maintain the same standard of living.
Geographical Conditions
Both cities are located in the Plains States region and feature a mix of rolling hills and flat terrain. Kansas City is located at the junction of the Kansas and Missouri Rivers, while Independence is further east and does not border a major river.
Kansas City has a larger and more diverse education system due to its size. It has numerous public and private schools and is home to several universities and colleges. Independence, while smaller, still offers a quality education system with well-regarded public and private schools.
Kansas City is the larger economic hub, hosting numerous corporate headquarters and offering a wide variety of job opportunities in various sectors. Independence, while not as economically diverse, still offers job opportunities, particularly in the service industry and local government.
Biggest Employers
The biggest employers in Kansas City include Cerner Corporation, an internationally recognized health tech firm, and H&R Block, a major company in tax preparation services. Independence's largest employers include the Independence School District and Centerpoint Medical Center.
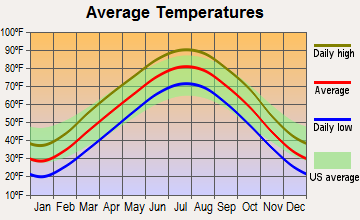
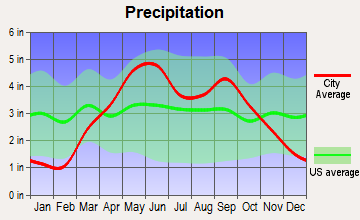
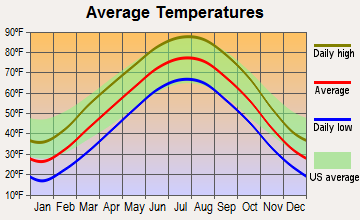
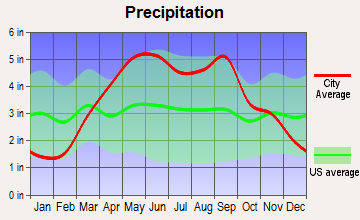
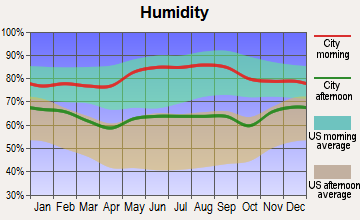
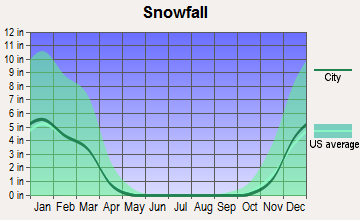
Kansas City and Independence share a similar climate as they are located close to each other. Both have a humid continental climate with hot, muggy summers and cold winters. Snowfall can be expected in winter months, while rainfall is fairly evenly spread throughout the year.
Weather and climate
Type
Kansas City
Independence
Temperature - Average
56.2°F
53.5°F
Humidity - Average morning or afternoon humidity
76.3%
76.3%
Humidity - Differences between morning and afternoon humidity
30.1%
30.1%
Humidity - Maximum monthly morning or afternoon humidity
86%
86%
Humidity - Minimum monthly morning or afternoon humidity
56%
55.9%
Precipitation - Yearly average
36.3 in
42.8 in
Snowfall - Yearly average
38 in
38 in
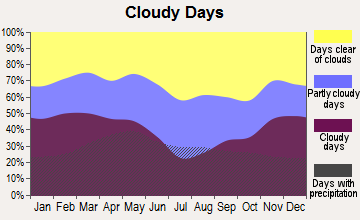
Clouds - Number of days clear of clouds
20.1%
20.1%
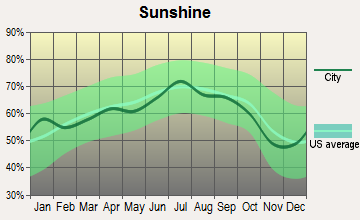
Sunshine amount - Average
67.3%
67.3%
Sunshine amount - Differences during a year
25.9%
25.9%
Sunshine amount - Maximum monthly
74%
74%
Sunshine amount - Minimum monthly
48%
48%
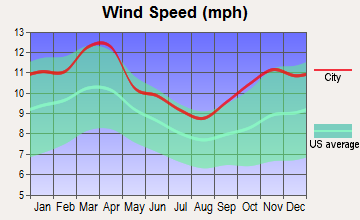
Wind speed - Average
11.2 mph
11.2 mph
Average climate in Kansas City, Missouri
Average climate in Independence, Missouri
Air pollution
Type
AQI
CO
NO2
OZONE
PM10
PM25
SO2
Year
Kansas City
Independence
Kansas City
Independence
Kansas City
Independence
Kansas City
Independence
Kansas City
Independence
Kansas City
Independence
Kansas City
Independence
2018
89
90
0.29
0.28
11.1
10.8
29.6
28.8
24.5
23.2
7.4
7.8
0.9
0.8
2017
88
88
0.29
0.28
11.6
11.3
30.4
29.4
26.7
25.2
10.0
8.9
1.4
1.1
2016
85
85
0.30
0.29
12.0
11.5
28.9
27.7
24.9
24.1
9.0
8.3
1.5
1.3
2015
90
90
0.30
0.30
12.9
12.4
28.9
27.5
33.6
33.6
8.3
9.0
4.6
3.6
2014
90
90
0.28
0.28
13.0
12.5
28.6
27.8
28.5
28.5
9.3
9.8
5.0
3.9
2013
88
88
0.41
0.41
13.2
13.1
29.3
28.7
30.8
30.8
10.3
10.3
5.6
4.4
2012
105
106
0.52
0.52
14.2
13.6
31.9
31.1
N/A
N/A
10.3
10.4
6.4
5.3
2011
108
110
0.45
0.45
15.0
14.4
29.9
28.1
N/A
N/A
10.9
11.0
4.8
4.4
2010
97
98
0.40
0.40
15.0
13.2
27.4
26.2
N/A
N/A
11.9
11.4
5.4
5.4
2009
96
97
0.29
0.29
14.8
12.2
28.3
27.1
N/A
N/A
9.6
9.9
6.1
5.6
2008
89
89
0.40
0.40
17.0
14.8
25.7
24.9
N/A
N/A
11.5
11.3
6.0
5.3
2007
104
104
0.42
0.42
18.4
14.9
29.1
27.0
N/A
N/A
13.1
12.7
4.2
4.2
2006
104
105
0.36
0.38
18.5
15.5
29.2
28.2
N/A
N/A
12.4
11.9
5.1
4.9
2005
105
105
0.55
0.54
18.3
15.9
28.4
27.5
N/A
N/A
N/A
N/A
4.5
4.7
2004
83
84
0.45
0.47
11.6
14.2
26.2
25.6
N/A
N/A
N/A
N/A
4.0
4.5
2003
99
99
0.41
0.43
10.9
13.9
28.0
27.6
N/A
N/A
N/A
N/A
3.0
4.4
2002
100
100
0.40
0.55
8.9
13.4
27.0
27.0
N/A
N/A
N/A
N/A
2.5
2.5
2001
88
88
0.52
0.54
7.9
13.0
27.0
26.9
N/A
N/A
N/A
N/A
1.2
1.3
2000
102
102
0.75
0.80
8.8
12.7
29.2
27.0
N/A
N/A
N/A
N/A
2.2
2.1
Natural disasters
Type
Kansas City
Independence
Tornado activity compared to U.S. average
200.4%
194.9%
Earthquake activity compared to U.S. average
598.9%
590.4%
Natural disasters compared to U.S. average
24%
24%
Transportation
Kansas City has a more developed public transportation system, featuring buses, a light rail system, and bike shares. Independence relies more heavily on car transportation, although there is access to public buses as well.
Transport
Type
Kansas City
Independence
Amtrak stations
1
1
Amtrak stations nearby
3
3
FAA registered aircraft
0
47
FAA registered aircraft manufacturers and dealers
0
1
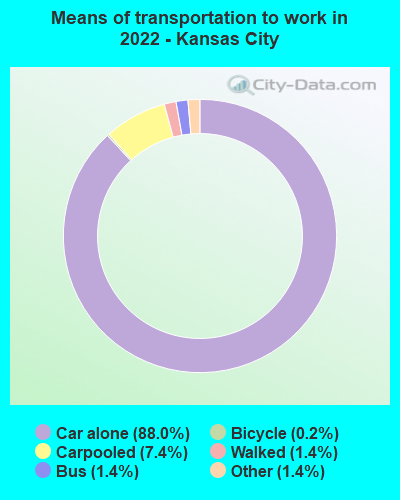
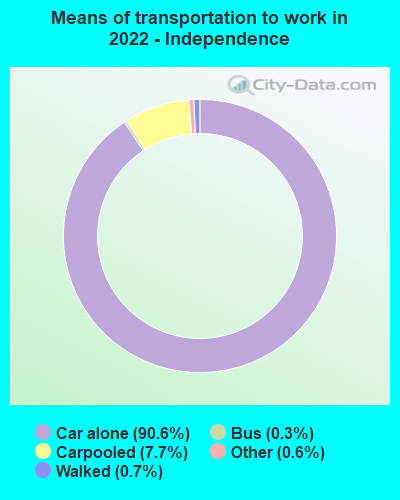
Means of transportation to work
Type
Kansas City
Independence
Bicycle
0.4%
0.1%
Bus
1.5%
0.3%
Carpooled
8.7%
7.2%
Car alone
86.8%
91.2%
Taxicab
0.2%
0.1%
Walked
1.3%
0.6%
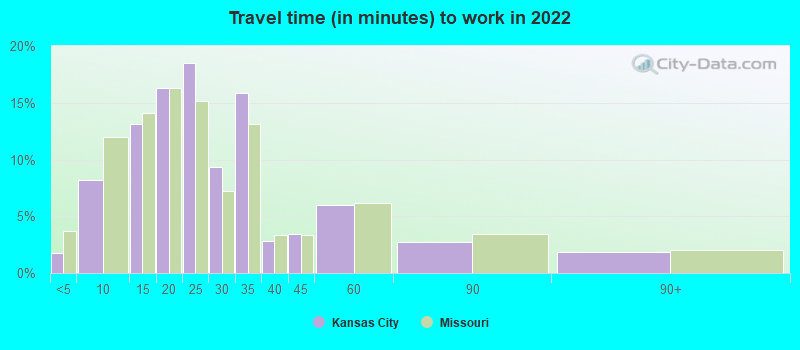
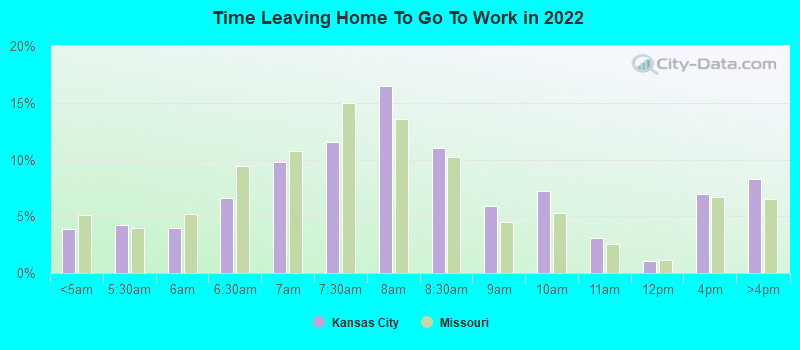
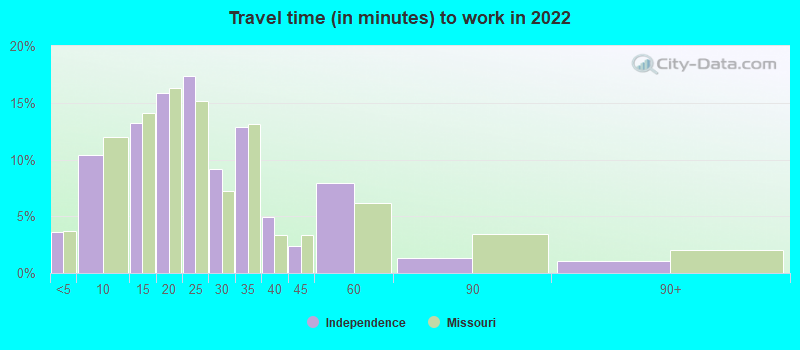
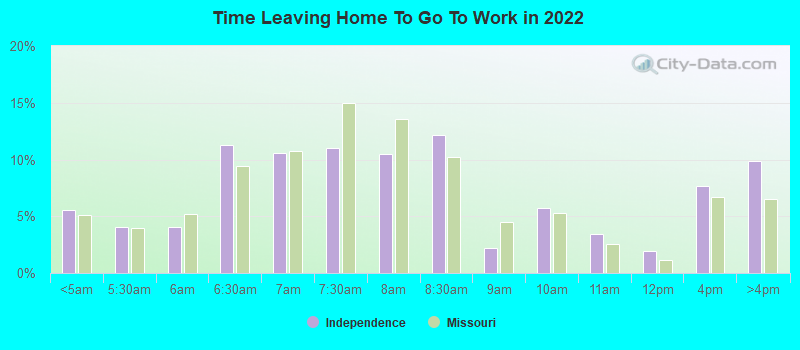
Average travel time to work
Type
Kansas City
Independence
Average
25.5 min
25.7 min
Other means
21.7 min
24.8 min
Public transportation
38.9 min
40.1 min
Private vehicle occupancy
Type
Kansas City
Independence
Average
1.1
1.1
Drove alone
89.4%
91.2%
In 2 person carpool
8%
7.7%
In 3 person carpool
2.1%
0.5%
In 4 person carpool
0.3%
0.3%
In 5-6 person carpool
0.2%
0.3%
How many people usually rode to work in the car, truck or van.
Real Estate
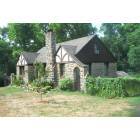
Real estate in Kansas City offers a wide range of options from downtown apartments to suburban single-family homes. Independence offers more affordable housing options, many featuring spacious yards and quiet neighborhood settings.
Neighborhoods
Both Kansas City and Independence offer a variety of neighborhoods. Kansas City has more diverse options, from the artsy Crossroads district to the upscale Country Club Plaza. Independence is known for its charming, community-oriented neighborhoods such as Truman Heritage and Rock Creek.
Houses and residents
Type
Kansas City
Independence
Houses
243,950
57,486
Average household size (people)
2.3
2.4
Median year apartment built
1975
1972
Median year house/condo built
1967
1966
Length of stay in the house since moving in
12 years
13.7 years
Houses occupied
219,020 (89.8%)
53,057 (92.3%)
Houses occupied by owners
118,384 (54.1%)
33,922 (63.9%)
Houses occupied by renters
100,636 (45.9%)
19,135 (36.1%)
Median rent asked for vacant for-rent units
$933.71
$1,228
Median monthly housing costs
$1,092
$899
Median price asked for vacant for-sale houses and condos
$71,644
$95,937
Estimated median house or condo value
$213,400
$154,700
Median numbers of rooms
5.5
5.5
Median number of rooms in apartments
4.3
4.3
Median number of rooms in houses and condos
6.6
6.2
Median house age
52
53
Renting percentage
43.8%
34.3%
Housing density (houses/condos per square mile)
778
733.9
House value disparities
36%
29.5%
Household income disparities
43.9%
42%
Median household income for houses/condes with a mortgage
$96,255
$82,045
Median household income for apartments without a mortgage
$64,961
$52,736
Housing units without a mortgage
1,566 (2%)
848 (4%)
Housing units with both a second mortgage and home equity loan
5,650 (7.2%)
539 (2.6%)
Housing units with a mortgage
77,422 (98%)
20,264 (96%)
Housing units with a home equity loan
403 (0.5%)
0 (0%)
Housing units with a second mortgage
6,848 (8.7%)
667 (3.2%)
House/condo owner moved in on average (years ago)
9
12
House/condo renter moved in on average (years ago)
1
3
Housing units lacking complete kitchen facilities
3.8%
2.2%
Housing units lacking complete plumbing facilities
2.2%
0.4%
Housing units in structures
Housing units in structures
Kansas City
Independence
One, detached
60.7%
72.5%
One, attached
3.9%
5.7%
Two
3.1%
2.6%
3 or 4
4.4%
2.5%
5 to 9
5.8%
4.1%
10 to 19
6.2%
4.8%
20 to 49
5.8%
1.6%
50 or more
9.3%
3.5%
Mobile homes
0.6%
2.6%
Boats, RVs, vans, etc.
0.1%
0.1%
Median real estate property taxes paid for housing units
Self-employed workers in own not incorporated business
13,035
2,217
State government workers
6,835
1,762
Unpaid family workers
197
0
Industries and Occupations
The healthcare and social assistance sector is Kansas City's largest industry, followed by retail trade and professional services. Independence, on the other hand, is largely dominated by the healthcare industry, retail trade, and education.
Health diagnosing and treating practitioners and other technical occupations
7.2%
4.4%
Healthcare support occupations
5.8%
7.0%
Food preparation and serving related occupations
5.0%
6.6%
Personal care and service occupations
4.2%
4.8%
Health technologists and technicians
3.7%
2.9%
Community and social service occupations
3.1%
0.8%
Material moving occupations
2.8%
5.7%
Production occupations
2.6%
2.5%
Computer and mathematical occupations
2.4%
0.0%
Arts, design, entertainment, sports, and media occupations
2.2%
0.9%
Building and grounds cleaning and maintenance occupations
2.1%
1.0%
Life, physical, and social science occupations
1.8%
0.0%
Legal occupations
1.4%
0.7%
Firefighting and prevention, and other protective service workers including supervisors
1.4%
0.8%
Transportation occupations
0.6%
3.5%
Health Care
Kansas City hosts numerous major hospitals and healthcare providers, including the University of Kansas Hospital and Saint Luke’s Hospital. Independence also offers quality care options, such as the Centerpoint Medical Center.
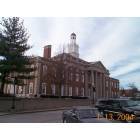
Kansas City boasts significant infrastructure developments, including a modern downtown, vast public spaces, and cultural landmarks. Infrastructure in Independence includes a variety of residential communities, retail spaces, and historical landmarks.
HMDA - Conventional home purchase loans - Applications denied
Year
Kansas City
Independence
1999
1,565
399
2000
1,758
296
2001
1,494
228
2002
1,380
219
2003
1,975
377
2004
3,011
576
2005
3,470
743
2006
3,499
716
2007
2,228
408
2008
742
147
2009
447
69
Culture and Food
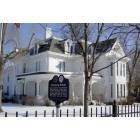
Kansas City is known for its jazz history, vibrant arts scene, and world-renowned BBQ. Independence, while smaller, still boasts a rich cultural heritage, being the hometown of President Truman, and offers an array of dining options often featuring local Missouri fare.
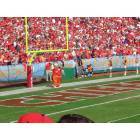
Sports Teams
Kansas City is home to the Kansas City Chiefs (NFL) and the Kansas City Royals (MLB). Independence does not host major league teams but offers various local and community sports opportunities.


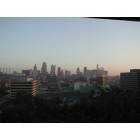


 Kansas City, MO
 Independence, MO