Las Vegas, in Nevada, and Glendale, Arizona are two well-known cities in the Southwestern United States, with distinctive features that draw both tourists and residents alike. From the bustling Las Vegas Strip with its iconic casinos and entertainment, to Glendale's smaller town charm and warm, inviting community, both offer uniquely differing environments. Key areas to consider when comparing the two include crime and safety, weather, cost of living, education, work and economy, infrastructure, industries, major employers, real estate, neighborhoods, transportation and commuting, taxes, culture and food, professional sports teams, geographical conditions, and healthcare facilities.
Distance between
Las Vegas, NV and
Glendale, AZ : 248.9 miles
Las Vegas's population is larger by 159%. Its population has grown by 168,356 people (35.2%) since 2000. The population of Glendale has grown by 30,818 people (14.1%) during that time.
Las Vegas is famous for its vibrant nightlife, which may contribute to a higher crime rate compared to Glendale. However, crime in Las Vegas is mostly localized to certain areas. Glendale's overall crime rate is much lower than that of Las Vegas. Several initiatives are place in both cities to maintain and improve community safety.
City-data.com crime index counts serious crimes and violent crime more heavily. It adjusts for the number of visitors and daily workers commuting into cities. (higher means more crime, U.S. average = 301.1)
City-data.com crime index counts serious crimes and violent crime more heavily. It adjusts for the number of visitors and daily workers commuting into cities. (higher means more crime, U.S. average = 301.1)
Sex Offenders
According to our data, there are 4,787 registered sex offenders living in Las Vegas and 373 registered sex offenders living in . The ratio of residents to sex offenders in Las Vegas is 132 to 1; the ratio in Glendale is 659 to 1. The number of registered sex offenders compared to the number of residents is much larger in Las Vegas than that in Glendale.
Cost of Living
Cost of living is generally higher in Las Vegas than in Glendale, primarily due to housing and entertainment costs. However, the actual difference can depend on personal lifestyle and spending habits.
Income Tax
Nevada does not have a state income tax, a definite attraction for those considering moving to Las Vegas. Arizona does levy a state income tax.
Property Tax
Although the property tax rate in Glendale, Arizona is slightly higher than that in Las Vegas, the overall cost may still be lower due to the generally lower property values in Glendale.
Sales Tax
Nevada has a higher sales tax rate than Arizona. However, the actual tax paid can depend on the specific items purchased and certain exemptions.
Income
Type
Las Vegas
Glendale
Estimated median household income
$59,746
$62,910
Estimated per capita income
$33,825
$28,898
Cost of living index (U.S. average is 100)
99.1
100.6
If you make $50,000 in Las Vegas, you will have to make $50,757 in Glendale to maintain the same standard of living.
Geographical Conditions
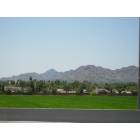
Las Vegas is located within the Mojave Desert, with surrounding mountains that offer hiking opportunities. Glendale, part of the Greater Phoenix metropolitan area, also offers mountainous landscapes and desert terrain perfect for outdoor adventures.
Both cities boast good education options, though Las Vegas has more choices by virtue of its larger population. Both cities have numerous public and private schools as well as post-secondary institutions.
The economies of both cities are increasingly diverse. Las Vegas, once heavily dependent on entertainment and tourism, now has a burgeoning tech and healthcare sector. Glendale's economy, on the other hand, is bolstered by manufacturing, healthcare, and retail trade.
Biggest Employers
The largest employers in Las Vegas are the MGM Grand and Caesars Entertainment. Meanwhile, Honeywell Aerospace and the Banner Health System are top employers in Glendale.
There were 2,700 building permits issued in Las Vegas in 2012 (1886 more than in 2011) compared to 713 building permits issued in Glendale in 2012 (572 more than in 2011).
In Las Vegas (Clark County), 56.4% voted for Democrats and 41.8% for Republicans in 2012 Presidential Election. In Glendale (Maricopa County), 43.6% voted for Democrats and 54.3% for Republicans.
Elections
Type
Democrats
Republicans
Other
Year
Las Vegas
Glendale
Las Vegas
Glendale
Las Vegas
Glendale
2020
53.7%
50.2%
44.3%
48.0%
2.0%
1.8%
2016
52.4%
44.9%
41.7%
47.7%
5.8%
7.5%
2012
56.4%
43.6%
41.8%
54.3%
1.8%
2.1%
2008
58.5%
44.0%
39.5%
54.5%
2.0%
1.5%
2004
51.8%
42.4%
46.9%
57.0%
1.3%
0.6%
2000
51.4%
43.0%
44.8%
53.4%
3.8%
3.6%
1996
75.5%
44.5%
18.8%
47.2%
5.7%
8.2%
Breakdown of population affiliated with a religious congregation
Type
Adherents
Congregations
Religion
Las Vegas
Glendale
Las Vegas
Glendale
CATHOLIC CHURCH
18.1%
13.6%
4.0%
4.3%
SOUTHERN BAPTIST CONVENTION
1.6%
1.9%
11.2%
6.5%
EVANGELICAL LUTHERAN CHURCH IN AMERICA
0.4%
0.8%
1.6%
2.0%
LUTHERAN CHURCH
0.2%
0.5%
1.2%
1.5%
SEVENTH DAY ADVENTIST CHURCH
0.2%
0.4%
1.6%
2.0%
EPISCOPAL CHURCH
0.1%
0.3%
1.1%
1.3%
Weather
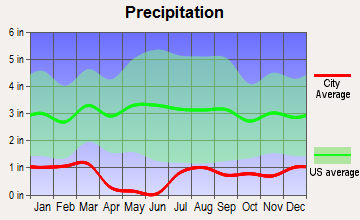
Both Las Vegas and Glendale experience desert climates with hot summers and mild winters. Glendale, being a part of the metropolitan area of Phoenix, gets slightly more rainfall than Las Vegas which lies in the Mojave Desert, the driest desert in North America.
Weather and climate
Type
Las Vegas
Glendale
Temperature - Average
65.5°F
72.6°F
Humidity - Average morning or afternoon humidity
30.7%
37.5%
Humidity - Differences between morning and afternoon humidity
42%
48%
Humidity - Maximum monthly morning or afternoon humidity
52%
60%
Humidity - Minimum monthly morning or afternoon humidity
10%
12%
Precipitation - Yearly average
5.7 in
9 in
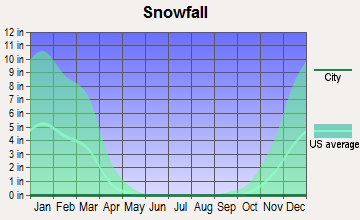
Snowfall - Yearly average
1.6 in
0 in
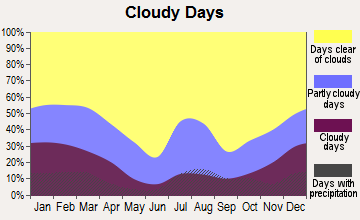
Clouds - Number of days clear of clouds
35.1%
35.3%
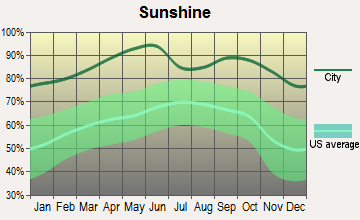
Sunshine amount - Average
91.8%
92.8%
Sunshine amount - Differences during a year
16%
16%
Sunshine amount - Maximum monthly
92%
95%
Sunshine amount - Minimum monthly
76%
79%
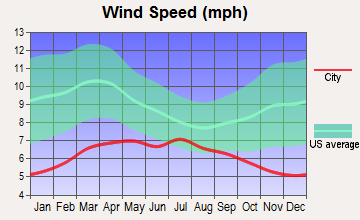
Wind speed - Average
9.2 mph
6.6 mph
Average climate in Las Vegas, Nevada
Average climate in Glendale, Arizona
Air pollution
Type
AQI
CO
NO2
OZONE
PM10
PM25
SO2
Year
Las Vegas
Glendale
Las Vegas
Glendale
Las Vegas
Glendale
Las Vegas
Glendale
Las Vegas
Glendale
Las Vegas
Glendale
Las Vegas
Glendale
2018
100
155
0.42
0.38
13.1
15.3
37.2
29.7
24.4
24.1
6.0
7.4
0.7
0.6
2017
101
117
0.29
0.40
13.0
16.0
38.5
28.8
20.3
22.7
7.3
6.8
0.8
1.4
2016
97
114
0.38
0.39
11.2
15.6
36.5
29.7
20.6
22.5
8.7
6.8
0.8
0.4
2015
92
101
0.36
0.38
12.4
17.0
35.6
28.5
18.9
18.9
8.4
7.0
1.2
0.9
2014
91
116
0.40
0.38
10.8
19.0
36.5
29.5
21.1
28.0
9.2
7.8
1.4
1.1
2013
103
127
0.45
0.39
9.6
19.3
36.9
30.4
22.1
28.2
8.6
7.6
1.5
0.9
2012
94
125
0.49
0.33
5.9
20.6
38.5
29.7
21.5
34.7
8.3
8.8
1.4
1.3
2011
85
162
0.40
0.36
5.3
19.2
37.5
29.8
18.2
32.8
7.8
9.2
1.2
0.9
2010
86
100
0.50
0.38
5.7
18.9
36.6
28.2
16.1
23.3
7.1
8.3
N/A
1.0
2009
87
101
0.56
0.35
6.0
19.0
33.3
27.1
20.9
34.1
8.3
N/A
N/A
1.6
2008
82
106
0.66
0.41
8.2
20.3
33.0
27.6
N/A
37.8
9.2
N/A
N/A
2.1
2007
97
127
0.61
0.41
11.7
22.3
32.4
25.9
N/A
46.1
8.6
N/A
0.1
2.3
2006
102
127
0.75
0.46
13.4
24.4
32.7
26.8
N/A
49.1
8.3
N/A
0.8
2.2
2005
100
106
0.76
0.59
15.1
24.9
30.2
24.4
N/A
40.6
7.8
N/A
5.3
2.4
2004
85
96
0.71
0.61
16.0
24.6
30.6
23.7
N/A
31.3
N/A
N/A
1.6
1.4
2003
99
99
0.67
0.67
15.9
25.8
29.8
24.2
N/A
42.6
N/A
N/A
1.0
1.4
2002
94
106
0.73
0.78
15.7
27.3
30.6
25.0
N/A
41.8
N/A
N/A
0.7
1.6
2001
95
104
0.76
0.80
15.0
27.0
29.4
24.1
N/A
37.8
N/A
N/A
1.1
1.5
2000
95
118
0.88
0.85
14.7
29.3
29.7
23.9
N/A
45.6
N/A
N/A
0.4
1.7
Natural disasters
Type
Las Vegas
Glendale
Tornado activity compared to U.S. average
2.1%
17.5%
Earthquake activity compared to U.S. average
6,093.4%
2,698.7%
Natural disasters compared to U.S. average
12%
16%
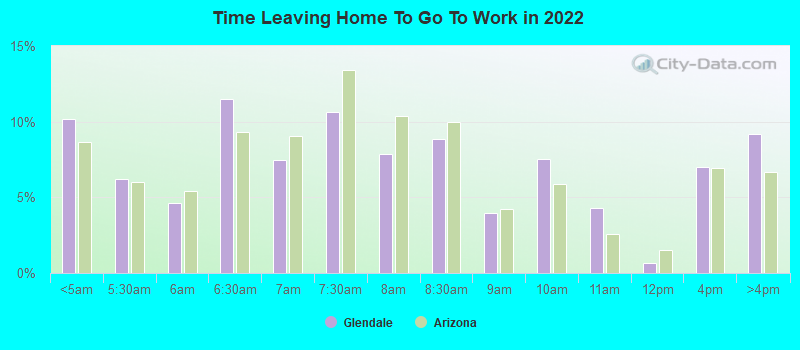
Transportation
Both cities have well-developed public transportation systems. Las Vegas offers more in terms of variety and frequency because of the heavy inflow of tourists, while public transportation in Glendale is more targeted towards residents.
Transport
Type
Las Vegas
Glendale
Amtrak stations
1
0
Amtrak stations nearby
1
3
FAA registered aircraft
1
212
FAA registered aircraft manufacturers and dealers
81
4
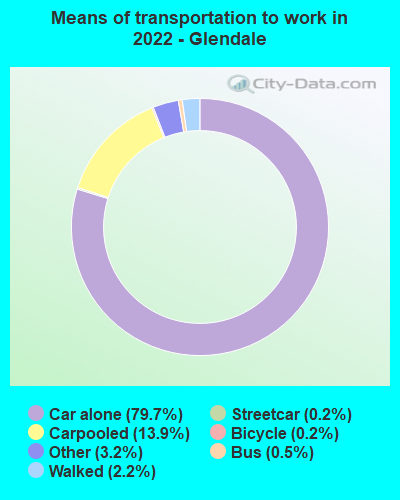
Means of transportation to work
Type
Las Vegas
Glendale
Bicycle
0.1%
0.5%
Bus
2.2%
0.7%
Carpooled
10.3%
10.6%
Car alone
82.7%
82.1%
Motorcycle
0.4%
0.4%
Railroad
0%
0.4%
Walked
1.4%
2.1%
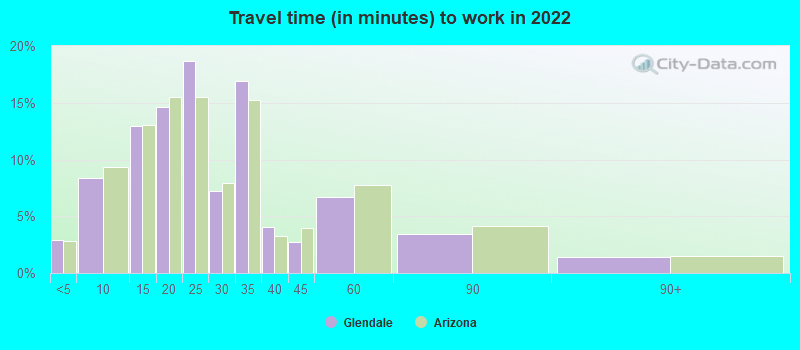
Average travel time to work
Type
Las Vegas
Glendale
Average
26.3 min
25.2 min
Other means
24 min
28.8 min
Public transportation
49.9 min
51.2 min
Private vehicle occupancy
Type
Las Vegas
Glendale
Average
1.2
1.2
Drove alone
88.9%
87%
In 2 person carpool
8.2%
9.1%
In 3 person carpool
2.1%
1.9%
In 4 person carpool
0.2%
1.5%
In 5-6 person carpool
0.4%
0.4%
In 7+ person carpool
0.2%
0%
How many people usually rode to work in the car, truck or van.
Real Estate
Las Vegas offers a broader range of housing prices because of its larger size, while Glendale's real estate market is less diverse but generally more affordable.
Neighborhoods
While Las Vegas has neighborhoods that provide a mix of urban living and suburban comfort, Glendale offers family-friendly neighborhoods with a more laid-back ambiance.
Houses and residents
Type
Las Vegas
Glendale
Houses
269,602
95,584
Average household size (people)
2.7
2.8
Median year apartment built
1991
1985
Median year house/condo built
1995
1985
Length of stay in the house since moving in
10.1 years
11.9 years
Houses occupied
250,350 (92.9%)
90,604 (94.8%)
Houses occupied by owners
138,677 (55.4%)
52,463 (57.9%)
Houses occupied by renters
111,673 (44.6%)
38,141 (42.1%)
Median rent asked for vacant for-rent units
$1,176
$1,437
Median monthly housing costs
$1,255
$1,164
Median price asked for vacant for-sale houses and condos
$989,410
$439,560
Estimated median house or condo value
$362,400
$325,400
Median numbers of rooms
5.2
5.4
Median number of rooms in apartments
4.1
4.2
Median number of rooms in houses and condos
6.1
6.2
Median house price - detached houses
$439,169
$375,185
Median house price - in 2-unit structures
$161,204
$398,444
Median house price - in 3-to-4-unit structures
$201,871
$141,298
Median house price - in 5 or more unit structures
$327,174
$181,007
Median house price - mobile homes
$113,235
$76,848
Median house price - Townhouses or other attached units
$274,961
$198,617
Median house price - All housing units
$417,434
$343,063
Median house age
27
36
Renting percentage
43.5%
41.4%
Housing density (houses/condos per square mile)
2,379.4
1,716.5
House value disparities
27.1%
26.6%
Household income disparities
47.1%
43%
Median household income for houses/condes with a mortgage
$90,388
$93,755
Median household income for apartments without a mortgage
$62,287
$63,125
Housing units without a mortgage
1,172 (1.2%)
971 (2.7%)
Housing units with both a second mortgage and home equity loan
4,450 (4.6%)
1,564 (4.3%)
Housing units with a mortgage
95,992 (98.8%)
35,213 (97.3%)
Housing units with a home equity loan
178 (0.2%)
294 (0.8%)
Housing units with a second mortgage
5,092 (5.2%)
2,964 (8.2%)
House/condo owner moved in on average (years ago)
7
10
House/condo renter moved in on average (years ago)
2
1
Housing units lacking complete kitchen facilities
1.3%
1.4%
Housing units lacking complete plumbing facilities
1%
1.3%
Housing units in structures
Housing units in structures
Las Vegas
Glendale
One, detached
61.5%
61.3%
One, attached
5.3%
5.4%
Two
1.3%
1.0%
3 or 4
7.7%
4.5%
5 to 9
8.4%
5.7%
10 to 19
4.8%
6.2%
20 to 49
2.8%
3.6%
50 or more
6.8%
7.5%
Mobile homes
1.4%
4.7%
Boats, RVs, vans, etc.
0.1%
0.1%
Median real estate property taxes paid for housing units
Self-employed workers in own not incorporated business
18,990
6,484
State government workers
6,950
4,087
Unpaid family workers
614
557
Industries and Occupations
Leading industries in Las Vegas include hospitality and leisure, education and health, and professional and business services. In Glendale, top industries include manufacturing, retail trade, and healthcare.
Las Vegas and Glendale both have excellent healthcare facilities. Las Vegas is home to a larger number of hospitals due to its greater population, but both cities offer excellent care.
Health (county statistics)
Type
Las Vegas
Glendale
General health status score of residents in this county from 1 (poor) to 5 (excellent)
Las Vegas boasts a much larger airport and infrastructure developed around tourism, while Glendale’s infrastructure is more residential and business-oriented.
Infrastructure
Type
Las Vegas
Glendale
Hospitals
39
6
TV stations
12
16
Arenas or stadiums
2
2
Bank branches located here
281
54
Bank institutions located here
34
13
Main business address for public companies
57
1
Drinking water stations with no reported violations in the past
32
1
Drinking water stations with reported violations in the past
HMDA - Conventional home purchase loans - Applications denied
Year
Las Vegas
Glendale
1999
2,657
1,225
2000
579
1,072
2001
371
758
2002
380
575
2003
3,590
944
2004
5,908
1,514
2005
7,894
2,408
2006
6,914
2,586
2007
3,733
1,238
2008
1,431
371
2009
813
229
Culture and Food
Las Vegas is renowned worldwide for its vibrant cultural scene and its extensive array of dining options. However, Glendale also has a thriving local culture and an impressive selection of local cuisine.
Sports Teams
Las Vegas is home to the Las Vegas Raiders (NFL) and the Golden Knights (NHL), while Glendale hosts the Arizona Cardinals (NFL) and the Arizona Coyotes (NHL). For fans of professional sports, both cities have plenty to offer.


 Las Vegas, NV
 Glendale, AZ