Las Vegas, NV, and Kansas City, MO, offer unique attractions for both locals and visitors, although they differ greatly in lifestyle, culture, and environment. Vegas is known for its vibrant nightlife and strong service industry, while Kansas City's economy thrives on a mix of sectors. Both cities have their pros and cons when it comes to key aspects of daily life like crime rates, cost of living, transportation, and climate.
Distance between
Las Vegas, NV and
Kansas City, MO : 1,145.5 miles
Las Vegas's population is larger by 27%. Its population has grown by 168,356 people (35.2%) since 2000. The population of Kansas City has grown by 66,849 people (15.1%) during that time.
When it comes to crime and safety, both cities are similar in that their crime rates are higher than the national average. However, Las Vegas' violent crime rate is lower than Kansas City's. Safety measures such as CCTV and police presence are common in popular areas in Vegas, thanks to its bustling tourism industry. Kansas City has been focusing on strategies to lower its crime rate, including community policing efforts.
City-data.com crime index counts serious crimes and violent crime more heavily. It adjusts for the number of visitors and daily workers commuting into cities. (higher means more crime, U.S. average = 301.1)
City-data.com crime index counts serious crimes and violent crime more heavily. It adjusts for the number of visitors and daily workers commuting into cities. (higher means more crime, U.S. average = 301.1)
Sex Offenders
According to our data, there are 4,789 registered sex offenders living in Las Vegas and 1,794 registered sex offenders living in . The ratio of residents to sex offenders in Las Vegas is 132 to 1; the ratio in Kansas City is 268 to 1. The number of registered sex offenders compared to the number of residents is larger in Las Vegas than in Kansas City.
Cost of Living
Generally, the cost of living is lower in Kansas City than in Las Vegas. Housing costs contribute significantly to this difference—Kansas City has a more affordable housing market compared to Vegas. Groceries, utilities, and health care also tend to be cheaper in Kansas City.
Income Tax
One of Las Vegas's biggest draws is that Nevada does not have a state income tax, a considerable advantage for many people. On the contrary, Missouri does levy a state income tax, which ranges between 1.5% and 5.9% depending on income.
Property Tax
Property tax in Kansas City is relatively high compared to the national average, particularly in the city's suburban areas. Conversely, Las Vegas has lower property tax rates due to Nevada's overall low taxation levels.
Sales Tax
The sales tax in Las Vegas is slightly higher than the national average, at 8.375%. Kansas City also has a relatively high sales tax, at 9.125% when combined city and state tax levels are considered.
Income
Type
Las Vegas
Kansas City
Estimated median household income
$59,746
$63,396
Estimated per capita income
$33,825
$36,456
Cost of living index (U.S. average is 100)
99.1
87.3
If you make $50,000 in Kansas City, you will have to make $56,758 in Las Vegas to maintain the same standard of living.
Geographical Conditions
Las Vegas is located in a desert and is surrounded by mountain ranges, while Kansas City is positioned near the confluence of the Missouri and Kansas rivers, with a mix of flatlands and rolling hills.
In terms of education, both cities provide a mix of public and private schools, with Kansas City boasting a slightly higher graduation rate. Both cities also host several renowned colleges and universities, with the University of Nevada, Las Vegas and the University of Missouri, Kansas City being among the most prominent.
When it comes to work and economy, Las Vegas heavily relies on its tourism, entertainment, and hospitality industries. Kansas City offers a more diverse economy, with healthcare, finance, and government being major sectors. Unemployment rates in both cities are comparable to the national average.
Biggest Employers
The biggest employers in Las Vegas are mainly casinos and hotels including MGM Resorts International and Caesars Entertainment. Major employers in Kansas City include Cerner Corporation, the University of Kansas Medical Center, and the federal government.
In Las Vegas (Clark County), 56.4% voted for Democrats and 41.8% for Republicans in 2012 Presidential Election. In Kansas City (Jackson County), 58.9% voted for Democrats and 39.3% for Republicans.
Elections
Type
Democrats
Republicans
Other
Year
Las Vegas
Kansas City
Las Vegas
Kansas City
Las Vegas
Kansas City
2020
53.7%
60.1%
44.3%
38.1%
2.0%
1.8%
2016
52.4%
55.5%
41.7%
38.1%
5.8%
6.4%
2012
56.4%
58.9%
41.8%
39.3%
1.8%
1.7%
2008
58.5%
62.1%
39.5%
36.8%
2.0%
1.1%
2004
51.8%
58.2%
46.9%
41.4%
1.3%
0.4%
2000
51.4%
59.0%
44.8%
38.4%
3.8%
2.5%
1996
75.5%
56.2%
18.8%
34.3%
5.7%
9.5%
Breakdown of population affiliated with a religious congregation
Type
Adherents
Congregations
Religion
Las Vegas
Kansas City
Las Vegas
Kansas City
CATHOLIC CHURCH
18.1%
10.3%
4.0%
6.4%
SOUTHERN BAPTIST CONVENTION
1.6%
9.5%
11.2%
13.7%
EVANGELICAL LUTHERAN CHURCH IN AMERICA
0.4%
0.2%
1.6%
1.0%
AMERICAN BAPTIST CHURCHES IN THE USA
0.2%
0.3%
1.4%
1.4%
LUTHERAN CHURCH
0.2%
1.4%
1.2%
1.8%
SEVENTH DAY ADVENTIST CHURCH
0.2%
0.5%
1.6%
1.0%
EPISCOPAL CHURCH
0.1%
0.8%
1.1%
1.7%
MUSLIM ESTIMATE
0.1%
0.4%
0.6%
1.1%
SALVATION ARMY
0.1%
0.4%
0.5%
0.6%
Weather
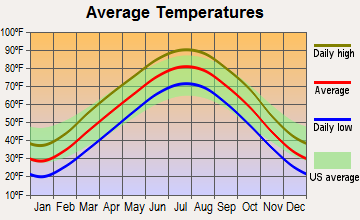
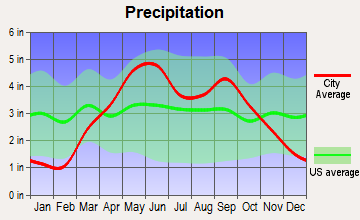
Weather-wise, Las Vegas and Kansas City offer drastically different climates. Las Vegas is known for its hot desert climate, with long, sizzling summers, mild winters, and little rainfall throughout the year. On the other hand, Kansas City experiences a humid continental climate. It has hot summers and cold winters, with moderate to heavy rainfall spread throughout the year.
Weather and climate
Type
Las Vegas
Kansas City
Temperature - Average
65.5°F
56.2°F
Humidity - Average morning or afternoon humidity
30.7%
76.3%
Humidity - Differences between morning and afternoon humidity
42%
30.1%
Humidity - Maximum monthly morning or afternoon humidity
52%
86%
Humidity - Minimum monthly morning or afternoon humidity
10%
56%
Precipitation - Yearly average
5.7 in
36.3 in
Snowfall - Yearly average
1.6 in
38 in
Clouds - Number of days clear of clouds
35.1%
20.1%
Sunshine amount - Average
91.8%
67.3%
Sunshine amount - Differences during a year
16%
25.9%
Sunshine amount - Maximum monthly
92%
74%
Sunshine amount - Minimum monthly
76%
48%
Wind speed - Average
9.2 mph
11.2 mph
Average climate in Las Vegas, Nevada
Average climate in Kansas City, Missouri
Air pollution
Type
AQI
CO
NO2
OZONE
PM10
PM25
SO2
Year
Las Vegas
Kansas City
Las Vegas
Kansas City
Las Vegas
Kansas City
Las Vegas
Kansas City
Las Vegas
Kansas City
Las Vegas
Kansas City
Las Vegas
Kansas City
2018
100
89
0.42
0.29
13.1
11.1
37.2
29.6
24.4
24.5
6.0
7.4
0.7
0.9
2017
101
88
0.29
0.29
13.0
11.6
38.5
30.4
20.3
26.7
7.3
10.0
0.8
1.4
2016
97
85
0.38
0.30
11.2
12.0
36.5
28.9
20.6
24.9
8.7
9.0
0.8
1.5
2015
92
90
0.36
0.30
12.4
12.9
35.6
28.9
18.9
33.6
8.4
8.3
1.2
4.6
2014
91
90
0.40
0.28
10.8
13.0
36.5
28.6
21.1
28.5
9.2
9.3
1.4
5.0
2013
103
88
0.45
0.41
9.6
13.2
36.9
29.3
22.1
30.8
8.6
10.3
1.5
5.6
2012
94
105
0.49
0.52
5.9
14.2
38.5
31.9
21.5
N/A
8.3
10.3
1.4
6.4
2011
85
108
0.40
0.45
5.3
15.0
37.5
29.9
18.2
N/A
7.8
10.9
1.2
4.8
2010
86
97
0.50
0.40
5.7
15.0
36.6
27.4
16.1
N/A
7.1
11.9
N/A
5.4
2009
87
96
0.56
0.29
6.0
14.8
33.3
28.3
20.9
N/A
8.3
9.6
N/A
6.1
2008
82
89
0.66
0.40
8.2
17.0
33.0
25.7
N/A
N/A
9.2
11.5
N/A
6.0
2007
97
104
0.61
0.42
11.7
18.4
32.4
29.1
N/A
N/A
8.6
13.1
0.1
4.2
2006
102
104
0.75
0.36
13.4
18.5
32.7
29.2
N/A
N/A
8.3
12.4
0.8
5.1
2005
100
105
0.76
0.55
15.1
18.3
30.2
28.4
N/A
N/A
7.8
N/A
5.3
4.5
2004
85
83
0.71
0.45
16.0
11.6
30.6
26.2
N/A
N/A
N/A
N/A
1.6
4.0
2003
99
99
0.67
0.41
15.9
10.9
29.8
28.0
N/A
N/A
N/A
N/A
1.0
3.0
2002
94
100
0.73
0.40
15.7
8.9
30.6
27.0
N/A
N/A
N/A
N/A
0.7
2.5
2001
95
88
0.76
0.52
15.0
7.9
29.4
27.0
N/A
N/A
N/A
N/A
1.1
1.2
2000
95
102
0.88
0.75
14.7
8.8
29.7
29.2
N/A
N/A
N/A
N/A
0.4
2.2
Natural disasters
Type
Las Vegas
Kansas City
Tornado activity compared to U.S. average
2.1%
200.4%
Earthquake activity compared to U.S. average
6,093.4%
598.9%
Natural disasters compared to U.S. average
12%
24%
Transportation
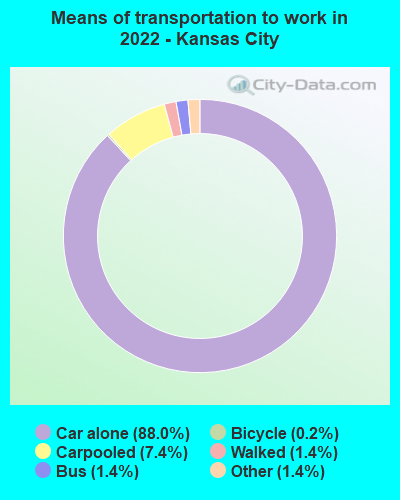
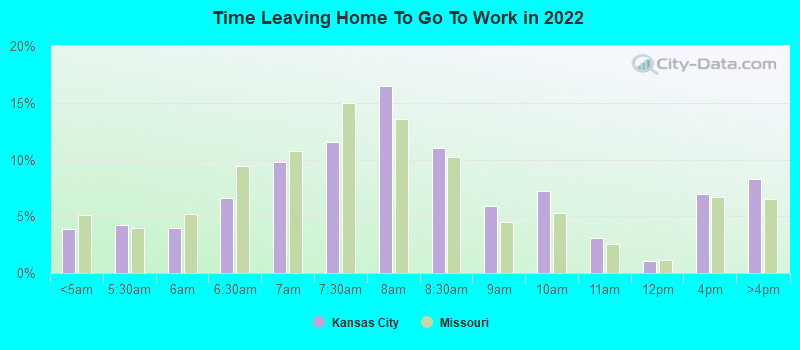
Las Vegas's public transit system primarily accommodates tourists and involves the use of buses, monorails, and taxis focused around The Strip. Kansas City has a more comprehensive public transportation system, including buses and a light rail system, that supports daily commuting.
Transport
Type
Las Vegas
Kansas City
Amtrak stations
1
1
Amtrak stations nearby
1
3
FAA registered aircraft
1
0
FAA registered aircraft manufacturers and dealers
81
0
Means of transportation to work
Type
Las Vegas
Kansas City
Bicycle
0.1%
0.4%
Bus
2.2%
1.5%
Carpooled
10.3%
8.7%
Car alone
82.7%
86.8%
Motorcycle
0.4%
0.1%
Taxicab
0%
0.2%
Walked
1.4%
1.3%
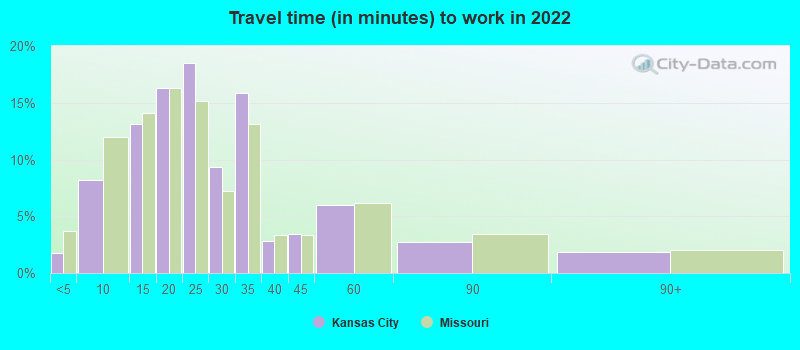
Average travel time to work
Type
Las Vegas
Kansas City
Average
26.3 min
25.5 min
Other means
24 min
21.7 min
Public transportation
49.9 min
38.9 min
Private vehicle occupancy
Type
Las Vegas
Kansas City
Average
1.2
1.1
Drove alone
88.9%
89.4%
In 2 person carpool
8.2%
8%
In 3 person carpool
2.1%
2.1%
In 4 person carpool
0.2%
0.3%
In 5-6 person carpool
0.4%
0.2%
In 7+ person carpool
0.2%
0%
How many people usually rode to work in the car, truck or van.
Real Estate
Vegas's housing market is more competitive and expensive compared to Kansas City. However, Vegas offers high-end housing choices, catering to a more luxury lifestyle. Kansas City is known for its affordable real estate, with a variety of housing options from urban lofts to suburban homes.
Neighborhoods
Las Vegas neighborhoods are distinguished by their proximity to The Strip and have unique characteristics ranging from high-end luxury to family-friendly communities. Kansas City is known for its blend of historic and modern neighborhoods, each with unique cultural characteristics.
Houses and residents
Type
Las Vegas
Kansas City
Houses
269,602
243,950
Average household size (people)
2.7
2.3
Median year apartment built
1991
1975
Median year house/condo built
1995
1967
Length of stay in the house since moving in
10.1 years
12 years
Houses occupied
250,350 (92.9%)
219,020 (89.8%)
Houses occupied by owners
138,677 (55.4%)
118,384 (54.1%)
Houses occupied by renters
111,673 (44.6%)
100,636 (45.9%)
Median rent asked for vacant for-rent units
$1,176
$933.71
Median monthly housing costs
$1,255
$1,092
Median price asked for vacant for-sale houses and condos
$989,410
$71,644
Estimated median house or condo value
$362,400
$213,400
Median numbers of rooms
5.2
5.5
Median number of rooms in apartments
4.1
4.3
Median number of rooms in houses and condos
6.1
6.6
Median house price - detached houses
$439,169
$250,072
Median house price - in 2-unit structures
$161,204
$212,485
Median house price - in 3-to-4-unit structures
$201,871
$147,015
Median house price - in 5 or more unit structures
$327,174
$274,597
Median house price - mobile homes
$113,235
$19,650
Median house price - Townhouses or other attached units
$274,961
$203,232
Median house price - All housing units
$417,434
$247,285
Median house age
27
52
Renting percentage
43.5%
43.8%
Housing density (houses/condos per square mile)
2,379.4
778
House value disparities
27.1%
36%
Household income disparities
47.1%
43.9%
Median household income for houses/condes with a mortgage
$90,388
$96,255
Median household income for apartments without a mortgage
$62,287
$64,961
Housing units without a mortgage
1,172 (1.2%)
1,566 (2%)
Housing units with both a second mortgage and home equity loan
4,450 (4.6%)
5,650 (7.2%)
Housing units with a mortgage
95,992 (98.8%)
77,422 (98%)
Housing units with a home equity loan
178 (0.2%)
403 (0.5%)
Housing units with a second mortgage
5,092 (5.2%)
6,848 (8.7%)
House/condo owner moved in on average (years ago)
7
9
House/condo renter moved in on average (years ago)
2
1
Housing units lacking complete kitchen facilities
1.3%
3.8%
Housing units lacking complete plumbing facilities
1%
2.2%
Housing units in structures
Housing units in structures
Las Vegas
Kansas City
One, detached
61.5%
60.7%
One, attached
5.3%
3.9%
Two
1.3%
3.1%
3 or 4
7.7%
4.4%
5 to 9
8.4%
5.8%
10 to 19
4.8%
6.2%
20 to 49
2.8%
5.8%
50 or more
6.8%
9.3%
Mobile homes
1.4%
0.6%
Boats, RVs, vans, etc.
0.1%
0.1%
Median real estate property taxes paid for housing units
Self-employed workers in own not incorporated business
18,990
13,035
State government workers
6,950
6,835
Unpaid family workers
614
197
Industries and Occupations
Las Vegas is dominated by the service industry due to its tourism sector, while Kansas City has a more diverse range of industries and occupations. Kansas City is home to several large corporations in sectors such as healthcare, finance, and information technology.
Both Las Vegas and Kansas City provide robust healthcare options, with each city boasting multiple hospitals and clinics. However, healthcare costs in Las Vegas tend to be higher than in Kansas City.
Health (county statistics)
Type
Las Vegas
Kansas City
General health status score of residents in this county from 1 (poor) to 5 (excellent)
Infrastructure in Las Vegas primarily supports tourism, with the city boasting renowned hotels, casinos, and entertainment venues. Kansas City is known for its historical architecture and extensive network of boulevards, and also hosts several large corporations.
Infrastructure
Type
Las Vegas
Kansas City
Hospitals
39
30
TV stations
12
14
Arenas or stadiums
2
2
Bank branches located here
281
140
Bank institutions located here
34
41
Main business address for public companies
57
27
Drinking water stations with no reported violations in the past
32
0
Drinking water stations with reported violations in the past
HMDA - Conventional home purchase loans - Applications denied
Year
Las Vegas
Kansas City
1999
2,657
1,565
2000
579
1,758
2001
371
1,494
2002
380
1,380
2003
3,590
1,975
2004
5,908
3,011
2005
7,894
3,470
2006
6,914
3,499
2007
3,733
2,228
2008
1,431
742
2009
813
447
Culture and Food
Las Vegas is renowned for its vibrant nightlife, entertainment, and dining scene, offering a broad array of international cuisine, thanks to its global tourist base. Kansas City boasts a rich cultural heritage, with a thriving arts scene, multiple museums, and is world-famous for its barbeque food.
Sports Teams
Both cities are home to popular sports teams. Las Vegas hosts the Golden Knights (NHL) and the Raiders (NFL), while Kansas City is home to the Chiefs (NFL) and the Royals (MLB).


 Las Vegas, NV
 Kansas City, MO