Las Vegas and Reno, the two most populous cities in Nevada, each provide residents and visitors unique experiences with distinct features to offer. Las Vegas, famously known as a tourist's paradise, brings a diverse arena from entertainment to employment opportunities. On the other hand, Reno, "The Biggest Little City in the World", maintains a smaller, more manageable city vibe with close proximity to natural attractions. Now let's delve into a detailed comparison between these two cities across various parameters.
Distance between
Las Vegas, NV and
Reno, NV : 340.5 miles
Las Vegas's population is larger by 141%. Its population has grown by 168,356 people (35.2%) since 2000. The population of Reno has grown by 88,371 people (49.0%) during that time.
In terms of safety, both cities struggle with slightly higher than the national average crime rates, which may be attributed to their status as tourist hotspots. Crime in Las Vegas can be somewhat high, particularly in areas near the Strip where many tourists visit. Reno shares similar statistics but crime is more evenly distributed around the city. As always, the level of safety often depends on particular neighborhoods and staying aware of one's surroundings is always advised.
City-data.com crime index counts serious crimes and violent crime more heavily. It adjusts for the number of visitors and daily workers commuting into cities. (higher means more crime, U.S. average = 301.1)
City-data.com crime index counts serious crimes and violent crime more heavily. It adjusts for the number of visitors and daily workers commuting into cities. (higher means more crime, U.S. average = 301.1)
Sex Offenders
According to our data, there are 4,789 registered sex offenders living in Las Vegas and 1,263 registered sex offenders living in . The ratio of residents to sex offenders in Las Vegas is 132 to 1; the ratio in Reno is 194 to 1. The number of registered sex offenders compared to the number of residents is larger in Las Vegas than in Reno.
Cost of Living
Generally speaking, the cost of living is lower in Reno than in Las Vegas. Housing tends to be the biggest factor in the cost of living difference. Comparing the median home price in the two cities indicates that houses are notably cheaper in Reno. Grocery and healthcare expenses are also slightly lower.
Income Tax
Nevada is one of the few states in the U.S. without a state income tax, which applies to residents in both Las Vegas and Reno.
Property Tax
The average property tax rate in Las Vegas is slightly higher than in Reno. However, both cities have property tax rates that are lower than the national average.
Sales Tax
Both cities, being in Nevada, have the same state sales tax. Nevada has a base rate of 6.85% for sales tax, but with local taxes included, the total can reach as high as 8.37% in some areas. These rates apply to both Las Vegas and Reno.
Income
Type
Las Vegas
Reno
Estimated median household income
$59,746
$67,478
Estimated per capita income
$33,825
$37,989
Cost of living index (U.S. average is 100)
99.1
99.5
If you make $50,000 in Las Vegas, you will have to make $50,202 in Reno to maintain the same standard of living.
Geographical Conditions
Las Vegas is located in the Mojave Desert and offers unique desert landscapes while Reno rests near the Sierra Nevada mountains which provides residents with beautiful mountain views and easy access to outdoor activities.
Reno boasts a higher standard in education with the presence of the University of Nevada, Reno, and the Washoe County School District. The percentage of Reno residents with a bachelor's degree is higher than the state average. Las Vegas houses numerous institutes, including the University of Nevada, Las Vegas, but the city has a lower high school graduation rate compared to Reno.
Las Vegas has a diverse economy with a heavy emphasis on the service industry due to its thriving tourism sector. Other potential employment opportunities include leisure/hospitality, and retail. Reno's economy is also diverse and includes sectors like technology, healthcare, logistics industry, and gaming/tourism. The technology sector in Reno is flourishing, with notable companies like Tesla and Google having a presence.
Biggest Employers
As you might expect, the biggest employers in Las Vegas include MGM Resorts International and Caesars Entertainment. In Reno, the Reno-Sparks school district and the University of Nevada are among the largest employers. Additionally, companies like Tesla and Panasonic employ a significant number of people in Reno through the Gigafactory.
There were 2,700 building permits issued in Las Vegas in 2012 (1886 more than in 2011) compared to 1,414 building permits issued in Reno in 2012 (1095 more than in 2011).
In Las Vegas (Clark County), 56.4% voted for Democrats and 41.8% for Republicans in 2012 Presidential Election. In Reno (Washoe County), 50.8% voted for Democrats and 47.1% for Republicans.
Elections
Type
Democrats
Republicans
Other
Year
Las Vegas
Reno
Las Vegas
Reno
Las Vegas
Reno
2020
53.7%
50.8%
44.3%
46.3%
2.0%
2.9%
2016
52.4%
46.4%
41.7%
45.1%
5.8%
8.5%
2012
56.4%
50.8%
41.8%
47.1%
1.8%
2.1%
2008
58.5%
55.2%
39.5%
42.6%
2.0%
2.1%
2004
51.8%
47.2%
46.9%
51.4%
1.3%
1.4%
2000
51.4%
42.7%
44.8%
52.1%
3.8%
5.3%
1996
75.5%
21.0%
18.8%
72.1%
5.7%
7.0%
Breakdown of population affiliated with a religious congregation
Type
Adherents
Congregations
Religion
Las Vegas
Reno
Las Vegas
Reno
CATHOLIC CHURCH
18.1%
14.4%
4.0%
6.1%
SOUTHERN BAPTIST CONVENTION
1.6%
1.1%
11.2%
12.2%
EVANGELICAL LUTHERAN CHURCH IN AMERICA
0.4%
0.3%
1.6%
1.9%
LUTHERAN CHURCH
0.2%
0.4%
1.2%
0.9%
SEVENTH DAY ADVENTIST CHURCH
0.2%
0.4%
1.6%
1.9%
EPISCOPAL CHURCH
0.1%
0.4%
1.1%
3.3%
Weather
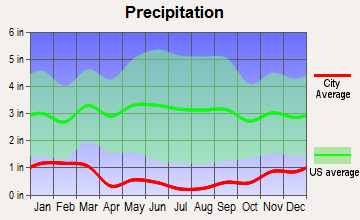
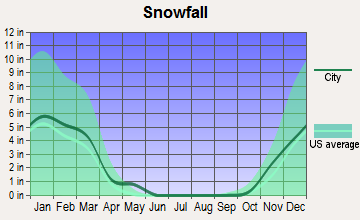
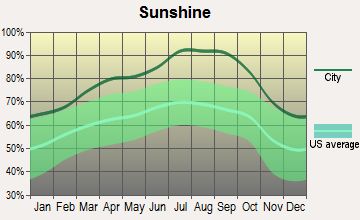
The weather between these two cities is noticeably different. Las Vegas is located in a desert, it gets extremely hot during summer reaching as high as 104°F. Reno, although it can be warm in the summer, sees milder temperatures and experiences all four seasons. Reno's relative proximity to the Sierra Nevada mountain range results in cooler and snow-heavy winters.
Weather and climate
Type
Las Vegas
Reno
Temperature - Average
65.5°F
51.1°F
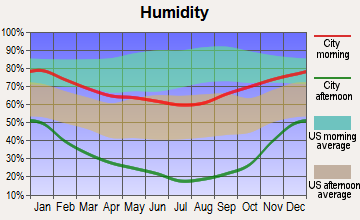
Humidity - Average morning or afternoon humidity
30.7%
51.3%
Humidity - Differences between morning and afternoon humidity
42%
57%
Humidity - Maximum monthly morning or afternoon humidity
52%
75%
Humidity - Minimum monthly morning or afternoon humidity
10%
18%
Precipitation - Yearly average
5.7 in
8.1 in
Snowfall - Yearly average
1.6 in
45 in
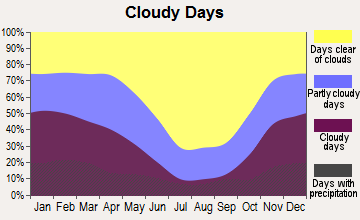
Clouds - Number of days clear of clouds
35.1%
26.3%
Sunshine amount - Average
91.8%
88.3%
Sunshine amount - Differences during a year
16%
30%
Sunshine amount - Maximum monthly
92%
95%
Sunshine amount - Minimum monthly
76%
65%
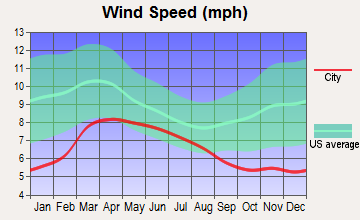
Wind speed - Average
9.2 mph
6.9 mph
Average climate in Las Vegas, Nevada
Average climate in Reno, Nevada
Air pollution
Type
AQI
CO
NO2
OZONE
PM10
PM25
SO2
Year
Las Vegas
Reno
Las Vegas
Reno
Las Vegas
Reno
Las Vegas
Reno
Las Vegas
Reno
Las Vegas
Reno
Las Vegas
Reno
2018
100
80
0.42
0.22
13.1
12.8
37.2
31.6
24.4
20.3
6.0
8.2
0.7
0.2
2017
101
87
0.29
0.22
13.0
12.9
38.5
31.7
20.3
19.0
7.3
7.5
0.8
0.3
2016
97
77
0.38
0.20
11.2
12.7
36.5
31.9
20.6
17.8
8.7
6.7
0.8
0.2
2015
92
90
0.36
0.21
12.4
14.1
35.6
30.8
18.9
18.5
8.4
7.8
1.2
0.4
2014
91
130
0.40
0.22
10.8
13.7
36.5
31.7
21.1
21.8
9.2
7.8
1.4
0.4
2013
103
166
0.45
0.27
9.6
16.0
36.9
29.4
22.1
27.0
8.6
10.8
1.5
0.5
2012
94
121
0.49
0.27
5.9
14.1
38.5
32.7
21.5
18.1
8.3
6.2
1.4
0.4
2011
85
76
0.40
0.27
5.3
16.7
37.5
29.5
18.2
N/A
7.8
6.8
1.2
0.5
2010
86
73
0.50
0.23
5.7
16.3
36.6
31.4
16.1
N/A
7.1
N/A
N/A
N/A
2009
87
68
0.56
0.32
6.0
17.4
33.3
28.5
20.9
N/A
8.3
N/A
N/A
N/A
2008
82
81
0.66
0.27
8.2
17.9
33.0
28.3
N/A
N/A
9.2
N/A
N/A
N/A
2007
97
85
0.61
0.34
11.7
18.9
32.4
28.0
N/A
N/A
8.6
11.2
0.1
N/A
2006
102
88
0.75
0.38
13.4
19.3
32.7
29.0
N/A
29.3
8.3
N/A
0.8
N/A
2005
100
76
0.76
0.45
15.1
18.0
30.2
27.2
N/A
30.1
7.8
N/A
5.3
N/A
2004
85
76
0.71
0.38
16.0
N/A
30.6
27.2
N/A
33.1
N/A
N/A
1.6
N/A
2003
99
69
0.67
0.44
15.9
N/A
29.8
27.5
N/A
19.9
N/A
N/A
1.0
N/A
2002
94
77
0.73
0.53
15.7
N/A
30.6
27.1
N/A
N/A
N/A
N/A
0.7
N/A
2001
95
68
0.76
0.77
15.0
7.4
29.4
25.5
N/A
16.9
N/A
N/A
1.1
N/A
2000
95
66
0.88
0.75
14.7
7.9
29.7
24.1
N/A
N/A
N/A
N/A
0.4
N/A
Natural disasters
Type
Las Vegas
Reno
Tornado activity compared to U.S. average
2.1%
2.4%
Earthquake activity compared to U.S. average
6,093.4%
6,879.2%
Natural disasters compared to U.S. average
12%
28%
Transportation
Las Vegas has more public transportation options due to its tourist attraction status. This includes an extensive bus network, monorails, shuttles, and cabs. Reno, however, relies more on cars, with public transportation being less extensive. However, Reno being smaller makes commuting relatively less time-consuming.
Transport
Type
Las Vegas
Reno
Amtrak stations
1
1
Amtrak stations nearby
1
2
FAA registered aircraft
1
758
FAA registered aircraft manufacturers and dealers
81
16
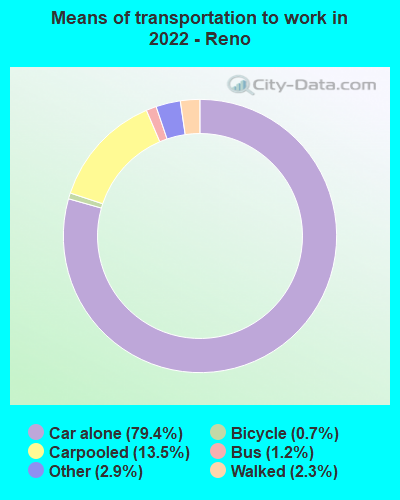
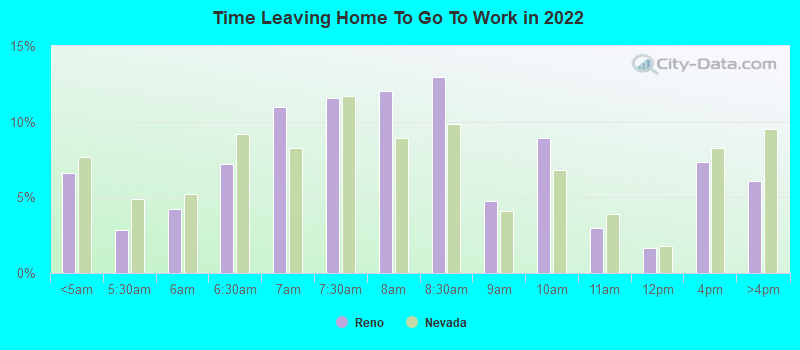
Means of transportation to work
Type
Las Vegas
Reno
Bicycle
0.1%
0.1%
Bus
2.2%
1.8%
Carpooled
10.3%
10.2%
Car alone
82.7%
81.6%
Motorcycle
0.4%
0.2%
Taxicab
0%
0.2%
Walked
1.4%
1.7%
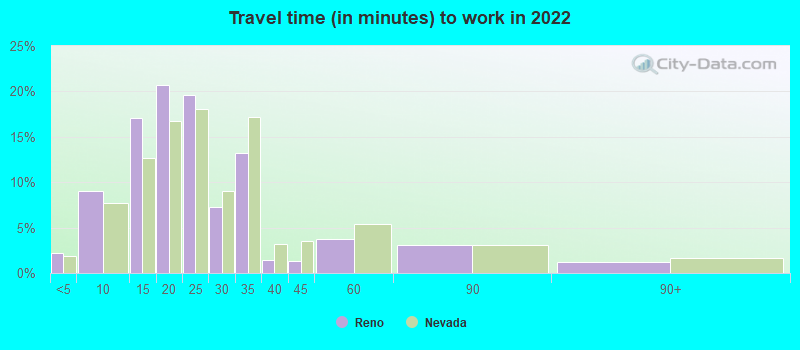
Average travel time to work
Type
Las Vegas
Reno
Average
26.3 min
24.2 min
Other means
24 min
18.6 min
Public transportation
49.9 min
36.8 min
Private vehicle occupancy
Type
Las Vegas
Reno
Average
1.2
1.2
Drove alone
88.9%
87.1%
In 2 person carpool
8.2%
10.2%
In 3 person carpool
2.1%
1.6%
In 4 person carpool
0.2%
0.6%
In 5-6 person carpool
0.4%
0.3%
In 7+ person carpool
0.2%
0.2%
How many people usually rode to work in the car, truck or van.
Real Estate
Real estate in Las Vegas offers a wide range from affordable to luxury housing, heavily influenced by the tourism and entertainment industry. On the other hand, Reno's real estate revolves around family-oriented housing with a slow but steady growth in the market.
Neighborhoods
Las Vegas neighborhoods offer a wide variety, from the bustling downtown area to tranquil suburbs. Reno's neighborhoods likewise range from urban living in downtown to more peaceful, suburban environments. Both cities also have historic neighborhoods with unique architectural character.
Houses and residents
Type
Las Vegas
Reno
Houses
269,602
116,918
Average household size (people)
2.7
2.4
Median year apartment built
1991
1984
Median year house/condo built
1995
1993
Length of stay in the house since moving in
10.1 years
10.5 years
Houses occupied
250,350 (92.9%)
110,993 (94.9%)
Houses occupied by owners
138,677 (55.4%)
54,158 (48.8%)
Houses occupied by renters
111,673 (44.6%)
56,835 (51.2%)
Median rent asked for vacant for-rent units
$1,176
$1,306
Median monthly housing costs
$1,255
$1,307
Median price asked for vacant for-sale houses and condos
$989,410
$797,037
Estimated median house or condo value
$362,400
$469,100
Median numbers of rooms
5.2
5
Median number of rooms in apartments
4.1
3.9
Median number of rooms in houses and condos
6.1
6.2
Median house price - detached houses
$439,169
$560,745
Median house price - in 2-unit structures
$161,204
Over $1,000,000
Median house price - in 3-to-4-unit structures
$201,871
$273,291
Median house price - in 5 or more unit structures
$327,174
$239,159
Median house price - mobile homes
$113,235
$115,836
Median house price - Townhouses or other attached units
$274,961
$364,237
Median house price - All housing units
$417,434
$513,401
Median house age
27
33
Renting percentage
43.5%
52%
Housing density (houses/condos per square mile)
2,379.4
1,691.7
House value disparities
27.1%
27.4%
Household income disparities
47.1%
44.4%
Median household income for houses/condes with a mortgage
$90,388
$114,336
Median household income for apartments without a mortgage
$62,287
$64,370
Housing units without a mortgage
1,172 (1.2%)
616 (1.7%)
Housing units with both a second mortgage and home equity loan
4,450 (4.6%)
1,679 (4.6%)
Housing units with a mortgage
95,992 (98.8%)
35,814 (98.3%)
Housing units with a home equity loan
178 (0.2%)
129 (0.4%)
Housing units with a second mortgage
5,092 (5.2%)
1,980 (5.4%)
House/condo owner moved in on average (years ago)
7
7
House/condo renter moved in on average (years ago)
2
1
Housing units lacking complete kitchen facilities
1.3%
3.7%
Housing units lacking complete plumbing facilities
1%
2.3%
Housing units in structures
Housing units in structures
Las Vegas
Reno
One, detached
61.5%
51.5%
One, attached
5.3%
5.7%
Two
1.3%
1.1%
3 or 4
7.7%
5.0%
5 to 9
8.4%
9.7%
10 to 19
4.8%
9.2%
20 to 49
2.8%
5.7%
50 or more
6.8%
8.1%
Mobile homes
1.4%
3.7%
Boats, RVs, vans, etc.
0.1%
0.3%
Median real estate property taxes paid for housing units
Self-employed workers in own not incorporated business
18,990
5,944
State government workers
6,950
7,119
Unpaid family workers
614
127
Industries and Occupations
Las Vegas's primary industries include gaming, entertainment, hospitality, and tourism. Conversely, Reno's leading industries are tech, healthcare, and logistics. In Las Vegas, the most common occupations are in the "food and entertainment" sectors. In Reno, management and sales occupations are the most common.
Both cities offer numerous healthcare facilities. Las Vegas has a larger number of hospitals and clinics due to its larger population, while Reno provides quality healthcare with renowned establishments like Renown Health and Saint Mary's Regional Medical Center.
Health (county statistics)
Type
Las Vegas
Reno
General health status score of residents in this county from 1 (poor) to 5 (excellent)
Infrastructure and amenities in Las Vegas are vast and numerous. From high-rise condominiums to shopping malls and world-renowned resorts, this city has everything an urban seeker would desire. Reno’s infrastructure primarily consists of single-family homes and small city amenities though it is experiencing modernization and growth.
Infrastructure
Type
Las Vegas
Reno
Hospitals
39
11
TV stations
12
15
Arenas or stadiums
2
2
Bank branches located here
281
60
Bank institutions located here
34
11
Main business address for public companies
57
12
Drinking water stations with no reported violations in the past
32
20
Drinking water stations with reported violations in the past
HMDA - Conventional home purchase loans - Applications denied
Year
Las Vegas
Reno
1999
2,657
668
2000
579
565
2001
371
362
2002
380
305
2003
3,590
478
2004
5,908
725
2005
7,894
944
2006
6,914
1,006
2007
3,733
572
2008
1,431
220
2009
813
123
Culture and Food
Las Vegas is famous for its Strip, a hub of entertainment, nightlife, gaming, and gourmet restaurants. The city teems with cultural diversity and events. Reno, while also offering a variety of restaurants and cultural events, has a reputation for being quieter and more family-friendly with closer access to outdoor recreational activities.
Sports Teams
Las Vegas is home to the Las Vegas Raiders (NFL) and the Vegas Golden Knights (NHL). Reno has a minor league baseball team, the Reno Aces, and a United Soccer League team, Reno 1868 FC.


 Las Vegas, NV
 Reno, NV