Long Beach and Palmdale are two distinct cities in California that offer unique lifestyles. Long Beach, known for its vibrant urban life, is distinguished by its port, cultural diversity, and coastline. In contrast, Palmdale, located in the Antelope Valley, is characterized by its quiet suburban lifestyle, surrounding geography, and space-related industries. Comparing the two can provide an intriguing perspective in terms of crime and safety, cost of living, education, work and economy, and much more for both residents and visitors.
Distance between
Long Beach, CA and
Palmdale, CA : 53.8 miles
Long Beach's population is larger by 175%. Its population has decreased by 5,460 people (1.2%) since 2000. The population of Palmdale has grown by 49,091 people (42.1%) during that time.
While crime rates generally tend to be higher in urban areas, Long Beach has been consistently working to reduce its levels, resulting in a decrease over the recent years. Its community-oriented police department employs various strategies to ensure safety. In contrast, Palmdale, as a smaller city, has lower crime rates. Nevertheless, both cities have invested significantly in public safety, and residents generally report feeling safe in both areas.
City-data.com crime index counts serious crimes and violent crime more heavily. It adjusts for the number of visitors and daily workers commuting into cities. (higher means more crime, U.S. average = 301.1)
City-data.com crime index counts serious crimes and violent crime more heavily. It adjusts for the number of visitors and daily workers commuting into cities. (higher means more crime, U.S. average = 301.1)
Sex Offenders
According to our data, there are 807 registered sex offenders living in Long Beach and 212 registered sex offenders living in . The ratio of residents to sex offenders in Long Beach is 583 to 1; the ratio in Palmdale is 742 to 1. The number of registered sex offenders compared to the number of residents is larger in Long Beach than in Palmdale.
Cost of Living
Living in Long Beach generally tends to be more expensive than living in Palmdale, primarily due to higher housing costs. The overall cost of living in Long Beach is estimated to be about 50% higher than in Palmdale. This difference is a crucial factor for those considering relocation or longer visits.
Income Tax
California’s income tax ranges from 1% to 13.3%, applicable to residents of both cities. There is no additional city income tax in either Long Beach or Palmdale.
Property Tax
Property taxes vary based on property values and local levy rates, but the average property tax rate for homeowners in Los Angeles County, which houses both cities, is 0.72%.
Sales Tax
California has a baseline sales tax of 7.25%, but local jurisdictions can add to this amount. Long Beach's total sales tax rate is 10.25%, while Palmdale's is 9.5%.
Income
Type
Long Beach
Palmdale
Estimated median household income
$73,905
$73,417
Estimated per capita income
$37,217
$25,895
Cost of living index (U.S. average is 100)
142
129.6
If you make $50,000 in Palmdale, you will have to make $54,784 in Long Beach to maintain the same standard of living.
Geographical Conditions
Long Beach's coastal geography offers sandy beaches, a bustling port, and waterfront vistas. In contrast, Palmdale is nestled in the Antelope Valley, with a desert-like environment, and the San Gabriel Mountains nearby, providing nature at its doorstep.
Both cities have reputable public and private schools, along with community colleges. Long Beach has the advantage of being home to California State University - Long Beach, which is one of the largest universities in California. Palmdale, on the other hand, focuses more on aviation and aerospace education, reflecting the city's dominant industries.
Long Beach's economy is diverse, with healthcare, education services, and trade logistics being the major sectors. The Port of Long Beach is a significant factor in the city's economy. Palmdale is home to many aerospace companies, with Lockheed Martin, Northrop Grumman, and Boeing among its top employers.
Biggest Employers
In Long Beach, the largest employers are Long Beach Unified School District, and the City of Long Beach. Palmdale's economy is dominated by aerospace and defense contractors, with Lockheed Martin, Northrop Grumman, Antelope Valley Union High School District, and Palmdale School District among the largest employers.
There were 304 building permits issued in Long Beach in 2012 (238 more than in 2011) compared to 187 building permits issued in Palmdale in 2012 (80 more than in 2011).
Weather
Long Beach, adjacent to the Pacific Ocean, enjoys a Mediterranean climate with mild, wet winters and dry summers. Ocean breezes reduce heat in summers and moderate winter temperatures. On the other hand, Palmdale experiences a semi-arid climate, with hot and dry summers and cold winters where snowfall can occur. It's important for both residents and tourists to be prepared for these contrasting climatic conditions.
Weather and climate
Type
Long Beach
Palmdale
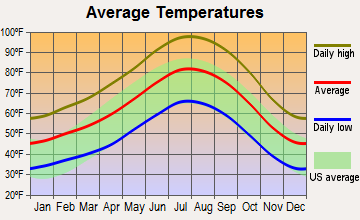
Temperature - Average
65.3°F
63°F
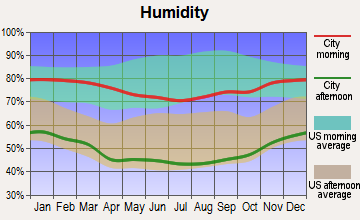
Humidity - Average morning or afternoon humidity
70.4%
62.2%
Humidity - Differences between morning and afternoon humidity
27%
17.2%
Humidity - Maximum monthly morning or afternoon humidity
79%
65.6%
Humidity - Minimum monthly morning or afternoon humidity
52%
48.5%
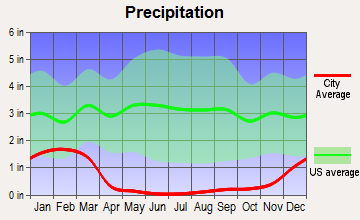
Precipitation - Yearly average
13.1 in
7.4 in
Snowfall - Yearly average
0 in
0 in
Clouds - Number of days clear of clouds
26.4%
27.5%
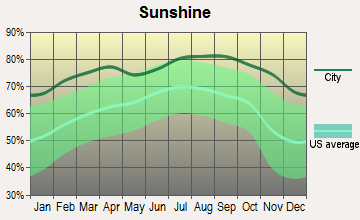
Sunshine amount - Average
78.4%
78.6%
Sunshine amount - Differences during a year
22%
21.3%
Sunshine amount - Maximum monthly
85%
84.5%
Sunshine amount - Minimum monthly
63%
63.3%
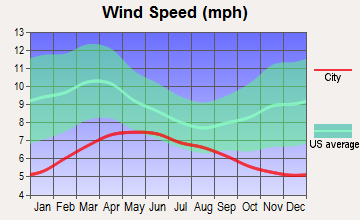
Wind speed - Average
6.1 mph
4.1 mph
Average climate in Long Beach, California
Average climate in Palmdale, California
Air pollution
Type
AQI
CO
NO2
OZONE
PB
PM10
PM25
SO2
Year
Long Beach
Palmdale
Long Beach
Palmdale
Long Beach
Palmdale
Long Beach
Palmdale
Long Beach
Long Beach
Palmdale
Long Beach
Palmdale
Long Beach
2018
124
95
0.37
0.21
17.2
8.7
22.1
39.8
0.008
N/A
27.5
25.4
13.5
7.3
0.7
N/A
2017
122
89
0.36
0.26
18.1
7.8
23.2
38.3
0.007
N/A
26.7
25.4
14.5
7.4
0.8
N/A
2016
115
91
0.36
0.25
18.5
8.1
21.9
40.2
0.007
N/A
24.1
25.0
11.6
7.7
0.9
N/A
2015
111
104
0.38
0.27
19.9
6.7
22.5
41.5
0.005
N/A
25.0
18.4
13.9
N/A
0.9
N/A
2014
127
90
0.50
0.16
20.3
8.2
22.0
38.7
0.007
N/A
26.7
22.7
14.3
N/A
1.3
N/A
2013
126
96
0.48
0.20
20.0
8.0
24.7
39.4
0.005
N/A
32.3
22.5
14.6
N/A
1.0
N/A
2012
132
89
0.48
0.28
19.3
8.9
24.4
40.5
0.004
N/A
30.8
29.5
14.1
N/A
0.6
N/A
2011
119
97
0.43
0.27
20.2
11.7
23.4
41.9
0.006
N/A
28.4
19.7
15.6
N/A
1.2
N/A
2010
115
93
0.38
0.16
20.8
11.7
22.7
41.8
0.011
N/A
24.1
19.0
11.9
N/A
0.7
N/A
2009
132
103
0.50
0.15
21.0
12.7
22.0
40.9
0.008
N/A
27.7
20.6
13.1
N/A
1.1
N/A
2008
124
98
0.53
0.17
20.8
13.2
23.2
37.7
0.008
N/A
27.2
26.5
21.6
N/A
1.0
N/A
2007
109
97
0.60
0.20
20.3
14.5
21.1
37.5
0.010
N/A
N/A
23.8
N/A
N/A
1.4
N/A
2006
119
95
0.76
0.24
21.4
14.9
19.9
35.6
0.005
N/A
N/A
23.6
N/A
N/A
1.7
N/A
2005
108
102
0.74
0.23
24.3
15.4
20.5
36.4
0.011
N/A
N/A
22.2
N/A
N/A
2.7
N/A
2004
125
109
0.56
0.25
28.0
14.5
22.9
39.1
0.012
N/A
N/A
24.8
N/A
N/A
2.0
N/A
2003
130
112
0.83
0.27
28.1
15.0
22.4
38.1
0.032
N/A
N/A
26.4
N/A
N/A
1.1
N/A
2002
120
113
0.90
0.30
29.6
15.7
22.2
38.5
0.011
N/A
N/A
28.8
N/A
N/A
2.8
N/A
2001
124
103
0.81
0.39
30.3
15.8
21.5
37.8
0.011
N/A
N/A
25.9
N/A
N/A
3.3
N/A
2000
142
109
0.71
0.52
31.5
15.6
19.6
37.2
0.018
N/A
N/A
26.6
N/A
N/A
2.0
N/A
Natural disasters
Type
Long Beach
Palmdale
Tornado activity compared to U.S. average
18.3%
12.6%
Earthquake activity compared to U.S. average
6,875.1%
7,632.2%
Natural disasters compared to U.S. average
57%
57%
Transportation
Long Beach is well-served by public transit, including buses and light rail, as well as bike and car-sharing services. The city’s well-connected expressway system makes commuting to nearby areas like LA relatively easy. Palmdale residents mostly rely on car transportation, but the city also has a public bus service and is nearby Metrolink stations for commuter rail service.
Transport
Type
Long Beach
Palmdale
Amtrak stations
1
1
Amtrak stations nearby
3
3
FAA registered aircraft
312
82
FAA registered aircraft manufacturers and dealers
29
2
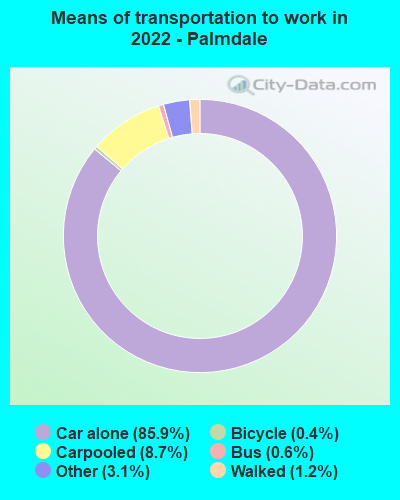
Means of transportation to work
Type
Long Beach
Palmdale
Bicycle
0.5%
0.3%
Bus
3.3%
0.7%
Carpooled
9.8%
8.4%
Car alone
81.8%
86.1%
Motorcycle
0.2%
0.3%
Railroad
0%
0.6%
Subway
0.5%
0.1%
Walked
2.8%
1.2%
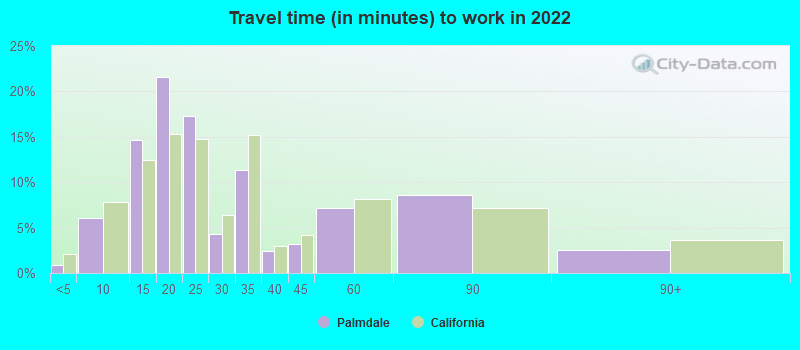
Average travel time to work
Type
Long Beach
Palmdale
Average
30.7 min
27.3 min
Other means
28.5 min
42.1 min
Public transportation
46.4 min
61.6 min
Private vehicle occupancy
Type
Long Beach
Palmdale
Average
1.1
1.2
Drove alone
89.7%
89.3%
In 2 person carpool
8.5%
5.4%
In 3 person carpool
1.4%
3%
In 4 person carpool
0.3%
0.9%
In 5-6 person carpool
0%
1.5%
How many people usually rode to work in the car, truck or van.
Real Estate
Real estate is typically more expensive in Long Beach, reflecting its coastal location and vibrant urban lifestyle. In contrast, Palmdale property prices are more in line with the national average, with the typical house price being significantly lower than in Long Beach.
Neighborhoods
Long Beach is known for its diverse neighborhoods, each with a unique personality. Some popular ones include Belmont Shore, Downtown, and Naples. Palmdale is a suburban city with a family-friendly atmosphere, characterized by quiet neighborhoods like Rancho Vista and Anaverde.
Houses and residents
Type
Long Beach
Palmdale
Houses
179,856
47,738
Average household size (people)
2.8
3.6
Median year apartment built
1964
1987
Median year house/condo built
1954
1991
Length of stay in the house since moving in
15.7 years
12.7 years
Houses occupied
172,599 (96%)
46,650 (97.7%)
Houses occupied by owners
69,470 (40.2%)
31,401 (67.3%)
Houses occupied by renters
103,129 (59.8%)
15,249 (32.7%)
Median rent asked for vacant for-rent units
$1,057
$1,421
Median monthly housing costs
$1,692
$1,706
Median price asked for vacant for-sale houses and condos
$520,992
$394,753
Estimated median house or condo value
$693,600
$399,000
Median numbers of rooms
4.2
6.3
Median number of rooms in apartments
3.6
5.2
Median number of rooms in houses and condos
5.5
6.8
Median house price - detached houses
$900,658
$383,478
Median house price - in 2-unit structures
$823,515
$550,538
Median house price - in 3-to-4-unit structures
$495,928
$572,509
Median house price - in 5 or more unit structures
$488,399
$441,622
Median house price - mobile homes
$333,777
$80,441
Median house price - Townhouses or other attached units
$634,684
$315,513
Median house price - All housing units
$805,766
$368,474
Median house age
62
31
Renting percentage
58.4%
32.1%
Housing density (houses/condos per square mile)
3,565.7
454.8
House value disparities
21.3%
23.5%
Household income disparities
44.7%
40.9%
Median household income for houses/condes with a mortgage
$116,421
$90,004
Median household income for apartments without a mortgage
$79,392
$61,301
Housing units without a mortgage
394 (0.8%)
222 (1%)
Housing units with both a second mortgage and home equity loan
3,069 (6.2%)
994 (4.3%)
Housing units with a mortgage
49,321 (99.2%)
23,090 (99%)
Housing units with a home equity loan
48 (0.1%)
27 (0.1%)
Housing units with a second mortgage
3,709 (7.5%)
1,492 (6.4%)
House/condo owner moved in on average (years ago)
15
12
House/condo renter moved in on average (years ago)
3
4
Housing units lacking complete kitchen facilities
2.6%
0.9%
Housing units lacking complete plumbing facilities
0.4%
0.5%
Housing units in structures
Housing units in structures
Long Beach
Palmdale
One, detached
40.2%
81.4%
One, attached
4.9%
1.0%
Two
5.3%
0.4%
3 or 4
8.8%
1.2%
5 to 9
10.4%
1.8%
10 to 19
10.8%
2.7%
20 to 49
8.0%
1.5%
50 or more
10.6%
6.3%
Mobile homes
0.8%
3.6%
Boats, RVs, vans, etc.
0.2%
0.0%
Median real estate property taxes paid for housing units
Self-employed workers in own not incorporated business
18,532
6,202
State government workers
6,550
2,825
Unpaid family workers
178
162
Industries and Occupations
As a port city, Long Beach has a vibrant trade and logistics industry along with a growing healthcare sector and a strong tourism industry. In contrast, Palmdale has a significant aerospace and defense industry presence, with retail, healthcare, and education also being significant sectors.
Health diagnosing and treating practitioners and other technical occupations
4.9%
4.8%
Community and social service occupations
4.4%
2.6%
Personal care and service occupations
3.6%
3.2%
Arts, design, entertainment, sports, and media occupations
3.0%
0.1%
Building and grounds cleaning and maintenance occupations
2.9%
4.6%
Health technologists and technicians
2.8%
4.2%
Material moving occupations
2.8%
2.5%
Production occupations
2.7%
2.4%
Computer and mathematical occupations
1.9%
1.0%
Transportation occupations
1.4%
2.3%
Life, physical, and social science occupations
1.3%
0.0%
Legal occupations
1.3%
0.5%
Health Care
Both cities offer good healthcare facilities, with Long Beach having several top-level medical centers including Long Beach Memorial Medical Center and Palmdale boasting Palmdale Regional Medical Center. The healthcare facilities in both cities serve as major employers.
Long Beach's infrastructure is well-established, with a mix of modern and historic buildings, extensive public transit system, and the Long Beach Airport. Palmdale, however, is seeing major growth and development, including improvements to roadway systems and public transit, and the proposed high-speed rail project.
Infrastructure
Type
Long Beach
Palmdale
Hospitals
17
2
TV stations
5
16
Bank branches located here
67
16
Bank institutions located here
18
6
Drinking water stations with no reported violations in the past
2
3
Drinking water stations with reported violations in the past
HMDA - Conventional home purchase loans - Applications denied
Year
Long Beach
Palmdale
1999
1,159
374
2000
710
12
2001
677
10
2002
708
14
2003
1,861
1,069
2004
2,162
1,520
2005
3,065
2,332
2006
3,591
2,500
2007
2,287
1,709
2008
887
684
2009
475
278
Culture and Food
Long Beach has a vibrant cultural scene, with many museums, art galleries, music festivals, and a diverse restaurant scene reflecting the city’s cultural diversity. Palmdale offers a quieter lifestyle, with suburban shopping centers, comfort food restaurants, and numerous parks for outdoor recreation.
Sports Teams
While Long Beach itself does not host a major sports team, its residents enjoy proximity to the professional sports teams in nearby Los Angeles. Palmdale residents also mainly cheer for teams in the larger metro area, with Los Angeles Rams, Lakers, Dodgers, and Kings being local favorites.


 Long Beach, CA
 Palmdale, CA