Long Beach and San Bernardino are two diverse cities in the populous state of California known for their unique characteristics. Long Beach is a coastal city known for its maritime heritage and vibrant tourist economy, while San Bernardino is situated inland and notable for its industrial economy and rich cultural history. This detailed comparison provides an in-depth look into these cities' aspects such as crime/safety, weather, cost of living, and more.
Distance between
Long Beach, CA and
San Bernardino, CA : 54.4 miles
Long Beach's population is larger by 105%. Its population has decreased by 5,460 people (1.2%) since 2000. The population of San Bernardino has grown by 36,802 people (19.9%) during that time.
When it comes to crime/safety, both Long Beach and San Bernardino have their challenges, as with all major cities. According to the FBI’s Crime Data Explorer, San Bernardino consistently ranks higher in terms of violent and property crimes compared to Long Beach. Long Beach, while not immune to crime, has seen its crime rates significantly decrease over the years thanks to robust law enforcement efforts and community engagement programs. Potential residents and tourists should exercise caution in both cities.
City-data.com crime index counts serious crimes and violent crime more heavily. It adjusts for the number of visitors and daily workers commuting into cities. (higher means more crime, U.S. average = 301.1)
City-data.com crime index counts serious crimes and violent crime more heavily. It adjusts for the number of visitors and daily workers commuting into cities. (higher means more crime, U.S. average = 301.1)
Sex Offenders
According to our data, there are 807 registered sex offenders living in Long Beach and 698 registered sex offenders living in . The ratio of residents to sex offenders in Long Beach is 583 to 1; the ratio in San Bernardino is 310 to 1. The number of registered sex offenders compared to the number of residents is a smaller in Long Beach than in San Bernardino.
Cost of Living
The cost of living in Long Beach is considerably higher than in San Bernardino. This difference primarily comes from housing costs. Long Beach's proximity to the coast and its popularity as a tourist destination drive up real estate prices. In contrast, San Bernardino, still rebounding from its financial crisis, offers much lower housing rates.
Income Tax
California has a progressive income tax, which varies from 1% to 13.3% depending on your level of income. This tax applies equally to residents of both Long Beach and San Bernardino
Property Tax
Both cities also have property taxes. The state-mandated base rate for property tax in California is 1% of the home's assessed value. However, Long Beach’s effective property tax rate tends to be slightly higher due to additional assessments and levies.
Sales Tax
Both cities fall under the California state sales tax rate of 7.25%. Long Beach applies an extra local tax of 1%, resulting in a total sales tax of 9.50%, while San Bernardino has a total sales tax of 8.00% with the incorporated city tax.
Income
Type
Long Beach
San Bernardino
Estimated median household income
$73,905
$65,311
Estimated per capita income
$37,217
$22,624
Cost of living index (U.S. average is 100)
142
82.2
If you make $50,000 in San Bernardino, you will have to make $86,375 in Long Beach to maintain the same standard of living.
Geographical Conditions
Long Beach boasts beautiful coastal scenery and is blessed with a natural harbor. Its beaches and marine atmosphere are considerable draws. San Bernardino lies inland surrounded by mountains, offering opportunities for hiking and enjoying spectacular mountain views.
In regard to education, both cities have access to a breadth of educational opportunities. Long Beach Unified School District is one of the top-performing urban school districts in the country. Furthermore, it is home to the reputable California State University, Long Beach. San Bernardino, although with lower achievement scores, hosts two four-year universities – California State University, San Bernardino, and the University of California, Riverside.
Long Beach has a diverse economy, with major sectors including healthcare, trade, and manufacturing. This city hosts the Port of Long Beach, one of the busiest seaports which significantly contributes to the city’s economy. San Bernardino's economy centers more on transportation, government, and manufacturing. Notably, the city is home to a significant number of warehouse and distribution centers, thanks to its locale as a key transit point.
Biggest Employers
In Long Beach, some of the biggest employers include the Long Beach Unified School District, the City of Long Beach, and Long Beach Memorial Medical Center. San Bernardino's largest employers include California State University, San Bernardino, and the County of San Bernardino, followed by transportation companies primarily due to its location as a logistics hub.
There were 304 building permits issued in Long Beach in 2012 (238 more than in 2011) compared to 143 building permits issued in San Bernardino in 2012 (119 more than in 2011).
In Long Beach (Los Angeles County), 69.7% voted for Democrats and 27.8% for Republicans in 2012 Presidential Election. In San Bernardino (San Bernardino County), 52.3% voted for Democrats and 45.0% for Republicans.
Elections
Type
Democrats
Republicans
Other
Year
Long Beach
San Bernardino
Long Beach
San Bernardino
Long Beach
San Bernardino
2020
71.0%
54.2%
26.9%
43.6%
2.1%
2.2%
2016
72.0%
52.1%
22.5%
41.5%
5.5%
6.4%
2012
69.7%
52.3%
27.8%
45.0%
2.4%
2.6%
2008
69.2%
52.2%
28.8%
45.8%
1.9%
2.0%
2004
63.3%
43.8%
35.7%
55.6%
1.0%
0.6%
2000
63.6%
47.3%
32.4%
48.8%
4.0%
3.9%
1996
59.3%
44.4%
31.0%
43.6%
9.7%
12.1%
Breakdown of population affiliated with a religious congregation
Type
Adherents
Congregations
Religion
Long Beach
San Bernardino
Long Beach
San Bernardino
CATHOLIC CHURCH
36.1%
21.9%
4.7%
4.3%
SOUTHERN BAPTIST CONVENTION
1.0%
2.2%
9.0%
9.6%
MUSLIM ESTIMATE
0.7%
0.6%
1.0%
1.1%
AMERICAN BAPTIST CHURCHES IN THE USA
0.5%
0.3%
3.1%
1.6%
SEVENTH DAY ADVENTIST CHURCH
0.5%
1.6%
2.4%
4.6%
EPISCOPAL CHURCH
0.4%
0.1%
1.4%
1.3%
Weather
In terms of weather, Long Beach enjoys a Mediterranean climate with warm, dry summers, and mild, wet winters. It offers year-round ocean breezes that help to negate extreme temperatures. On the other hand, San Bernardino experiences a hot-summer Mediterranean climate. Summers can be quite hot with some days rising over 100 degrees while winters tend to be mild to chilly.
Weather and climate
Type
Long Beach
San Bernardino
Temperature - Average
65.3°F
64.8°F
Humidity - Average morning or afternoon humidity
70.4%
65.9%
Humidity - Differences between morning and afternoon humidity
27%
20.5%
Humidity - Maximum monthly morning or afternoon humidity
79%
72.2%
Humidity - Minimum monthly morning or afternoon humidity
52%
51.7%
Precipitation - Yearly average
13.1 in
17.9 in
Snowfall - Yearly average
0 in
0 in
Clouds - Number of days clear of clouds
26.4%
27.5%
Sunshine amount - Average
78.4%
78.3%
Sunshine amount - Differences during a year
22%
21.4%
Sunshine amount - Maximum monthly
85%
84.2%
Sunshine amount - Minimum monthly
63%
62.7%
Wind speed - Average
6.1 mph
4.1 mph
Average climate in Long Beach, California
Average climate in San Bernardino, California
Air pollution
Type
AQI
CO
NO2
OZONE
PB
PM10
PM25
SO2
Year
Long Beach
San Bernardino
Long Beach
San Bernardino
Long Beach
San Bernardino
Long Beach
San Bernardino
Long Beach
San Bernardino
Long Beach
San Bernardino
Long Beach
San Bernardino
Long Beach
San Bernardino
2018
124
153
0.37
0.33
17.2
15.5
22.1
32.1
0.008
0.006
27.5
29.9
13.5
11.7
0.7
0.4
2017
122
148
0.36
0.40
18.1
15.7
23.2
33.9
0.007
0.004
26.7
32.0
14.5
13.3
0.8
0.3
2016
115
140
0.36
0.52
18.5
15.9
21.9
32.0
0.007
0.006
24.1
33.9
11.6
11.8
0.9
0.3
2015
111
147
0.38
0.49
19.9
15.8
22.5
32.3
0.005
0.004
25.0
31.5
13.9
12.7
0.9
0.3
2014
127
147
0.50
0.47
20.3
16.4
22.0
30.8
0.007
0.006
26.7
35.0
14.3
14.3
1.3
0.3
2013
126
147
0.48
0.42
20.0
17.0
24.7
28.8
0.005
0.006
32.3
32.2
14.6
13.2
1.0
0.3
2012
132
148
0.48
0.44
19.3
18.0
24.4
28.8
0.004
0.007
30.8
31.8
14.1
14.2
0.6
0.4
2011
119
150
0.43
0.35
20.2
18.0
23.4
27.9
0.006
0.006
28.4
30.6
15.6
17.7
1.2
0.4
2010
115
144
0.38
0.36
20.8
18.8
22.7
28.1
0.011
0.008
24.1
28.8
11.9
15.5
0.7
1.1
2009
132
151
0.50
0.35
21.0
20.0
22.0
28.1
0.008
0.011
27.7
31.9
13.1
17.5
1.1
1.2
2008
124
152
0.53
0.39
20.8
20.1
23.2
27.7
0.008
0.012
27.2
36.9
21.6
22.0
1.0
1.2
2007
109
132
0.60
0.49
20.3
22.5
21.1
25.9
0.010
0.016
N/A
N/A
N/A
N/A
1.4
1.7
2006
119
128
0.76
0.53
21.4
24.5
19.9
25.4
0.005
0.010
N/A
N/A
N/A
N/A
1.7
1.6
2005
108
132
0.74
0.58
24.3
26.8
20.5
24.4
0.011
0.011
N/A
N/A
N/A
N/A
2.7
2.7
2004
125
140
0.56
0.64
28.0
22.9
22.9
25.0
0.012
0.013
N/A
N/A
N/A
N/A
2.0
2.2
2003
130
143
0.83
0.97
28.1
26.9
22.4
24.3
0.032
0.032
N/A
N/A
N/A
N/A
1.1
1.5
2002
120
140
0.90
0.92
29.6
29.4
22.2
24.0
0.011
0.018
N/A
N/A
N/A
N/A
2.8
0.6
2001
124
144
0.81
0.81
30.3
30.9
21.5
26.4
0.011
0.039
N/A
N/A
N/A
N/A
3.3
1.1
2000
142
155
0.71
0.86
31.5
30.1
19.6
21.9
0.018
0.040
N/A
N/A
N/A
N/A
2.0
1.6
Natural disasters
Type
Long Beach
San Bernardino
Tornado activity compared to U.S. average
18.3%
15.9%
Earthquake activity compared to U.S. average
6,875.1%
7,481.9%
Natural disasters compared to U.S. average
57%
46%
Transportation
Both cities offer extensive public transportation networks. Long Beach Transit provides public bus services within the city and to neighboring communities while San Bernardino has Omnitrans. Additionally, Long Beach has a commuter ferry service, the AquaLink. Commuting can be challenging in both cities, given Southern California's high levels of traffic, but Long Beach tends to fare better due to numerous commuting options.
Transport
Type
Long Beach
San Bernardino
Amtrak stations
1
1
Amtrak stations nearby
3
3
FAA registered aircraft
312
80
FAA registered aircraft manufacturers and dealers
29
3
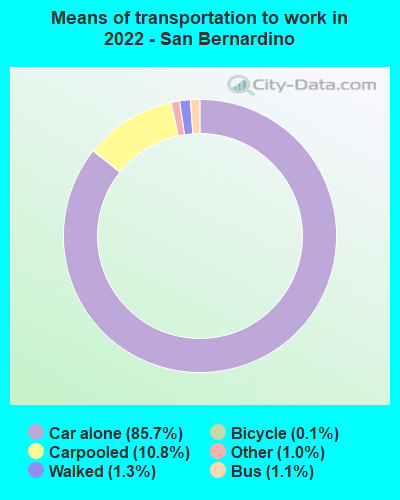
Means of transportation to work
Type
Long Beach
San Bernardino
Bicycle
0.5%
0.4%
Bus
3.3%
0.7%
Carpooled
9.8%
13.2%
Car alone
81.8%
82.9%
Motorcycle
0.2%
0.2%
Railroad
0%
0.2%
Subway
0.5%
0%
Walked
2.8%
1.4%
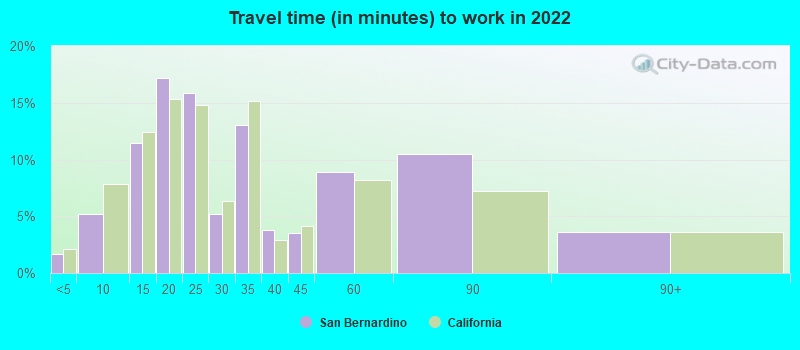
Average travel time to work
Type
Long Beach
San Bernardino
Average
30.7 min
30.8 min
Other means
28.5 min
26.8 min
Public transportation
46.4 min
45.7 min
Private vehicle occupancy
Type
Long Beach
San Bernardino
Average
1.1
1.2
Drove alone
89.7%
85.5%
In 2 person carpool
8.5%
10.7%
In 3 person carpool
1.4%
2.8%
In 4 person carpool
0.3%
0.3%
In 5-6 person carpool
0%
0.5%
How many people usually rode to work in the car, truck or van.
Real Estate
Real estate in Long Beach is more expensive than in San Bernardino, which reflects the overall higher cost of living. You'll find a mix of single-family homes, apartments, and beachfront properties in Long Beach. In contrast, San Bernardino, offers a broader range of affordable housing options.
Neighborhoods
Long Beach offers a variety of stylish neighborhoods, from the bustling Downtown area to the serene Belmont Shore. San Bernardino boasts historic neighborhoods like Arrowhead Springs, known for its hot springs and the historic Arrowhead Springs Hotel.
Houses and residents
Type
Long Beach
San Bernardino
Houses
179,856
66,188
Average household size (people)
2.8
3.4
Median year apartment built
1964
1978
Median year house/condo built
1954
1969
Length of stay in the house since moving in
15.7 years
13.1 years
Houses occupied
172,599 (96%)
63,331 (95.7%)
Houses occupied by owners
69,470 (40.2%)
32,391 (51.1%)
Houses occupied by renters
103,129 (59.8%)
30,940 (48.9%)
Median rent asked for vacant for-rent units
$1,057
$1,123
Median monthly housing costs
$1,692
$1,342
Median price asked for vacant for-sale houses and condos
$520,992
$195,043
Estimated median house or condo value
$693,600
$350,000
Median numbers of rooms
4.2
5
Median number of rooms in apartments
3.6
4.1
Median number of rooms in houses and condos
5.5
5.8
Median house price - detached houses
$900,658
$403,627
Median house price - in 3-to-4-unit structures
$495,928
$150,029
Median house price - in 5 or more unit structures
$488,399
$162,515
Median house price - mobile homes
$333,777
$234,640
Median house price - Townhouses or other attached units
$634,684
$280,582
Median house price - All housing units
$805,766
$380,769
Median house age
62
47
Renting percentage
58.4%
49.7%
Housing density (houses/condos per square mile)
3,565.7
1,125.4
House value disparities
21.3%
26.6%
Household income disparities
44.7%
41.1%
Median household income for houses/condes with a mortgage
$116,421
$92,118
Median household income for apartments without a mortgage
$79,392
$67,257
Housing units without a mortgage
394 (0.8%)
127 (0.6%)
Housing units with both a second mortgage and home equity loan
3,069 (6.2%)
762 (3.4%)
Housing units with a mortgage
49,321 (99.2%)
22,340 (99.4%)
Housing units with a home equity loan
48 (0.1%)
0 (0%)
Housing units with a second mortgage
3,709 (7.5%)
1,041 (4.6%)
House/condo owner moved in on average (years ago)
15
12
House/condo renter moved in on average (years ago)
3
3
Housing units lacking complete kitchen facilities
2.6%
2.8%
Housing units lacking complete plumbing facilities
0.4%
0.6%
Housing units in structures
Housing units in structures
Long Beach
San Bernardino
One, detached
40.2%
62.2%
One, attached
4.9%
4.2%
Two
5.3%
0.9%
3 or 4
8.8%
4.1%
5 to 9
10.4%
4.6%
10 to 19
10.8%
4.5%
20 to 49
8.0%
3.0%
50 or more
10.6%
10.3%
Mobile homes
0.8%
6.1%
Boats, RVs, vans, etc.
0.2%
0.1%
Median real estate property taxes paid for housing units
Self-employed workers in own not incorporated business
18,532
5,389
State government workers
6,550
4,741
Unpaid family workers
178
290
Industries and Occupations
Long Beach is primarily service-oriented, with most of its employees working in healthcare, education, and public administration. San Bernardino, however, is an important logistics hub due to its rail and highway access, making transportation and warehousing dominant industries.
Long Beach has several quality medical centers including the Long Beach Memorial Medical Center. San Bernardino also offers a good healthcare system, with notable centers including the Community Hospital of San Bernardino and San Bernardino Medical Center.
Health (county statistics)
Type
Long Beach
San Bernardino
General health status score of residents in this county from 1 (poor) to 5 (excellent)
Both cities have well-developed infrastructure, although Long Beach, given its longer history and development as a tourist hub, generally quite modern. San Bernardino, while perhaps not as polished, still offers a strong transportation network and public utilities, especially with recent investments aimed at revitalization.
Infrastructure
Type
Long Beach
San Bernardino
Hospitals
17
8
TV stations
5
6
Arenas or stadiums
2
1
Bank branches located here
67
18
Bank institutions located here
18
8
Drinking water stations with no reported violations in the past
2
11
Drinking water stations with reported violations in the past
HMDA - Conventional home purchase loans - Applications denied
Year
Long Beach
San Bernardino
1999
1,159
586
2000
710
503
2001
677
470
2002
708
707
2003
1,861
1,513
2004
2,162
2,236
2005
3,065
3,147
2006
3,591
3,423
2007
2,287
1,714
2008
887
554
2009
475
285
Culture and Food
Long Beach boasts a rich cultural scene with numerous galleries, museums, and theaters. It is also known for its diverse food scene with offerings ranging from seafood to ethnic cuisine. San Bernardino, on the other hand, has a vibrant historic and music culture. Its culinary palate is largely influenced by the Mexican community resulting in a robust selection of Mexican restaurants and food joints around the city.
Sports Teams
Neither Long Beach nor San Bernardino hosts major professional sports teams, but both cities are within reach of LA's numerous sports teams, including the Dodgers, Angels, Lakers, and Rams. Both cities have minor league and college level sports, so sports enthusiasts have plenty of options.


 Long Beach, CA
 San Bernardino, CA