Manhattan, New York, and Colorado Springs, Colorado, are distinct in their geographical, cultural, and economic landscapes. They both have their own unique blend of offerings that make them attractive to residents and visitors. Manhattan, an urban jungle known for its vibrant culture and business opportunities, contrasts sharply with Colorado Springs' serene backdrop and outdoor attractions. This detailed guide will delve into the specifics of life in both cities, considering all life aspects, including safety, weather, cost of living, education, work and economy, infrastructure, industries, and more.
Manhattan has a lower crime rate compared to national average, but it's higher than Colorado Springs, mainly due to it's density and urban character. Colorado Springs offers a safer environment with its crime rate lower than most large cities, making it more suitable for families and individuals valuing safety.
Cost of Living
Manhattan is significantly more expensive than Colorado Springs. The high cost of living in Manhattan is primarily due to housing, followed by transport and groceries. In contrast, Colorado Springs enjoys a relatively affordable cost of living, which can be quite appealing to both residents and tourists.
Income Tax
Both New York and Colorado impose a state income tax, but rates are higher in New York. New York's top marginal income tax rate is 8.82% as opposed to Colorado's flat tax rate of 4.63%.
Property Tax
Manhattan's property tax rates are lower than the national average, but property values are extremely high, making overall taxes substantial. Colorado Springs has slightly higher property tax rates but much lower property values.
Sales Tax
New York City, including Manhattan, has a higher sales tax rate than Colorado Springs. The combined state and local sales tax in NYC is 8.875%, while Colorado Springs has a combined rate of about 8.25%.
Income
Type
Manhattan
Colorado Springs
Estimated median household income
$84,435
$74,579
Estimated per capita income
$76,589
$39,808
Cost of living index (U.S. average is 100)
185.3
99.6
If you make $50,000 in Colorado Springs, you will have to make $93,022 in Manhattan to maintain the same standard of living.
Geographical Conditions
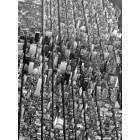
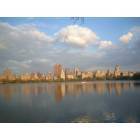
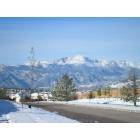
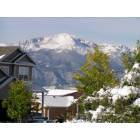
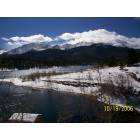
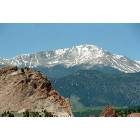
Manhattan is a highly urbanized island surrounded by rivers, while Colorado Springs sits at the base of the Rocky Mountains, with abundant natural beauty and outdoor activities.
Geographical information
Type
Manhattan
Colorado Springs
Land area
23 sq. miles
185.7 sq. miles
Population density
70,629 people per sq. mile
2,605.5 people per sq. mile
Relative area comparison
Manhattan, NY Colorado Springs, CO
Education
Both cities offer highly-rated schools and universities. However, Manhattan has a plethora of renowned institutions like Columbia University and New York University. Colorado Springs is home to the United States Air Force Academy and Colorado College, both offering excellent education.
Manhattan is a robust economy with finance, fashion, advertising, and technology leading industries. Conversely, Colorado Springs' economy is driven by the military, high-tech industry, and tourism.
Biggest Employers
Manhattan's biggest employers span multiple industries, including JP Morgan Chase, Citigroup, and Verizon. In Colorado Springs, top employers include the military, with the United States Air Force Academy and Peterson Air Force Base atop the list.
In Manhattan (New York County), 83.9% voted for Democrats and 14.9% for Republicans in 2012 Presidential Election. In Colorado Springs (El Paso County), 38.7% voted for Democrats and 59.2% for Republicans.
Elections
Type
Democrats
Republicans
Other
Year
Manhattan
Colorado Springs
Manhattan
Colorado Springs
Manhattan
Colorado Springs
2020
86.5%
43.0%
12.2%
53.9%
1.2%
3.1%
2016
86.7%
34.1%
9.7%
56.6%
3.6%
9.4%
2012
83.9%
38.7%
14.9%
59.2%
1.2%
2.0%
2008
86.1%
40.0%
13.5%
58.9%
0.3%
1.1%
2004
82.3%
32.2%
16.8%
66.9%
0.9%
0.9%
2000
80.0%
30.9%
14.5%
64.1%
5.5%
5.0%
1996
80.0%
32.2%
13.8%
59.0%
6.3%
8.8%
Breakdown of population affiliated with a religious congregation
Type
Adherents
Congregations
Religion
Manhattan
Colorado Springs
Manhattan
Colorado Springs
CATHOLIC CHURCH
20.4%
8.4%
12.6%
5.4%
MUSLIM ESTIMATE
2.7%
0.0%
2.4%
0.2%
EPISCOPAL CHURCH
1.7%
0.4%
5.3%
1.6%
AMERICAN BAPTIST CHURCHES IN THE USA
1.6%
0.3%
4.7%
1.2%
REFORMED CHURCH IN AMERICA
0.6%
0.2%
1.2%
0.5%
PATRIAR PARISHE RUSSIAN ORTHODO CHURCH USA
0.4%
0.0%
0.2%
0.0%
EVANGELICAL LUTHERAN CHURCH IN AMERICA
0.3%
1.0%
2.0%
2.3%
SEVENTH DAY ADVENTIST CHURCH
0.3%
0.2%
2.4%
1.2%
PRESBYTERIAN CHURCH IN AMERICA
0.2%
0.4%
0.6%
1.2%
SOUTHERN BAPTIST CONVENTION
0.2%
2.6%
2.9%
11.3%
LUTHERAN CHURCH
0.0%
0.7%
0.6%
1.9%
Weather
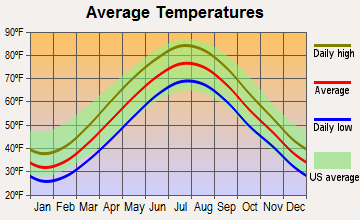
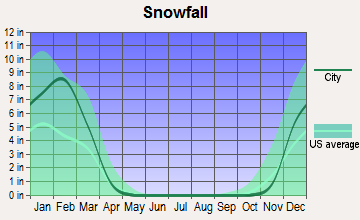
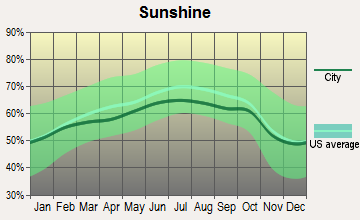
Manhattan is known for its humid subtropical climate with hot summers and cold winters. Colorado Springs, on the other hand, boasts a semi-arid climate with frigid, snowy winters and hot, dry summers. However, the city experiences more than 300 days of sunshine, making it milder and more pleasing to outdoor enthusiasts.
Weather and climate
Type
Manhattan
Colorado Springs
Temperature - Average
54.6°F
43.4°F
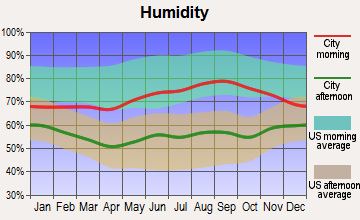
Humidity - Average morning or afternoon humidity
67.4%
53.3%
Humidity - Differences between morning and afternoon humidity
30%
30%
Humidity - Maximum monthly morning or afternoon humidity
77%
64%
Humidity - Minimum monthly morning or afternoon humidity
47%
34%
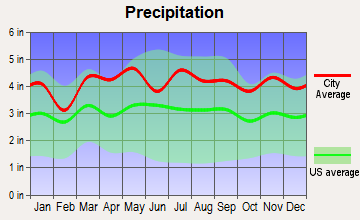
Precipitation - Yearly average
49.6 in
18.6 in
Snowfall - Yearly average
57.4 in
77 in
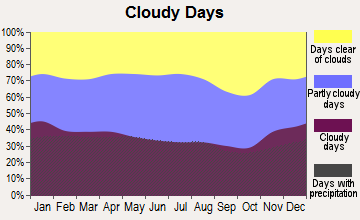
Clouds - Number of days clear of clouds
17.8%
21.2%
Sunshine amount - Average
60.2%
82.2%
Sunshine amount - Differences during a year
20%
10.5%
Sunshine amount - Maximum monthly
64%
79.7%
Sunshine amount - Minimum monthly
44%
69.2%
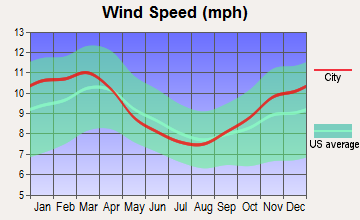
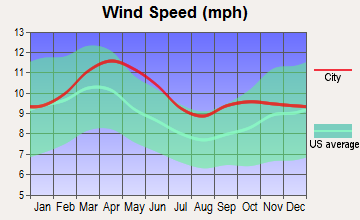
Wind speed - Average
6.7 mph
10.3 mph
Average climate in Manhattan, New York
Average climate in Colorado Springs, Colorado
Air pollution
Type
AQI
CO
NO2
OZONE
PB
PM10
PM25
SO2
Year
Manhattan
Colorado Springs
Manhattan
Colorado Springs
Manhattan
Colorado Springs
Manhattan
Manhattan
Colorado Springs
Manhattan
Colorado Springs
Manhattan
Colorado Springs
Manhattan
Colorado Springs
2018
94
60
0.29
N/A
17.3
N/A
23.9
N/A
N/A
N/A
N/A
N/A
7.9
6.3
0.5
N/A
2017
97
58
0.16
N/A
17.4
N/A
24.0
N/A
N/A
N/A
N/A
N/A
7.7
6.1
0.4
N/A
2016
94
48
0.28
N/A
18.1
N/A
24.2
N/A
N/A
N/A
N/A
N/A
7.7
6.9
0.6
N/A
2015
100
N/A
0.36
N/A
18.9
N/A
23.0
N/A
N/A
N/A
N/A
N/A
8.6
N/A
1.0
N/A
2014
95
N/A
0.40
N/A
19.1
N/A
22.3
N/A
N/A
N/A
N/A
N/A
8.3
N/A
1.1
N/A
2013
97
N/A
0.43
N/A
19.5
N/A
22.6
N/A
N/A
N/A
N/A
N/A
9.0
N/A
1.1
N/A
2012
99
N/A
0.46
N/A
18.6
N/A
23.4
N/A
N/A
N/A
N/A
N/A
9.3
N/A
1.7
N/A
2011
108
N/A
0.46
N/A
20.7
N/A
22.2
N/A
N/A
N/A
N/A
N/A
10.9
N/A
2.7
N/A
2010
113
N/A
0.45
N/A
19.3
N/A
23.3
N/A
N/A
N/A
N/A
N/A
10.4
N/A
2.7
N/A
2009
104
N/A
0.51
N/A
21.9
N/A
18.8
N/A
N/A
N/A
N/A
N/A
10.7
N/A
3.8
N/A
2008
110
N/A
0.49
N/A
23.0
N/A
19.8
N/A
0.013
N/A
N/A
N/A
12.3
N/A
4.6
N/A
2007
121
N/A
0.56
N/A
24.4
N/A
19.4
N/A
0.016
N/A
N/A
N/A
13.1
N/A
5.5
N/A
2006
116
15
0.64
0.50
24.6
N/A
18.9
N/A
0.018
0.005
N/A
N/A
12.9
N/A
6.5
N/A
2005
112
17
0.77
0.55
26.7
N/A
18.4
N/A
N/A
0.027
N/A
N/A
N/A
N/A
8.2
N/A
2004
108
17
0.77
0.56
26.7
N/A
17.3
N/A
0.030
0.010
N/A
N/A
N/A
N/A
8.0
N/A
2003
107
19
0.83
0.59
27.8
N/A
17.5
N/A
0.024
0.011
26.9
N/A
N/A
N/A
8.2
N/A
2002
122
24
0.78
0.66
27.9
N/A
18.7
N/A
0.008
0.010
25.9
N/A
N/A
N/A
7.3
N/A
2001
123
51
0.79
0.63
29.4
16.7
19.4
N/A
0.020
0.005
25.0
21.3
N/A
N/A
8.7
1.9
2000
115
78
0.90
0.58
30.2
22.5
15.0
N/A
0.022
0.010
22.2
21.0
N/A
N/A
8.4
2.3
Natural disasters
Type
Manhattan
Colorado Springs
Tornado activity compared to U.S. average
59.1%
78.4%
Earthquake activity compared to U.S. average
31.1%
816.1%
Natural disasters compared to U.S. average
18%
17%
Transportation
Manhattan boasts an efficient public transportation system, including subways, buses, and taxis. Colorado Springs has less developed public transit, with most residents opting to commute by car.
Transport
Type
Manhattan
Colorado Springs
Amtrak stations
0
1
Amtrak stations nearby
3
1
FAA registered aircraft
2
552
FAA registered aircraft manufacturers and dealers
0
44
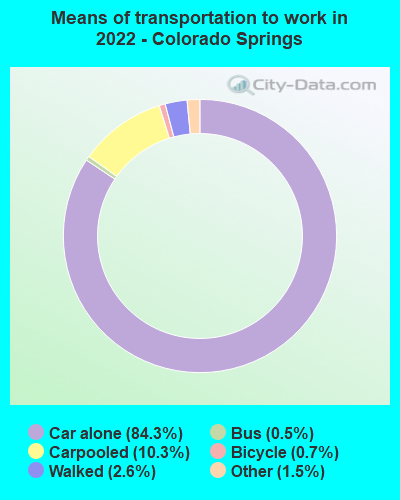
Means of transportation to work
Type
Manhattan
Colorado Springs
Bicycle
0.9%
0.3%
Bus
10.1%
0.4%
Carpooled
3.4%
9.2%
Car alone
7.6%
87%
Motorcycle
0.1%
0.1%
Railroad
1.1%
0%
Streetcar
0.1%
0%
Subway
43.6%
0%
Taxicab
4.7%
0.1%
Walked
21.9%
2.1%
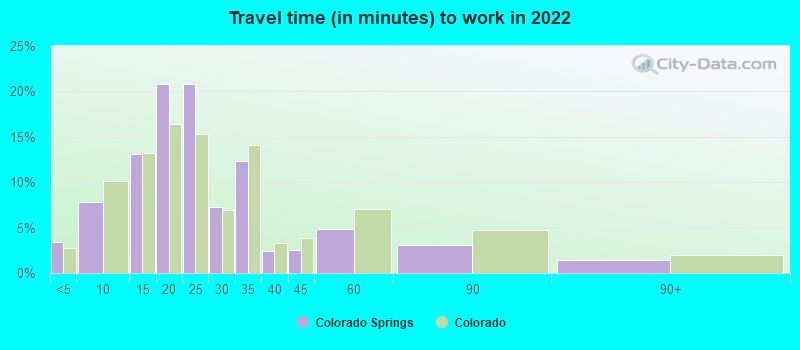
Average travel time to work
Type
Manhattan
Colorado Springs
Average
30.3 min
23.8 min
Real Estate
Manhattan has some of the most expensive real estate globally, with prime locations commanding high prices. Colorado Springs offers more affordable and spacious housing options, making it an attractive choice for families.
Neighborhoods
Manhattan's neighborhoods, such as SoHo, Greenwich Village, and Tribeca, are known for their cultural heritage and vibrant nightlife. Colorado Springs offers quieter, family-friendly neighborhoods like Black Forest and Broadmoor.
Houses and residents
Type
Manhattan
Colorado Springs
Houses
798,144
205,380
Average household size (people)
2
2.4
Houses occupied
738,644 (92.5%)
197,542 (96.2%)
Houses occupied by owners
148,695 (20.1%)
123,398 (62.5%)
Houses occupied by renters
589,949 (79.9%)
74,144 (37.5%)
Median rent asked for vacant for-rent units
$1,690
$1,458
Median price asked for vacant for-sale houses and condos
$3,393,315
$595,239
Estimated median house or condo value
$940,900
$390,500
Median number of rooms in apartments
3.2
4.1
Median number of rooms in houses and condos
4
7.2
Renting percentage
77.2%
39.9%
Housing density (houses/condos per square mile)
34,757
1,105.7
Household income disparities
47.8%
41%
Housing units without a mortgage
1,104 (40.3%)
1,835 (2.1%)
Housing units with both a second mortgage and home equity loan
13 (0.5%)
6,564 (7.3%)
Housing units with a mortgage
1,636 (59.7%)
87,580 (97.9%)
Housing units with a home equity loan
140 (5.1%)
86 (0.1%)
Housing units with a second mortgage
140 (5.1%)
7,898 (8.8%)
Housing units lacking complete kitchen facilities
2%
0.6%
Housing units lacking complete plumbing facilities
Self-employed workers in own not incorporated business
69,517
13,110
State government workers
15,544
7,029
Unpaid family workers
1,861
735
Industries and Occupations
In Manhattan, the finance and tech industries dominate, offering a plethora of opportunities for those in these fields. Colorado Springs, however, thrives off the military, tourism, and high-tech industries, creating jobs in sectors like defense, hospitality, and technology.
Manhattan has top-rated healthcare institutions like New York-Presbyterian and Mount Sinai. Colorado Springs offers a high standard of healthcare with centers like UCHealth Memorial Hospital and Penrose-St. Francis Health Services.
Health (county statistics)
Type
Manhattan
Colorado Springs
General health status score of residents in this county from 1 (poor) to 5 (excellent)
Manhattan has an elaborate, efficient public transportation system and iconic infrastructure like Times Square and Central Park. Colorado Springs has less developed public transit but offers green urban spaces and abundant recreational facilities due to its geographical location.
Infrastructure
Type
Manhattan
Colorado Springs
TV stations
30
18
Culture and Food
Manhattan shines with its rich cultural scene, world-class museums, and global cuisine. Colorado Springs stands out for its adventure-filled outdoor culture and farm-fresh culinary ethos.
Sports Teams
Manhattan is home to numerous professional sports teams, including the Yankees (MLB), Knicks (NBA), and Rangers (NHL). Colorado Springs hosts several minor league teams and is home to the U.S. Olympic & Paralympic Training Center.
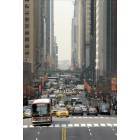

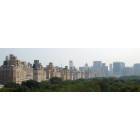


 Manhattan, NY
 Colorado Springs, CO