This comparison between Manhattan, NY, and Indianapolis, IN, aims to provide comprehensive insight into various aspects of living and visiting these cities. We examine factors such as crime and safety, weather, cost of living, education, economy, infrastructure, job market, real estate, neighborhood quality, commuting options, tax implications, culinary culture, sports teams, geographical differences and health care availability. Understanding these elements can help people deciding to relocate or tourists scheduling a visit to make informed decisions.
Manhattan, NY, has seen a significant reduction in crime over the past few decades, but it remains higher than the national average. It is essential to stay vigilant, especially in highly crowded areas. Conversely, Indianapolis, IN, has a crime rate that's above the national average, with property crimes being more prevalent. Both cities have police forces working diligently to improve safety conditions.
Cost of Living
Living in Manhattan is significantly more expensive than living in Indianapolis. Manhattan holds one of the highest costs of living in the country due to the high cost of housing, groceries, transportation, and even healthcare. In contrast, Indianapolis is one of the most affordable big cities, with housing costs significantly below the national average.
Income Tax
Manhattan residents face a high tax burden with a combined state/city income tax rate that can reach up to 12.7%. Notably lower, Indiana's state income tax is a flat 3.23%, with an additional county tax ranging from 0.02% to 0.03% in Marion County (Indianapolis).
Property Tax
Property taxes in Manhattan can vary greatly depending on the property's market value, but they're generally high compared to the national average. Indianapolis's property taxes are much lower, with Indiana having one of the lowest property tax rates in the country.
Sales Tax
New York City residents pay a combined city/state sales tax rate of 8.875%. Indiana has a state sales tax of 7%, with no additional sales tax in Indianapolis.
Income
Type
Manhattan
Indianapolis
Estimated median household income
$84,435
$58,479
Estimated per capita income
$76,589
$32,792
Cost of living index (U.S. average is 100)
185.3
87.7
If you make $50,000 in Indianapolis, you will have to make $105,644 in Manhattan to maintain the same standard of living.
Geographical Conditions
Manhattan is an island densely packed with skyscrapers and surrounded by water, with several beautiful parks providing green space. Indianapolis is a landlocked city with gently rolling terrain and an abundance of green spaces and waterways.
Geographical information
Type
Manhattan
Indianapolis
Land area
23 sq. miles
361.5 sq. miles
Population density
70,629 people per sq. mile
2,440.1 people per sq. mile
Education
Both cities have excellent educational opportunities. Manhattan, home to prestigious universities like Columbia and NYU, has a robust college-going culture. Indianopolis, with schools like Butler University, Indiana University-Purdue University Indianapolis (IUPUI), and Ivy Tech Community College, also has a solid education system. Additionally, Indianapolis is home to promising public and private schools.
Manhattan has a diverse economy with leading industries in finance, healthcare, technology, real estate, and entertainment. Indianapolis, commonly known as the "Crossroads of America," has a robust economy centered on manufacturing, healthcare, education, and retail. Though job opportunities are plentiful in both, unemployment rates are slightly lower in Indianapolis than Manhattan.
Biggest Employers
In Manhattan, some of the most significant employers include JPMorgan Chase, Citigroup, Verizon, IBM, and Mount Sinai Health System. In Indianapolis, top employers are Anthem Inc., Indiana University Health, St. Vincent Hospital and Health Services, and Cummins Inc.
In Manhattan (New York County), 83.9% voted for Democrats and 14.9% for Republicans in 2012 Presidential Election. In Indianapolis (Marion County), 60.1% voted for Democrats and 37.9% for Republicans.
Elections
Type
Democrats
Republicans
Other
Year
Manhattan
Indianapolis
Manhattan
Indianapolis
Manhattan
Indianapolis
2020
86.5%
63.7%
12.2%
34.5%
1.2%
1.9%
2016
86.7%
58.2%
9.7%
35.6%
3.6%
6.2%
2012
83.9%
60.1%
14.9%
37.9%
1.2%
2.0%
2008
86.1%
63.8%
13.5%
35.4%
0.3%
0.8%
2004
82.3%
50.6%
16.8%
48.7%
0.9%
0.7%
2000
80.0%
48.0%
14.5%
49.3%
5.5%
2.8%
1996
80.0%
44.6%
13.8%
47.8%
6.3%
7.7%
Breakdown of population affiliated with a religious congregation
Type
Adherents
Congregations
Religion
Manhattan
Indianapolis
Manhattan
Indianapolis
CATHOLIC CHURCH
20.4%
11.1%
12.6%
4.6%
MUSLIM ESTIMATE
2.7%
0.3%
2.4%
1.1%
EPISCOPAL CHURCH
1.7%
0.4%
5.3%
1.1%
AMERICAN BAPTIST CHURCHES IN THE USA
1.6%
1.2%
4.7%
3.4%
REFORMED CHURCH IN AMERICA
0.6%
0.0%
1.2%
0.1%
PATRIAR PARISHE RUSSIAN ORTHODO CHURCH USA
0.4%
0.0%
0.2%
0.0%
EVANGELICAL LUTHERAN CHURCH IN AMERICA
0.3%
0.5%
2.0%
1.6%
SEVENTH DAY ADVENTIST CHURCH
0.3%
0.5%
2.4%
1.6%
SOUTHERN BAPTIST CONVENTION
0.2%
1.6%
2.9%
5.7%
LUTHERAN CHURCH
0.0%
0.8%
0.6%
1.5%
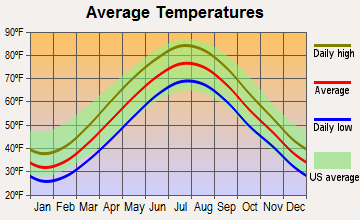
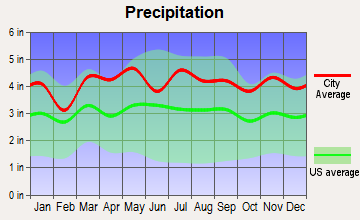
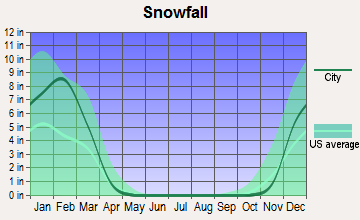
Weather
In Manhattan, residents experience a temperate climatic cycle with hot summers and cold winters. Similarly, Indianapolis also offers a four-season climate, but it is generally more severe with colder winters and hotter summers. Both cities receive substantial precipitation throughout the year.
Weather and climate
Type
Manhattan
Indianapolis
Temperature - Average
54.6°F
52.1°F
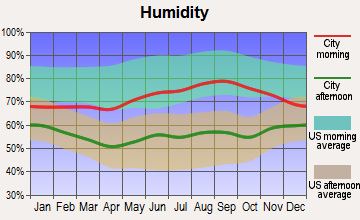
Humidity - Average morning or afternoon humidity
67.4%
77%
Humidity - Differences between morning and afternoon humidity
30%
31%
Humidity - Maximum monthly morning or afternoon humidity
77%
86%
Humidity - Minimum monthly morning or afternoon humidity
47%
55%
Precipitation - Yearly average
49.6 in
40.6 in
Snowfall - Yearly average
57.4 in
51 in
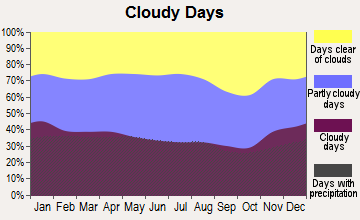
Clouds - Number of days clear of clouds
17.8%
14.7%
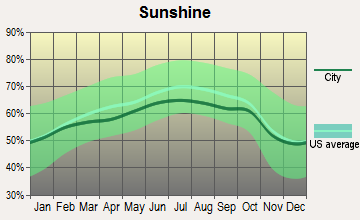
Sunshine amount - Average
60.2%
56.2%
Sunshine amount - Differences during a year
20%
33%
Sunshine amount - Maximum monthly
64%
65%
Sunshine amount - Minimum monthly
44%
32%
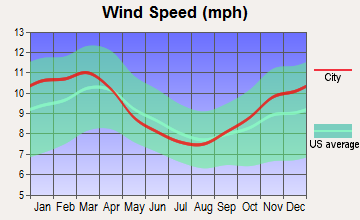
Wind speed - Average
6.7 mph
10.3 mph
Average climate in Manhattan, New York
Average climate in Indianapolis, Indiana
Air pollution
Type
AQI
CO
NO2
OZONE
PB
PM10
PM25
SO2
Year
Manhattan
Indianapolis
Manhattan
Indianapolis
Manhattan
Indianapolis
Manhattan
Indianapolis
Manhattan
Indianapolis
Manhattan
Indianapolis
Manhattan
Indianapolis
Manhattan
Indianapolis
2018
94
94
0.29
0.58
17.3
13.2
23.9
23.1
N/A
N/A
N/A
18.2
7.9
10.4
0.5
0.3
2017
97
87
0.16
0.82
17.4
12.4
24.0
23.0
N/A
N/A
N/A
17.6
7.7
10.1
0.4
0.4
2016
94
91
0.28
0.62
18.1
13.0
24.2
22.5
N/A
N/A
N/A
18.0
7.7
9.9
0.6
0.4
2015
100
89
0.36
0.73
18.9
14.9
23.0
22.9
N/A
N/A
N/A
19.7
8.6
9.9
1.0
1.1
2014
95
100
0.40
0.62
19.1
16.1
22.3
25.1
N/A
N/A
N/A
20.6
8.3
12.1
1.1
3.2
2013
97
94
0.43
0.69
19.5
11.5
22.6
26.3
N/A
N/A
N/A
19.9
9.0
12.8
1.1
2.6
2012
99
103
0.46
0.65
18.6
10.4
23.4
25.7
N/A
N/A
N/A
20.8
9.3
12.9
1.7
2.9
2011
108
105
0.46
0.68
20.7
11.3
22.2
22.9
N/A
N/A
N/A
N/A
10.9
16.3
2.7
2.4
2010
113
101
0.45
0.54
19.3
12.7
23.3
21.6
N/A
N/A
N/A
N/A
10.4
15.9
2.7
3.3
2009
104
97
0.51
0.73
21.9
11.4
18.8
23.2
N/A
N/A
N/A
N/A
10.7
13.8
3.8
1.9
2008
110
91
0.49
0.62
23.0
11.5
19.8
N/A
0.013
0.010
N/A
N/A
12.3
13.2
4.6
3.0
2007
121
103
0.56
0.69
24.4
13.1
19.4
N/A
0.016
0.011
N/A
N/A
13.1
14.9
5.5
3.6
2006
116
95
0.64
0.59
24.6
14.5
18.9
N/A
0.018
0.009
N/A
N/A
12.9
14.5
6.5
3.6
2005
112
121
0.77
0.65
26.7
15.2
18.4
N/A
N/A
0.014
N/A
N/A
N/A
18.0
8.2
4.3
2004
108
104
0.77
0.62
26.7
15.8
17.3
N/A
0.030
0.010
N/A
N/A
N/A
15.1
8.0
4.6
2003
107
113
0.83
0.67
27.8
16.6
17.5
N/A
0.024
0.010
26.9
N/A
N/A
15.8
8.2
4.2
2002
122
125
0.78
0.76
27.9
17.4
18.7
N/A
0.008
0.009
25.9
N/A
N/A
16.8
7.3
3.9
2001
123
105
0.79
0.81
29.4
16.6
19.4
N/A
0.020
0.031
25.0
N/A
N/A
16.3
8.7
3.8
2000
115
98
0.90
0.87
30.2
17.3
15.0
N/A
0.022
N/A
22.2
N/A
N/A
N/A
8.4
4.5
Natural disasters
Type
Manhattan
Indianapolis
Tornado activity compared to U.S. average
59.1%
226.7%
Earthquake activity compared to U.S. average
31.1%
179.6%
Natural disasters compared to U.S. average
18%
16%
Transportation
Manhattan's public transit system is extensive and well-developed, with a network of subways, buses, and ferries. Indianapolis offers public buses and a newly developed rapid-transit system, but it is more car-reliant than Manhattan. Commute times are generally longer in Manhattan due to traffic and distance.
Transport
Type
Manhattan
Indianapolis
Amtrak stations
0
1
Amtrak stations nearby
3
1
FAA registered aircraft
2
739
FAA registered aircraft manufacturers and dealers
0
18
Means of transportation to work
Type
Manhattan
Indianapolis
Bicycle
0.9%
0.5%
Bus
10.1%
1.2%
Carpooled
3.4%
8.5%
Car alone
7.6%
87.3%
Railroad
1.1%
0%
Streetcar
0.1%
0%
Subway
43.6%
0%
Taxicab
4.7%
0.1%
Walked
21.9%
1.6%
Average travel time to work
Type
Manhattan
Indianapolis
Average
30.3 min
28.1 min
Real Estate
Manhattan's real estate is among the most expensive in the world, featuring an array of apartments, condos, and townhouses. In sharp contrast, real estate in Indianapolis is significantly more affordable, with diverse offerings from urban apartments to suburban homes.
Neighborhoods
Manhattan is known for its vibrant neighborhoods, each with its unique character - from the luxurious Upper East Side to the artsy SoHo. Indianapolis neighborhoods range from the urban downtown to historic Meridian-Kessler and Broad Ripple, each offering a different lifestyle to its residents.
Houses and residents
Type
Manhattan
Indianapolis
Houses
798,144
399,820
Average household size (people)
2
2.4
Houses occupied
738,644 (92.5%)
358,150 (89.6%)
Houses occupied by owners
148,695 (20.1%)
201,149 (56.2%)
Houses occupied by renters
589,949 (79.9%)
157,001 (43.8%)
Median rent asked for vacant for-rent units
$1,690
$876.58
Median price asked for vacant for-sale houses and condos
$3,393,315
$283,027
Estimated median house or condo value
$940,900
$188,700
Median number of rooms in apartments
3.2
4.3
Median number of rooms in houses and condos
4
6.5
Renting percentage
77.2%
44.2%
Housing density (houses/condos per square mile)
34,757
1,106.1
Household income disparities
47.8%
44.4%
Housing units without a mortgage
1,104 (40.3%)
4,552 (3.2%)
Housing units with both a second mortgage and home equity loan
13 (0.5%)
9,787 (6.8%)
Housing units with a mortgage
1,636 (59.7%)
138,622 (96.8%)
Housing units with a home equity loan
140 (5.1%)
271 (0.2%)
Housing units with a second mortgage
140 (5.1%)
12,987 (9.1%)
Housing units lacking complete kitchen facilities
2%
3.4%
Housing units lacking complete plumbing facilities
Self-employed workers in own not incorporated business
69,517
17,131
State government workers
15,544
15,502
Unpaid family workers
1,861
1,601
Industries and Occupations
Manhattan's economy is driven by finance, media, art, fashion, research, technology, education, and entertainment. Therefore, many residents work in these sectors, with significant employment in services industries. Indianapolis is known for its manufacturing, healthcare, retail, and education sectors.
Manhattan has some of the best healthcare facilities in the country, with prestigious hospitals such as NewYork-Presbyterian and Mount Sinai. Indianapolis also has a strong healthcare sector, led by facilities like Indiana University Health and St. Vincent Hospitals.
Health (county statistics)
Type
Manhattan
Indianapolis
General health status score of residents in this county from 1 (poor) to 5 (excellent)
Manhattan's infrastructure is both old and new, reflecting the city's dynamic history. Its towering skyscrapers and historic buildings make it one of the most recognizable cityscapes globally. However, this comes with congested roads and aging public infrastructure. Indianapolis, known for its well-planned city layout and open spaces, is less congested and more spread out.
Infrastructure
Type
Manhattan
Indianapolis
TV stations
30
19
Culture and Food
Manhattan boasts a vibrant and diverse cultural scene, featuring numerous art galleries, museums, theaters, and restaurants offering a multitude of cuisine options. Indianapolis, while smaller, has a growing culinary and arts scene, with an emphasis on local, farm-to-table food and a rich sports culture.
Sports Teams
Manhattan is home to several professional sports teams, including the New York Knicks (NBA) and New York Rangers (NHL). Indianapolis is proud to house the Indianapolis Colts (NFL) and Indiana Pacers (NBA).


 Manhattan, NY and
  Indianapolis, IN : 644.7 miles