Overview
Manhattan, New York, and North Coast, California, have contrasting cityscapes marked by their unique characteristics. The bustling hub of Manhattan is a haven for modern urban life, filled with towering skyscrapers, rich arts, culture, and a thriving economy. On the other hand, North Coast offers a laid-back lifestyle with its scenic landscapes, along with opportunities for sustainable living. Comparing these two areas give us interesting perspectives on crime, weather, cost of living, education, economy, infrastructure, industries, employers, real-estate, neighborhoods, transportation, taxes, culture, sports, geographical conditions, and healthcare.
With its dense population, Manhattan has a relatively high crime rate compared to the national average. However, the NYPD continuously implements strategies to lower crime levels. Conversely, North Coast has a lower crime rate. With smaller communities, they can maintain a safer environment, making it particularly an attractive spot for family living and retirees.
Cost of Living
Manhattan has one of the highest living costs in the US, primarily driven by housing prices. In contrast, despite California's overall high living cost, North Coast is more affordable, especially for housing, food, and utilities.
Income Tax
New York has high income tax rates, with Manhattan residents facing rates up to 8.82%. California also has high income tax rates, reaching up to 13.3%.
Property Tax
New York has lower property taxes in comparison to California. In Manhattan, homeowners face a property tax rate below the national average, while homeowners in North Coast face rates slightly above the national average.
Sales Tax
New York's sales tax is 8.875%, while California levies a 7.25% base sales tax. But the overall tax burden when considering income and property tax is higher in New York.
Income
Type
Manhattan
North Coast
Estimated median household income
$84,435
$102,807
Estimated per capita income
$76,589
$50,809
Cost of living index (U.S. average is 100)
185.3
96.1
If you make $50,000 in North Coast, you will have to make $96,410 in Manhattan to maintain the same standard of living.
Geographical Conditions
Manhattan is a bustling urban jungle with few natural landscapes. North Coast, famous for its scenic beaches and lush forests, offers plenty of opportunities for outdoor activities.
Geographical information
Type
Manhattan
North Coast
Land area
23 sq. miles
59.4 sq. miles
Population density
70,629 people per sq. mile
6,335.5 people per sq. mile
Relative area comparison
Manhattan, NY North Coast, CA
Education
Manhattan boasts some of the country's top universities and educational institutions, offering a broad range of opportunities. North Coast also provides quality education with renowned universities, but it generally doesn't match Manhattan's academic vibrancy.
Manhattan's economy is diverse with major industries like finance, art and fashion, journalism, and technology. North Coast's economy is driven by agriculture, tourism, and wine industries. Unemployment rates are typically lower in Manhattan due to more job activities.
Biggest Employers
Manhattan houses headquarters of many Fortune 500 companies, providing numerous job opportunities. North Coast's employment is largely dominated by wineries and agricultural sectors.
In Manhattan (New York County), 83.9% voted for Democrats and 14.9% for Republicans in 2012 Presidential Election. In North Coast (Orange County), 45.8% voted for Democrats and 52.0% for Republicans.
Elections
Type
Democrats
Republicans
Other
Year
Manhattan
North Coast
Manhattan
North Coast
Manhattan
North Coast
2020
86.5%
53.6%
12.2%
44.6%
1.2%
1.8%
2016
86.7%
50.9%
9.7%
42.4%
3.6%
6.7%
2012
83.9%
45.8%
14.9%
52.0%
1.2%
2.3%
2008
86.1%
47.8%
13.5%
50.3%
0.3%
1.9%
2004
82.3%
39.3%
16.8%
60.2%
0.9%
0.5%
2000
80.0%
40.4%
14.5%
55.9%
5.5%
3.7%
1996
80.0%
37.9%
13.8%
51.7%
6.3%
10.5%
Breakdown of population affiliated with a religious congregation
Type
Adherents
Congregations
Religion
Manhattan
North Coast
Manhattan
North Coast
CATHOLIC CHURCH
20.4%
26.5%
12.6%
4.4%
MUSLIM ESTIMATE
2.7%
0.8%
2.4%
1.3%
EPISCOPAL CHURCH
1.7%
0.4%
5.3%
1.4%
AMERICAN BAPTIST CHURCHES IN THE USA
1.6%
0.2%
4.7%
1.7%
REFORMED CHURCH IN AMERICA
0.6%
0.3%
1.2%
0.2%
PATRIAR PARISHE RUSSIAN ORTHODO CHURCH USA
0.4%
0.0%
0.2%
0.0%
EVANGELICAL LUTHERAN CHURCH IN AMERICA
0.3%
0.4%
2.0%
2.3%
SEVENTH DAY ADVENTIST CHURCH
0.3%
0.4%
2.4%
1.3%
SOUTHERN BAPTIST CONVENTION
0.2%
2.3%
2.9%
8.8%
LUTHERAN CHURCH
0.0%
0.6%
0.6%
2.0%
Weather
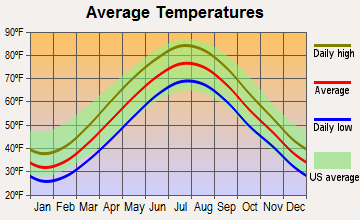
Manhattan experiences a humid continental climate with hot summers and cold winters, while North Coast enjoys a Mediterranean climate with mild, wet winters and warm, dry summers. North Coast's weather is often a key factor for people considering relocation or touring.
Weather and climate
Type
Manhattan
North Coast
Temperature - Average
54.6°F
64.4°F
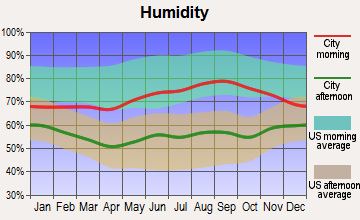
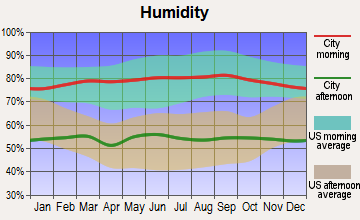
Humidity - Average morning or afternoon humidity
67.4%
70.2%
Humidity - Differences between morning and afternoon humidity
30%
26.7%
Humidity - Maximum monthly morning or afternoon humidity
77%
78.7%
Humidity - Minimum monthly morning or afternoon humidity
47%
52%
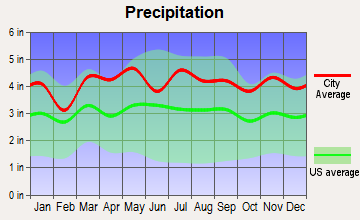
Precipitation - Yearly average
49.6 in
13 in
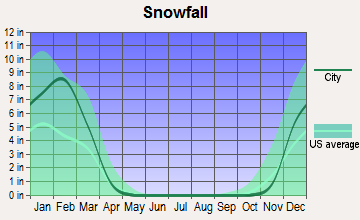
Snowfall - Yearly average
57.4 in
0 in
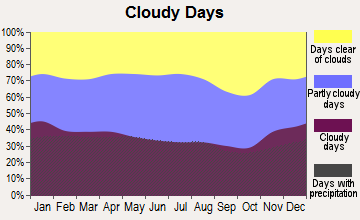
Clouds - Number of days clear of clouds
17.8%
26.5%
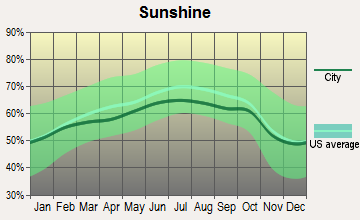
Sunshine amount - Average
60.2%
78.4%
Sunshine amount - Differences during a year
20%
21.9%
Sunshine amount - Maximum monthly
64%
84.9%
Sunshine amount - Minimum monthly
44%
62.9%
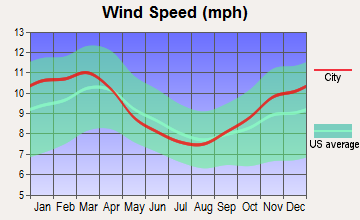
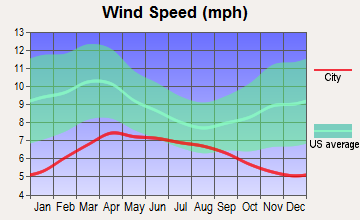
Wind speed - Average
6.7 mph
6 mph
Average climate in Manhattan, New York
Average climate in North Coast, California
Air pollution
Type
AQI
CO
NO2
OZONE
PB
PM10
PM25
SO2
Year
Manhattan
North Coast
Manhattan
North Coast
Manhattan
North Coast
Manhattan
North Coast
Manhattan
North Coast
Manhattan
North Coast
Manhattan
North Coast
Manhattan
North Coast
2018
94
119
0.29
0.35
17.3
14.4
23.9
26.1
N/A
N/A
N/A
27.5
7.9
12.6
0.5
0.7
2017
97
116
0.16
0.34
17.4
13.8
24.0
28.8
N/A
N/A
N/A
26.7
7.7
13.8
0.4
0.5
2016
94
102
0.28
0.33
18.1
12.2
24.2
29.3
N/A
N/A
N/A
24.1
7.7
12.5
0.6
0.2
2015
100
106
0.36
0.32
18.9
13.2
23.0
29.8
N/A
N/A
N/A
25.0
8.6
14.5
1.0
0.2
2014
95
110
0.40
0.29
19.1
12.9
22.3
28.6
N/A
N/A
N/A
26.7
8.3
15.5
1.1
0.4
2013
97
107
0.43
0.34
19.5
13.9
22.6
27.8
N/A
0.003
N/A
29.5
9.0
14.2
1.1
0.3
2012
99
103
0.46
0.30
18.6
12.7
23.4
26.8
N/A
0.004
N/A
28.2
9.3
14.3
1.7
0.1
2011
108
109
0.46
0.31
20.7
14.7
22.2
27.0
N/A
0.006
N/A
27.7
10.9
15.9
2.7
0.7
2010
113
102
0.45
0.33
19.3
14.3
23.3
26.2
N/A
0.011
N/A
23.6
10.4
14.0
2.7
0.6
2009
104
118
0.51
0.35
21.9
15.5
18.8
27.6
N/A
0.009
N/A
24.3
10.7
14.5
3.8
1.1
2008
110
124
0.49
0.39
23.0
16.5
19.8
28.2
0.013
0.010
N/A
29.5
12.3
21.6
4.6
1.1
2007
121
100
0.56
0.36
24.4
16.3
19.4
27.0
0.016
0.012
N/A
N/A
13.1
N/A
5.5
0.8
2006
116
114
0.64
0.40
24.6
17.2
18.9
26.4
0.018
0.007
N/A
N/A
12.9
N/A
6.5
1.3
2005
112
95
0.77
0.39
26.7
17.7
18.4
27.9
N/A
0.012
N/A
N/A
N/A
N/A
8.2
1.3
2004
108
119
0.77
0.50
26.7
19.2
17.3
30.5
0.030
0.014
N/A
N/A
N/A
N/A
8.0
1.6
2003
107
122
0.83
0.64
27.8
21.9
17.5
28.9
0.024
0.030
26.9
N/A
N/A
N/A
8.2
1.1
2002
122
106
0.78
0.65
27.9
22.0
18.7
25.5
0.008
0.018
25.9
N/A
N/A
N/A
7.3
1.8
2001
123
116
0.79
0.73
29.4
22.0
19.4
25.4
0.020
0.033
25.0
N/A
N/A
N/A
8.7
1.5
2000
115
125
0.90
0.80
30.2
24.4
15.0
24.0
0.022
0.027
22.2
N/A
N/A
N/A
8.4
1.9
Natural disasters
Type
Manhattan
North Coast
Tornado activity compared to U.S. average
59.1%
18.6%
Earthquake activity compared to U.S. average
31.1%
6,843.6%
Natural disasters compared to U.S. average
18%
32%
Transportation
Manhattan has a robust public transportation system, making commuting relatively easy. North Coast has lesser public transit options, making personal vehicles necessary for most residents.
Transport
Type
Manhattan
North Coast
Amtrak stations nearby
3
3
FAA registered aircraft
2
0
Means of transportation to work
Type
Manhattan
North Coast
Bicycle
0.9%
0.7%
Bus
10.1%
1.2%
Carpooled
3.4%
10.7%
Car alone
7.6%
81.4%
Motorcycle
0.1%
0.2%
Railroad
1.1%
0%
Streetcar
0.1%
0%
Subway
43.6%
0%
Taxicab
4.7%
0%
Walked
21.9%
1.4%
Average travel time to work
Type
Manhattan
North Coast
Average
30.3 min
28.8 min
Real Estate
Real estate in Manhattan is famous for being expensive with a competitive market. In comparison, North Coast has more affordable housing markets with spacious and scenic properties.
Neighborhoods
Manhattan features vibrant neighborhoods, each having its unique culture and aesthetics. North Coast's communities lean more towards peaceful, idyllic environments with small-town charm.
Houses and residents
Type
Manhattan
North Coast
Houses
798,144
137,450
Average household size (people)
2
2.7
Houses occupied
738,644 (92.5%)
133,254 (96.9%)
Houses occupied by owners
148,695 (20.1%)
84,546 (63.4%)
Houses occupied by renters
589,949 (79.9%)
48,708 (36.6%)
Median rent asked for vacant for-rent units
$1,690
$2,340
Median price asked for vacant for-sale houses and condos
$3,393,315
$1,099,558
Estimated median house or condo value
$940,900
$883,291
Median number of rooms in apartments
3.2
3.9
Median number of rooms in houses and condos
4
6.1
Renting percentage
77.2%
37.7%
Housing density (houses/condos per square mile)
34,757
2,312.7
Household income disparities
47.8%
41.2%
Housing units without a mortgage
1,104 (40.3%)
13,396 (19.5%)
Housing units with both a second mortgage and home equity loan
13 (0.5%)
282 (0.4%)
Housing units with a mortgage
1,636 (59.7%)
55,188 (80.5%)
Housing units with a home equity loan
140 (5.1%)
6,297 (9.2%)
Housing units with a second mortgage
140 (5.1%)
7,643 (11.1%)
Housing units lacking complete kitchen facilities
2%
1%
Housing units lacking complete plumbing facilities
1.7%
0.5%
Housing units in structures
Housing units in structures
Manhattan
North Coast
One, detached
0.3%
50.7%
One, attached
0.5%
11.8%
Two
0.6%
1.5%
3 or 4
2.1%
8.7%
5 to 9
6.3%
5.6%
10 to 19
12.6%
5.6%
20 to 49
24.5%
2.9%
50 or more
53.0%
8.2%
Mobile homes
0.0%
4.9%
Boats, RVs, vans, etc.
0.0%
0.1%
Median real estate property taxes paid for housing units
Self-employed workers in own not incorporated business
69,517
15,532
State government workers
15,544
5,751
Unpaid family workers
1,861
744
Industries and Occupations
Finance, marketing, and media dominate industries in Manhattan while North Coast thrives on wine production, agriculture, and eco-tourism. Occupations in North Coast are more bent toward the agricultural, while Manhattan attracts corporate and creative professionals.
Manhattan has world-class healthcare facilities. North Coast, while it has quality healthcare, doesn't match Manhattan's scale and could be limited, especially in more rural areas.
Health (county statistics)
Type
Manhattan
North Coast
General health status score of residents in this county from 1 (poor) to 5 (excellent)
Manhattan is known for its well-developed infrastructure - from sprawling subway systems to sky-piercing edifices. North Coast, while more rural, offers a robust network of roads, bridges, and public utilities.
Infrastructure
Type
Manhattan
North Coast
TV stations
30
2
Culture and Food
Manhattan offers rich cultural experiences with attractions like Broadway, Central Park, and renowned museums and culinary experiences from globally-inspired cuisine. North Coast is famous for its vineyards and farm-to-table dining, offering a unique culinary experience.
Sports Teams
Manhattan houses several renowned sports teams, including the New York Yankees (MLB), Knicks (NBA), and Rangers (NHL). North Coast mostly supports San Francisco-based teams, as it lacks major sports teams in the immediate area.
 Manhattan, NY
 North Coast, CA