Memphis, Tennessee, and Arlington, Texas, are two dynamic US cities with unique attributes. Each presents distinct prospects in terms of safety, weather, cost of living, and more. Memphis, a southeastern city known for its music and food scenes, contrasts with Arlington, a city in North Texas known for big sports and its central location. This comparative overview provides essential details to consider when planning to move or visit either location.
Distance between
Memphis, TN and
Arlington, TX : 442.5 miles
Memphis's population is larger by 60%. Its population has decreased by 21,973 people (3.4%) since 2000. The population of Arlington has grown by 59,817 people (18.0%) during that time.
Unfortunately, crime is higher than average in both cities. However, Memphis's crime rate is notably higher than Arlington's, making Arlington the safer choice between the two. While crime rates do not tell the whole story about a city, it's still an important factor to consider when moving or visiting. Both cities have initiatives and efforts in place aimed at improving safety and reducing crime.
City-data.com crime index counts serious crimes and violent crime more heavily. It adjusts for the number of visitors and daily workers commuting into cities. (higher means more crime, U.S. average = 301.1)
City-data.com crime index counts serious crimes and violent crime more heavily. It adjusts for the number of visitors and daily workers commuting into cities. (higher means more crime, U.S. average = 301.1)
Sex Offenders
According to our data, there are 2,628 registered sex offenders living in Memphis and 594 registered sex offenders living in . The ratio of residents to sex offenders in Memphis is 248 to 1; the ratio in Arlington is 661 to 1. The number of registered sex offenders compared to the number of residents is much larger in Memphis than that in Arlington.
Cost of Living
The cost of living is relatively affordable in both cities, though Memphis is slightly cheaper. However, individual expenditures depend largely on lifestyle and expenses like food, healthcare, and transportation. Although some may find Arlington more expensive, wages tend to be higher, somewhat balancing the cost of living.
Income Tax
Tennessee doesn't impose a state income tax on salaries and wages, which can be a significant savings. Texas also has no state income tax, making both cities attractive for young professionals and retirees alike.
Property Tax
While property taxes are somewhat higher in Texas, Memphis can be more affordable here due to its lower property values. Tennessee's state property tax rate is low, which can help offset the sales tax.
Sales Tax
Tennessee has a relatively high sales tax, up to 9.75%. Texas, in comparison, has a state and local sales taxes reaching 8.25%. However, both are significantly higher than the national average.
Income
Type
Memphis
Arlington
Estimated median household income
$44,317
$59,889
Estimated per capita income
$28,571
$31,722
Cost of living index (U.S. average is 100)
85.5
95.9
If you make $50,000 in Memphis, you will have to make $56,082 in Arlington to maintain the same standard of living.
Geographical Conditions
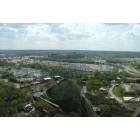
Located on the Mississippi River, Memphis is relatively flat, with some small hills and floodplains. Arlington doesn't boast any significant geographic features, instead being widely urban and residential with some parks and open spaces.
The University of Memphis, Rhodes College, and LeMoyne-Owen College are top-rated institutions located in Memphis, whereas The University of Texas at Arlington is a premier institution in the namesake town. Both cities' school districts are committed to providing quality education, although Texas schools have a slightly better reputation for K-12 education.
The economy in both Arlington and Memphis is vibrant and diverse. Both cities have a good balance of both developing sectors and established industries. While Memphis has a stronger presence in transportation and logistics, Arlington’s economy is driven by sectors like aerospace, manufacturing, and biosciences.
Biggest Employers
FedEx and the Methodist Le Bonheur Healthcare System are the two biggest employers in Memphis. In comparison, American Airlines and the Texas Health Resources dominate job opportunities in Arlington.
In Memphis (Shelby County), 62.9% voted for Democrats and 36.7% for Republicans in 2012 Presidential Election. In Arlington (Tarrant County), 41.4% voted for Democrats and 57.1% for Republicans.
Elections
Type
Democrats
Republicans
Other
Year
Memphis
Arlington
Memphis
Arlington
Memphis
Arlington
2020
64.8%
49.3%
34.2%
49.1%
1.1%
1.6%
2016
62.3%
43.2%
34.7%
51.8%
3.1%
5.0%
2012
62.9%
41.4%
36.7%
57.1%
0.4%
1.4%
2008
63.8%
43.8%
36.2%
55.5%
0.0%
0.7%
2004
57.7%
37.0%
42.0%
62.5%
0.3%
0.5%
2000
56.8%
36.9%
42.3%
60.9%
0.9%
2.3%
1996
78.9%
41.6%
19.6%
50.9%
1.5%
7.5%
Breakdown of population affiliated with a religious congregation
Type
Adherents
Congregations
Religion
Memphis
Arlington
Memphis
Arlington
SOUTHERN BAPTIST CONVENTION
14.8%
17.3%
15.1%
33.3%
CATHOLIC CHURCH
6.5%
11.1%
2.7%
1.9%
EVANGELICAL PRESBYTERIAN CHURCH
1.5%
0.0%
0.7%
0.0%
EPISCOPAL CHURCH
0.8%
0.3%
1.8%
0.8%
MUSLIM ESTIMATE
0.5%
2.2%
0.8%
0.9%
LUTHERAN CHURCH
0.4%
0.5%
1.0%
0.9%
PRESBYTERIAN CHURCH IN AMERICA
0.4%
0.1%
0.6%
0.4%
SEVENTH DAY ADVENTIST CHURCH
0.4%
0.4%
0.9%
1.6%
Weather
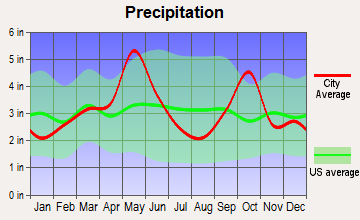
The weather in Memphis experiences four distinctive seasons, but it's located in a humid subtropical zone. There's a marked difference between Arlington with its hot, dry summers and generally mild winters. Both places experience extremes at different times of the year, so it truly depends on what kind of weather suits you.
Weather and climate
Type
Memphis
Arlington
Temperature - Average
61.9°F
65°F
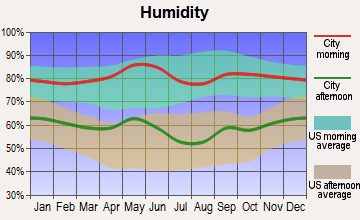
Humidity - Average morning or afternoon humidity
74%
71.4%
Humidity - Differences between morning and afternoon humidity
33%
34%
Humidity - Maximum monthly morning or afternoon humidity
85%
82%
Humidity - Minimum monthly morning or afternoon humidity
52%
48%
Precipitation - Yearly average
54.3 in
37.9 in
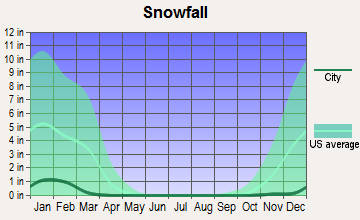
Snowfall - Yearly average
8.6 in
4.2 in
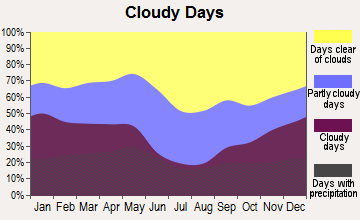
Clouds - Number of days clear of clouds
19.7%
22.7%
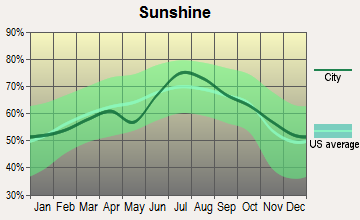
Sunshine amount - Average
68.7%
66.6%
Sunshine amount - Differences during a year
24%
20%
Sunshine amount - Maximum monthly
74%
74%
Sunshine amount - Minimum monthly
50%
54%
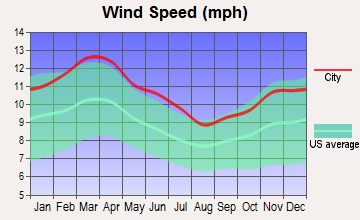
Wind speed - Average
8.8 mph
10.3 mph
Average climate in Memphis, Tennessee
Average climate in Arlington, Texas
Air pollution
Type
AQI
CO
NO2
OZONE
PM10
PM25
SO2
Year
Memphis
Arlington
Memphis
Arlington
Memphis
Arlington
Memphis
Arlington
Memphis
Memphis
Arlington
Memphis
Arlington
2018
81
86
0.24
N/A
10.4
5.8
27.1
27.1
19.0
N/A
8.1
9.4
0.4
0.4
2017
74
86
0.24
N/A
10.2
6.2
28.1
27.2
17.5
N/A
7.9
9.1
0.3
0.3
2016
76
76
0.24
N/A
10.2
6.3
28.8
25.5
19.6
N/A
8.5
8.2
0.9
0.2
2015
77
80
0.26
N/A
11.1
6.5
26.9
24.8
N/A
N/A
9.2
8.6
1.0
0.3
2014
75
78
0.27
0.22
10.1
6.8
26.5
26.6
N/A
N/A
9.9
9.3
1.3
0.3
2013
74
96
0.31
0.25
8.3
6.4
26.6
27.2
N/A
N/A
10.2
11.0
1.0
0.2
2012
94
108
0.32
0.26
9.3
7.8
29.7
30.3
N/A
N/A
10.7
10.5
0.6
0.3
2011
93
96
0.34
0.23
10.0
8.2
29.0
30.7
N/A
N/A
11.1
9.5
0.5
0.6
2010
95
76
0.43
0.23
10.3
8.9
27.9
27.7
N/A
N/A
12.9
8.4
N/A
0.7
2009
86
91
0.35
0.25
8.7
8.7
24.9
29.5
N/A
N/A
11.8
8.5
N/A
0.5
2008
94
92
0.36
0.25
10.3
9.6
26.3
25.8
N/A
N/A
13.2
10.7
N/A
0.5
2007
106
95
0.47
0.30
11.2
10.6
26.7
24.6
N/A
N/A
14.8
9.8
5.6
0.5
2006
108
102
0.43
0.34
13.0
10.4
26.8
29.7
N/A
N/A
14.7
9.9
6.3
0.8
2005
110
110
0.46
0.34
10.1
11.7
26.9
28.4
N/A
N/A
17.9
11.3
4.9
1.0
2004
98
90
0.51
0.39
N/A
10.8
24.9
25.4
N/A
N/A
14.5
N/A
5.9
0.9
2003
110
97
0.57
0.40
20.1
11.1
25.3
27.2
N/A
N/A
15.0
N/A
5.8
1.0
2002
110
97
0.58
0.37
20.4
11.8
25.1
25.8
15.6
N/A
N/A
N/A
4.5
0.6
2001
111
88
0.66
0.48
24.7
14.7
26.0
25.0
22.7
N/A
N/A
N/A
6.1
1.1
2000
103
104
0.63
0.55
25.2
14.5
26.2
26.2
24.9
N/A
N/A
N/A
6.4
1.3
Natural disasters
Type
Memphis
Arlington
Tornado activity compared to U.S. average
198.6%
254.3%
Earthquake activity compared to U.S. average
474%
558.3%
Natural disasters compared to U.S. average
18%
23%
Transportation
Memphis has a public transit system called MATA, which serves the city and suburbs. Arlington is one of the largest cities in the U.S. without a comprehensive public transportation system, but ride shares are common and a VIA pilot program offerings shared van rides.
Transport
Type
Memphis
Arlington
Amtrak stations
1
0
Amtrak stations nearby
1
2
FAA registered aircraft
1
362
FAA registered aircraft manufacturers and dealers
52
5
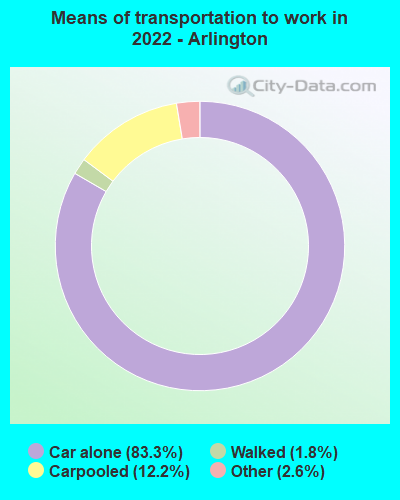
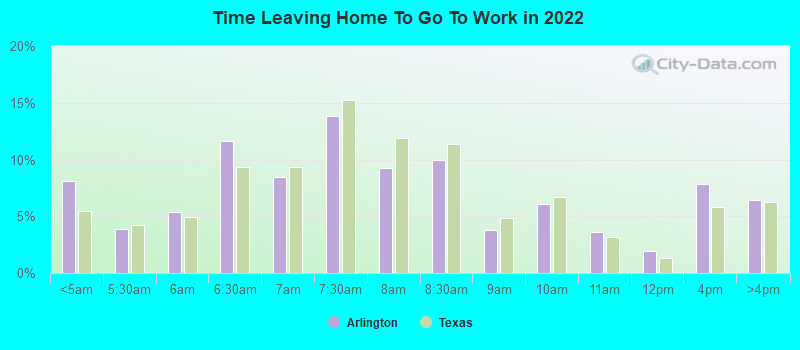
Means of transportation to work
Type
Memphis
Arlington
Bicycle
0%
0.2%
Bus
0.4%
0%
Carpooled
7.5%
11.9%
Car alone
88.8%
85%
Motorcycle
0.1%
0.1%
Walked
1.2%
1.4%
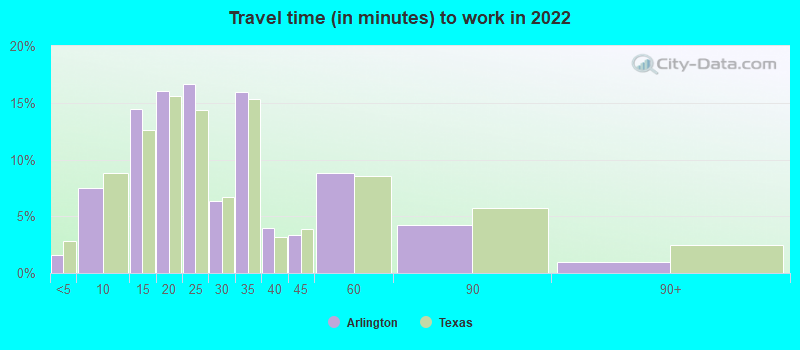
Average travel time to work
Type
Memphis
Arlington
Average
27 min
26.1 min
Other means
22.5 min
27.6 min
Public transportation
43.5 min
45.1 min
Private vehicle occupancy
Type
Memphis
Arlington
Average
1.1
1.2
Drove alone
89.9%
88.7%
In 2 person carpool
7.9%
7.8%
In 3 person carpool
1.6%
2.2%
In 4 person carpool
0.4%
0.8%
In 5-6 person carpool
0.2%
0.4%
How many people usually rode to work in the car, truck or van.
Real Estate
The housing market in Memphis is quite affordable compared to the national average. Both rent and home ownership are less costly here. Conversely, Arlington’s real estate prices are somewhat higher, but still reasonable compared to many other major cities
Neighborhoods
Memphis hosts historic neighborhoods like Midtown and Cooper-Young that offer a close-knit community feel. Arlington’s Ballpark, Entertainment District, and fielder neighborhoods are desired for their amenities and proximity to major attractions.
Houses and residents
Type
Memphis
Arlington
Houses
288,491
156,653
Average household size (people)
2.5
2.7
Median year apartment built
1972
1983
Median year house/condo built
1967
1984
Length of stay in the house since moving in
16.2 years
13 years
Houses occupied
256,968 (89.1%)
146,888 (93.8%)
Houses occupied by owners
119,622 (46.6%)
78,883 (53.7%)
Houses occupied by renters
137,346 (53.4%)
68,005 (46.3%)
Median rent asked for vacant for-rent units
$760.83
$1,609
Median monthly housing costs
$967
$1,220
Median price asked for vacant for-sale houses and condos
$201,932
$199,415
Estimated median house or condo value
$142,800
$254,700
Median numbers of rooms
5.5
5.4
Median number of rooms in apartments
4.8
4.1
Median number of rooms in houses and condos
6.6
6.5
Median house price - detached houses
$205,904
$265,594
Median house price - in 2-unit structures
Over $1,000,000
$415,006
Median house price - in 3-to-4-unit structures
$145,165
$224,044
Median house price - in 5 or more unit structures
$201,411
$131,545
Median house price - mobile homes
$93,577
$92,300
Median house price - occupied boats, rvs, vans etc.
$39,582
$23,762
Median house price - Townhouses or other attached units
$170,154
$171,140
Median house price - All housing units
$204,886
$259,527
Median house age
52
37
Renting percentage
48.1%
42.6%
Housing density (houses/condos per square mile)
1,032.8
1,634.9
House value disparities
44.1%
25%
Household income disparities
48.2%
43.9%
Median household income for houses/condes with a mortgage
$72,611
$97,883
Median household income for apartments without a mortgage
$53,615
$67,452
Housing units without a mortgage
1,461 (2%)
948 (2%)
Housing units with both a second mortgage and home equity loan
3,970 (5.4%)
1,684 (3.6%)
Housing units with a mortgage
71,386 (98%)
46,456 (98%)
Housing units with a home equity loan
322 (0.4%)
0 (0%)
Housing units with a second mortgage
5,907 (8.1%)
1,967 (4.1%)
House/condo owner moved in on average (years ago)
16
13
House/condo renter moved in on average (years ago)
1
1
Housing units lacking complete kitchen facilities
5.7%
1.7%
Housing units lacking complete plumbing facilities
4.6%
1%
Housing units in structures
Housing units in structures
Memphis
Arlington
One, detached
61.0%
60.2%
One, attached
5.8%
10.8%
Two
2.1%
1.5%
3 or 4
7.4%
4.3%
5 to 9
9.1%
5.7%
10 to 19
5.6%
7.7%
20 to 49
1.8%
3.3%
50 or more
6.2%
5.2%
Mobile homes
0.8%
1.3%
Boats, RVs, vans, etc.
0.1%
0.1%
Median real estate property taxes paid for housing units
Self-employed workers in own not incorporated business
16,111
10,953
State government workers
7,650
6,771
Unpaid family workers
668
396
Industries and Occupations
As mentioned, Memphis boasts a strong logistics sector, thanks to companies like FedEx, while health care and education also play a big part in its economy. Arlington has a diversified economy encompassing industries such as aerospace, manufacturing, health services, and banking.
Both cities have top-notch medical facilities. The Methodist Healthcare system dominates in Memphis, while the Texas Health Resources and Arlington Memorial Hospital are noteworthy in Arlington.
Health (county statistics)
Type
Memphis
Arlington
General health status score of residents in this county from 1 (poor) to 5 (excellent)
Memphis' infrastructure provides both historic and modern landscapes. Arlington's infrastructure is relatively newer, with a variety of attractive neighborhoods and communities. Both cities have good public amenities like parks, museums, libraries, and other institutions.
Infrastructure
Type
Memphis
Arlington
Hospitals
35
39
TV stations
14
25
Arenas or stadiums
2
1
Bank branches located here
160
74
Bank institutions located here
33
23
Main business address for public companies
17
2
Drinking water stations with reported violations in the past
HMDA - Conventional home purchase loans - Applications denied
Year
Memphis
Arlington
1999
2,195
1,768
2000
2,406
1,198
2001
1,775
1,140
2002
1,444
847
2003
2,116
1,216
2004
3,266
1,504
2005
4,730
2,158
2006
5,833
2,107
2007
3,559
1,390
2008
1,174
558
2009
345
235
Culture and Food
Memphis is often referred to as the home of the Blues. Its food is renowned worldwide for its soul food and barbeque. Arlington offers a Texas-style experience, rich in southwestern culture and Tex-Mex food.
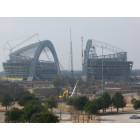
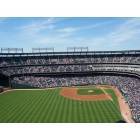
Sports Teams
Arlington is a sports lover’s paradise hosting professional teams like the Dallas Cowboys (NFL) and the Texas Rangers (MLB). While Memphis does not have as many pro sports teams, they rally behind the Grizzlies (NBA) and the Redbirds (Minor League Baseball).


 Memphis, TN
 Arlington, TX