Memphis, TN, and Lexington-Fayette, KY, are two vibrant and diverse cities with unique features that they offer to both residents and tourists. Memphis is known for its rich musical history, barbeque, and strong connections to the civil rights movement. On the other hand, Lexington-Fayette exudes a small-town charm, distinguished for its horse racing identity and quality bourbon. When comparing these two cities, factors such as crime and safety, weather, cost of living, education, economy, infrastructure, industries, public transit, taxes, neighborhoods, cultural life, sports teams, geographical conditions, and health care are considered.
Distance between
Memphis, TN and
Lexington-Fayette, KY : 364.3 miles
Memphis's population is larger by 95%. Its population has decreased by 21,973 people (3.4%) since 2000. The population of Lexington-Fayette has grown by 61,281 people (23.5%) during that time.
The crime rate is higher in Memphis than Lexington-Fayette. According to NeighborhoodScout, Memphis has a crime index of 2, meaning it's safer than merely 2% of U.S. cities. Lexington-Fayette is safer, with a crime index of 19, which indicates it is safer than 19% of other U.S. cities. While both cities are striving to improve their crime rates, potential residents and tourists should take these statistics into account when considering relocation or visiting these areas.
Cost of Living
The cost of living in Memphis, TN, is generally lower compared to Lexington-Fayette, KY. Factors that contribute to this differential include housing costs, groceries, utilities, transportation, and healthcare. According to DataUSA, the median household income in Memphis is significantly lower than in Lexington, which may also explain the city's lower cost of living.
Income Tax
Tennessee, including Memphis, does not have a state income tax, which can be beneficial for potential residents. Conversely, Kentucky's income tax is a flat rate of 5% for all taxpayers.
Property Tax
The average property tax rate in Memphis is approximately 1.5%, depending on the assessed value of the property. Lexington-Fayette’s property tax rate typically sits around 1.2%, somewhat lower than Memphis.
Sales Tax
The combined sales tax rate for Memphis is 9.75%, which is higher than Lexington-Fayette's rate of 6%. These rates can affect the overall cost of living and should be considered by both potential residents and tourists.
Income
Type
Memphis
Lexington-Fayette
Estimated median household income
$44,317
$60,942
Estimated per capita income
$28,571
$37,011
Cost of living index (U.S. average is 100)
85.5
89.3
If you make $50,000 in Memphis, you will have to make $52,222 in Lexington-Fayette to maintain the same standard of living.
Geographical Conditions
Memphis is located on the fourth Chickasaw Bluff along the Mississippi River, giving it a significant logistical advantage. Lexington-Fayette is nestled within Kentucky's scenic Bluegrass region, renowned for its horse farms and bourbon distilleries.
Both cities host reputable academic institutions. Memphis is the home to the University of Memphis, Southern College of Optometry, and Rhodes College. Lexington-Fayette, known as the "Horse Capital of the World", is host to the University of Kentucky and Transylvania University, the first university in Kentucky and 16th in the USA. Both cities provide varying educational opportunities for potential students and residents.
Memphis has a strong economy anchored by transportation, shipping, and manufacturing sectors, while Lexington-Fayette's economy is dominated by education, health care, and manufacturing industries. Despite the robust economies in both cities, the unemployment rate in Memphis is typically higher than in Lexington-Fayette.
Biggest Employers
Federal Express, the multinational courier, is the largest employer in Memphis, followed by Methodist Le Bonheur Healthcare and St Jude Children's Research Hospital. In Lexington-Fayette, the University of Kentucky, Fayette County Public Schools, and the Lexington-Fayette Urban County Government are the largest employers.
In Memphis (Shelby County), 62.9% voted for Democrats and 36.7% for Republicans in 2012 Presidential Election. In Lexington-Fayette (Fayette County), 49.3% voted for Democrats and 48.3% for Republicans.
Elections
Type
Democrats
Republicans
Other
Year
Memphis
Lexington-Fayette
Memphis
Lexington-Fayette
Memphis
Lexington-Fayette
2020
64.8%
59.4%
34.2%
38.6%
1.1%
1.9%
2016
62.3%
51.3%
34.7%
41.8%
3.1%
6.9%
2012
62.9%
49.3%
36.7%
48.3%
0.4%
2.3%
2008
63.8%
51.7%
36.2%
46.9%
0.0%
1.3%
2004
57.7%
46.3%
42.0%
53.1%
0.3%
0.6%
2000
56.8%
45.0%
42.3%
51.8%
0.9%
3.2%
1996
78.9%
47.1%
19.6%
46.3%
1.5%
6.6%
Breakdown of population affiliated with a religious congregation
Type
Adherents
Congregations
Religion
Memphis
Lexington-Fayette
Memphis
Lexington-Fayette
SOUTHERN BAPTIST CONVENTION
14.8%
13.7%
15.1%
19.5%
CATHOLIC CHURCH
6.5%
8.8%
2.7%
3.0%
EVANGELICAL PRESBYTERIAN CHURCH
1.5%
0.0%
0.7%
0.0%
EPISCOPAL CHURCH
0.8%
0.9%
1.8%
2.3%
MUSLIM ESTIMATE
0.5%
0.2%
0.8%
0.8%
LUTHERAN CHURCH
0.4%
0.3%
1.0%
1.1%
PRESBYTERIAN CHURCH IN AMERICA
0.4%
0.3%
0.6%
0.8%
SEVENTH DAY ADVENTIST CHURCH
0.4%
0.3%
0.9%
1.5%
EVANGELICAL LUTHERAN CHURCH IN AMERICA
0.1%
0.4%
0.4%
1.1%
VINEYARD USA
0.0%
0.4%
0.1%
0.4%
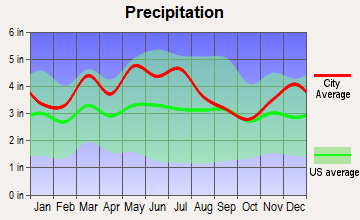
Weather
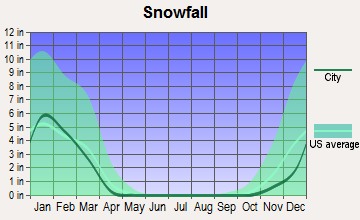
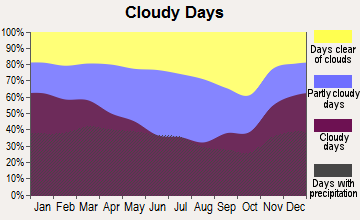
Memphis has a humid subtropical climate with hot summers and mild winters. Lexington-Fayette also experiences a humid subtropical climate, however, their winters can be cold. The weather in both cities would appeal to people who prefer mild to hot climates. Tourists can revel in the pleasant weather in both cities but should take note of potential snow in Lexington-Fayette during winter.
Weather and climate
Type
Memphis
Lexington-Fayette
Temperature - Average
61.9°F
55.3°F
Humidity - Average morning or afternoon humidity
74%
75.8%
Humidity - Differences between morning and afternoon humidity
33%
31%
Humidity - Maximum monthly morning or afternoon humidity
85%
85%
Humidity - Minimum monthly morning or afternoon humidity
52%
54%
Precipitation - Yearly average
54.3 in
45.9 in
Snowfall - Yearly average
8.6 in
35.2 in
Clouds - Number of days clear of clouds
19.7%
14.9%
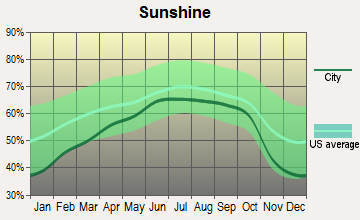
Sunshine amount - Average
68.7%
59.9%
Sunshine amount - Differences during a year
24%
25.5%
Sunshine amount - Maximum monthly
74%
66.2%
Sunshine amount - Minimum monthly
50%
40.7%
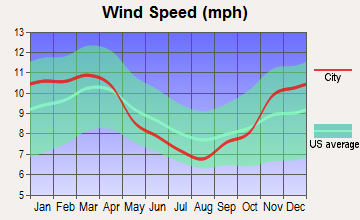
Wind speed - Average
8.8 mph
8.6 mph
Average climate in Memphis, Tennessee
Average climate in Lexington-Fayette, Kentucky
Air pollution
Type
AQI
CO
NO2
OZONE
PM10
PM25
SO2
Year
Memphis
Lexington-Fayette
Memphis
Lexington-Fayette
Memphis
Lexington-Fayette
Memphis
Lexington-Fayette
Memphis
Memphis
Lexington-Fayette
Memphis
Lexington-Fayette
2018
81
63
0.24
N/A
10.4
3.1
27.1
31.6
19.0
N/A
8.1
9.7
0.4
0.1
2017
74
64
0.24
N/A
10.2
4.9
28.1
32.1
17.5
N/A
7.9
7.2
0.3
0.1
2016
76
68
0.24
N/A
10.2
6.6
28.8
33.3
19.6
N/A
8.5
6.9
0.9
0.1
2015
77
71
0.26
N/A
11.1
6.7
26.9
31.4
N/A
N/A
9.2
7.3
1.0
0.1
2014
75
68
0.27
N/A
10.1
6.8
26.5
34.1
N/A
N/A
9.9
7.6
1.3
0.3
2013
74
69
0.31
N/A
8.3
7.3
26.6
31.7
N/A
N/A
10.2
10.0
1.0
0.2
2012
94
81
0.32
N/A
9.3
8.1
29.7
34.9
N/A
N/A
10.7
10.6
0.6
0.8
2011
93
78
0.34
N/A
10.0
8.3
29.0
34.6
N/A
N/A
11.1
11.3
0.5
2.1
2010
95
76
0.43
N/A
10.3
9.5
27.9
34.9
N/A
N/A
12.9
10.0
N/A
2.2
2009
86
75
0.35
N/A
8.7
8.5
24.9
31.1
N/A
N/A
11.8
9.2
N/A
2.7
2008
94
72
0.36
N/A
10.3
7.8
26.3
36.4
N/A
N/A
13.2
9.1
N/A
2.4
2007
106
92
0.47
N/A
11.2
10.9
26.7
37.9
N/A
N/A
14.8
12.9
5.6
4.0
2006
108
65
0.43
N/A
13.0
11.8
26.8
32.8
N/A
N/A
14.7
N/A
6.3
3.8
2005
110
77
0.46
N/A
10.1
12.1
26.9
34.0
N/A
N/A
17.9
N/A
4.9
4.4
2004
98
60
0.51
N/A
N/A
11.6
24.9
28.6
N/A
N/A
14.5
N/A
5.9
3.2
2003
110
67
0.57
N/A
20.1
12.2
25.3
30.3
N/A
N/A
15.0
N/A
5.8
3.5
2002
110
76
0.58
0.04
20.4
12.1
25.1
31.3
15.6
N/A
N/A
N/A
4.5
3.6
2001
111
69
0.66
0.07
24.7
13.2
26.0
30.9
22.7
N/A
N/A
N/A
6.1
4.4
2000
103
79
0.63
0.14
25.2
13.4
26.2
32.7
24.9
N/A
N/A
N/A
6.4
5.0
Natural disasters
Type
Memphis
Lexington-Fayette
Tornado activity compared to U.S. average
198.6%
126.8%
Earthquake activity compared to U.S. average
474%
171.6%
Natural disasters compared to U.S. average
18%
14%
Transportation
Memphis offers several modes of transportation such as buses, trolley lines, and Amtrak services. It is also known for its wide lanes, short commute times, and bike-friendly streets. Lexington-Fayette's public transportation system includes buses, bike sharing, and ride-hailing services. Lexington's roads are also less congested compared to other cities, leading to shorter commute times.
Transport
Type
Memphis
Lexington-Fayette
Amtrak stations
1
0
Amtrak stations nearby
1
0
FAA registered aircraft
1
0
FAA registered aircraft manufacturers and dealers
52
0
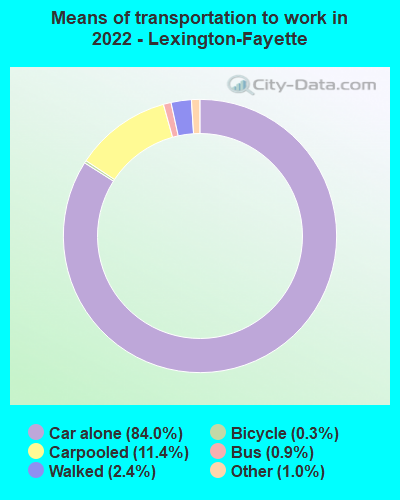
Means of transportation to work
Type
Memphis
Lexington-Fayette
Bicycle
0%
0.6%
Bus
0.4%
1.2%
Carpooled
7.5%
8.3%
Car alone
88.8%
86.5%
Taxicab
0.1%
0.1%
Walked
1.2%
2.6%
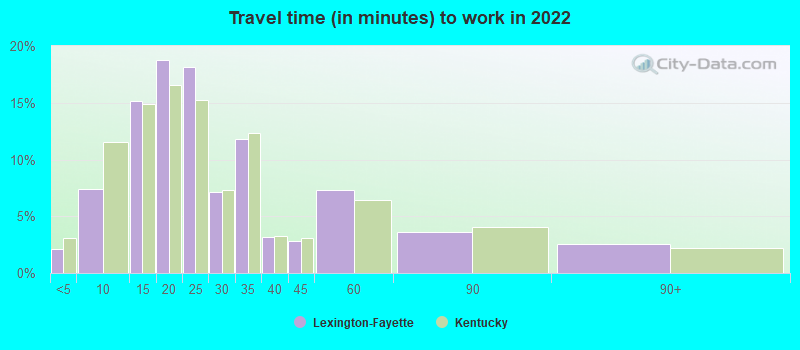
Average travel time to work
Type
Memphis
Lexington-Fayette
Average
27 min
26.5 min
Other means
22.5 min
20.2 min
Public transportation
43.5 min
35 min
Private vehicle occupancy
Type
Memphis
Lexington-Fayette
Average
1.1
1.1
Drove alone
89.9%
90.6%
In 2 person carpool
7.9%
7.7%
In 3 person carpool
1.6%
1.2%
In 4 person carpool
0.4%
0.3%
In 5-6 person carpool
0.2%
0.1%
How many people usually rode to work in the car, truck or van.
Real Estate
Memphis typically has lower real estate prices compared to Lexington-Fayette, reflecting the lower cost of living in the former. However, both cities offer a diverse range of housing options, from downtown apartments to suburban single-family homes, catering to a range of lifestyle preferences and budgets. Consequently, both cities are attractive to people seeking to buy or rent homes.
Neighborhoods
Memphis neighborhoods, such as Downtown, Harbor Town, and Midtown, offer historic charm, great food, and cultural experiences. Lexington-Fayette neighborhoods like Chevy Chase and Beaumont offer the friendly charm of a small town while still being close to the city's amenities. While both Memphis and Lexington-Fayette exude their own distinctive vibes through their neighborhoods, they both cater to families, singles, young professionals, and retirees alike.
Houses and residents
Type
Memphis
Lexington-Fayette
Houses
288,491
147,590
Average household size (people)
2.5
2.3
Median year apartment built
1972
1983
Median year house/condo built
1967
1985
Length of stay in the house since moving in
16.2 years
12 years
Houses occupied
256,968 (89.1%)
139,303 (94.4%)
Houses occupied by owners
119,622 (46.6%)
75,129 (53.9%)
Houses occupied by renters
137,346 (53.4%)
64,174 (46.1%)
Median rent asked for vacant for-rent units
$760.83
$1,514
Median monthly housing costs
$967
$1,026
Median price asked for vacant for-sale houses and condos
$201,932
$229,178
Estimated median house or condo value
$142,800
$242,400
Median numbers of rooms
5.5
5.4
Median number of rooms in apartments
4.8
4
Median number of rooms in houses and condos
6.6
7
Median house price - detached houses
$205,904
$300,664
Median house price - in 2-unit structures
Over $1,000,000
$297,942
Median house price - in 3-to-4-unit structures
$145,165
$165,223
Median house price - in 5 or more unit structures
$201,411
$179,160
Median house price - mobile homes
$93,577
$37,529
Median house price - Townhouses or other attached units
$170,154
$232,720
Median house price - All housing units
$204,886
$289,099
Median house age
52
37
Renting percentage
48.1%
44.1%
Housing density (houses/condos per square mile)
1,032.8
518.7
House value disparities
44.1%
33%
Household income disparities
48.2%
46.3%
Median household income for houses/condes with a mortgage
$72,611
$95,171
Median household income for apartments without a mortgage
$53,615
$74,841
Housing units without a mortgage
1,461 (2%)
2,236 (4.2%)
Housing units with both a second mortgage and home equity loan
3,970 (5.4%)
6,457 (12.1%)
Housing units with a mortgage
71,386 (98%)
51,182 (95.8%)
Housing units with a home equity loan
322 (0.4%)
156 (0.3%)
Housing units with a second mortgage
5,907 (8.1%)
7,551 (14.1%)
House/condo owner moved in on average (years ago)
16
9
House/condo renter moved in on average (years ago)
1
1
Housing units lacking complete kitchen facilities
5.7%
1.3%
Housing units lacking complete plumbing facilities
4.6%
0.4%
Housing units in structures
Housing units in structures
Memphis
Lexington-Fayette
One, detached
61.0%
58.7%
One, attached
5.8%
6.4%
Two
2.1%
3.0%
3 or 4
7.4%
4.9%
5 to 9
9.1%
7.5%
10 to 19
5.6%
8.4%
20 to 49
1.8%
4.3%
50 or more
6.2%
5.6%
Mobile homes
0.8%
1.3%
Boats, RVs, vans, etc.
0.1%
0.0%
Median real estate property taxes paid for housing units
Self-employed workers in own not incorporated business
16,111
9,814
State government workers
7,650
15,501
Unpaid family workers
668
346
Industries and Occupations
Shipping and transportation provide the most jobs in Memphis because of its geographical location on the Mississippi River and its massive airport. In comparison, education, healthcare, and retail trade top the list of industries in Lexington-Fayette. Both cities therefore offer a variety of job opportunities, albeit in different sectors.
Both Memphis and Lexington-Fayette boast first-class healthcare facilities. Memphis is home to entities like Baptist Memorial Health Care, Methodist Le Bonheur Healthcare, and St. Jude Children's Research Hospital. Lexington-Fayette offers top-notch healthcare at the University of Kentucky Healthcare and Baptist Health Lexington.
Health (county statistics)
Type
Memphis
Lexington-Fayette
General health status score of residents in this county from 1 (poor) to 5 (excellent)
Memphis has a substantial infrastructure supporting its distribution and logistics sectors, including the Memphis International Airport, the world's second busiest cargo airport. Lexington-Fayette’s economy, on the other hand, is focused on education and healthcare sectors; hence it features numerous hospitals and colleges, forming the backbone of its infrastructure.
HMDA - Conventional home purchase loans - Applications denied
Year
Memphis
Lexington-Fayette
1999
2,195
756
2000
2,406
655
2001
1,775
568
2002
1,444
463
2003
2,116
529
2004
3,266
777
2005
4,730
997
2006
5,833
751
2007
3,559
517
2008
1,174
325
2009
345
230
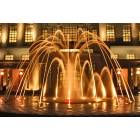
Culture and Food
Memphis is renowned for its deep cultural roots in the Blues, Rock 'n' Roll, and legendary BBQ. It also played a pivotal role in the civil rights movement, as seen in the National Civil Rights Museum. Lexington-Fayette is known for its rich equine culture, historic bourbon distilleries, and southern cuisine. Both cities offer unique cultural and culinary experiences that would attract potential residents and tourists alike.
Sports Teams
Memphis is home to the Memphis Grizzlies (NBA) and the Memphis Redbirds (a Triple-A minor league baseball team). Lexington-Fayette doesn't have any professional sports teams; however, the city is passionate about college sports, most notably the Kentucky Wildcats basketball team.


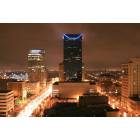
 Memphis, TN
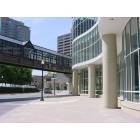
 Lexington-Fayette, KY