Our comparison between Memphis, Tennessee, and Montgomery, Alabama, takes into account key factors such as crime rate, cost of living, quality of education, employment opportunities, local culture, and more. This review will divulge the unique characteristics and compelling points about each city, providing a balanced view for those planning either to visit or to relocate.
Distance between
Memphis, TN and
Montgomery, AL : 285.0 miles
Memphis's population is larger by 216%. Its population has decreased by 21,973 people (3.4%) since 2000. The population of Montgomery has decreased by 2,903 people (1.4%) during that time.
Comparably, both Memphis and Montgomery experience higher than average crime rates. However, Memphis has been working actively towards reducing crime, particularly through community-oriented strategies. Montgomery, meanwhile, has been investing in more surveillance technologies to increase safety. Nevertheless, like any city, crime can vary significantly between neighborhoods.
City-data.com crime index counts serious crimes and violent crime more heavily. It adjusts for the number of visitors and daily workers commuting into cities. (higher means more crime, U.S. average = 301.1)
City-data.com crime index counts serious crimes and violent crime more heavily. It adjusts for the number of visitors and daily workers commuting into cities. (higher means more crime, U.S. average = 301.1)
Sex Offenders
According to our data, there are 2,629 registered sex offenders living in Memphis and 434 registered sex offenders living in . The ratio of residents to sex offenders in Memphis is 248 to 1; the ratio in Montgomery is 467 to 1. The number of registered sex offenders compared to the number of residents is larger in Memphis than in Montgomery.
Cost of Living
The cost of living is one of the significant advantages of living in both cities. Compared to the US average, both Montgomery and Memphis are notably more affordable, particularly regarding housing costs. However, Montgomery edges out with a marginally lower cost of living, mainly due to cheaper housing options.
Income Tax
Alabama has a state income tax that ranges from 2% to 5%. As mentioned above, Tennessee does not impose a state income tax, which can be a significant advantage for those with higher incomes residing in Memphis.
Property Tax
Property taxes are generally lower in the South, and this rule applies in these two cities. Memphis has slightly higher property tax rates than Montgomery on average, but this can vary depending on the specific location and property value.
Sales Tax
Both Tennessee and Alabama have relatively high sales taxes. However, Tennessee does not levy a state income tax, which can offset this. Montgomery has a combined city and state sales tax rate of 10%, and Memphis has a combined rate of 9.75%.
Income
Type
Memphis
Montgomery
Estimated median household income
$44,317
$46,957
Estimated per capita income
$28,571
$27,253
Cost of living index (U.S. average is 100)
85.5
84.6
If you make $50,000 in Montgomery, you will have to make $50,532 in Memphis to maintain the same standard of living.
Geographical Conditions
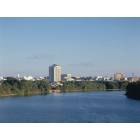
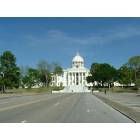
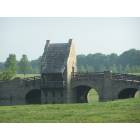
Memphis, located on the Mississippi River, features a mix of landscapes, from urban cityscape to lush parklands. Montgomery, located on the Alabama River, offers Southern charm with garden parks and historic Civil War sites.
Memphis is home to several highly-rated public and private schools and houses many universities, including the well-regarded University of Memphis and Rhodes College. In contrast, Montgomery has made substantial improvements in its education system, with magnet schools performing exceptionally well, and it also hosts several colleges and universities like the prestigious Air University.
Memphis has a diverse economy, enriched by sectors such as Transportation, Manufacturing, and Healthcare. On the other side, Montgomery's economy is heavily focused on government services, with the State of Alabama, Montgomery Public Schools, and the Federal Government being the top employers.
Biggest Employers
In Memphis, some of the significant employers include FedEx, International Paper, and AutoZone. On the other side, the State of Alabama, Montgomery Public Schools, and the Federal Government are the top employers in Montgomery, reflecting the city's political focus.
In Memphis (Shelby County), 62.9% voted for Democrats and 36.7% for Republicans in 2012 Presidential Election. In Montgomery (Montgomery County), 62.0% voted for Democrats and 37.7% for Republicans.
Elections
Type
Democrats
Republicans
Other
Year
Memphis
Montgomery
Memphis
Montgomery
Memphis
Montgomery
2020
64.8%
65.1%
34.2%
33.6%
1.1%
1.3%
2016
62.3%
61.4%
34.7%
35.5%
3.1%
3.1%
2012
62.9%
62.0%
36.7%
37.7%
0.4%
0.3%
2008
63.8%
59.7%
36.2%
40.3%
0.0%
0.0%
2004
57.7%
50.6%
42.0%
49.4%
0.3%
0.0%
2000
56.8%
50.4%
42.3%
48.4%
0.9%
1.2%
1996
78.9%
48.7%
19.6%
48.0%
1.5%
3.3%
Breakdown of population affiliated with a religious congregation
Type
Adherents
Congregations
Religion
Memphis
Montgomery
Memphis
Montgomery
SOUTHERN BAPTIST CONVENTION
14.8%
18.8%
15.1%
15.3%
CATHOLIC CHURCH
6.5%
4.1%
2.7%
2.5%
EVANGELICAL PRESBYTERIAN CHURCH
1.5%
0.0%
0.7%
0.3%
EPISCOPAL CHURCH
0.8%
1.2%
1.8%
1.7%
MUSLIM ESTIMATE
0.5%
0.4%
0.8%
0.8%
LUTHERAN CHURCH
0.4%
0.2%
1.0%
0.6%
PRESBYTERIAN CHURCH IN AMERICA
0.4%
1.2%
0.6%
2.0%
SEVENTH DAY ADVENTIST CHURCH
0.4%
0.9%
0.9%
1.4%
AMERICAN BAPTIST CHURCHES IN THE USA
0.3%
2.2%
0.6%
0.6%
Weather
Memphis benefits from four distinct seasons with hot summers and mild winters, making it great for outdoor activities all year round. On the other hand, Montgomery has a subtropical climate, with hot, humid summers and mild to cool winters. The city is prone to hurricanes and tropical storms from the Gulf Coast, which might be a consideration for some.
Weather and climate
Type
Memphis
Montgomery
Temperature - Average
61.9°F
64.8°F
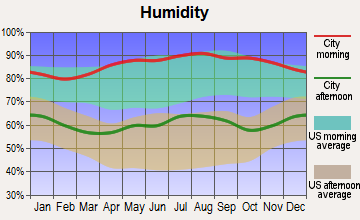
Humidity - Average morning or afternoon humidity
74%
76.7%
Humidity - Differences between morning and afternoon humidity
33%
40%
Humidity - Maximum monthly morning or afternoon humidity
85%
91%
Humidity - Minimum monthly morning or afternoon humidity
52%
51%
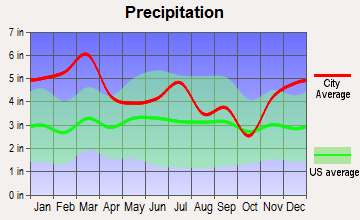
Precipitation - Yearly average
54.3 in
52.5 in
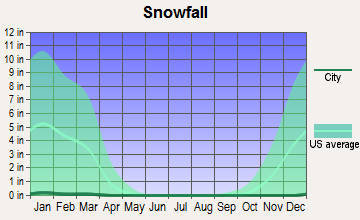
Snowfall - Yearly average
8.6 in
0.8 in
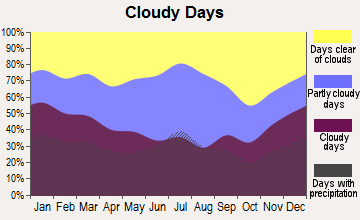
Clouds - Number of days clear of clouds
19.7%
17.9%
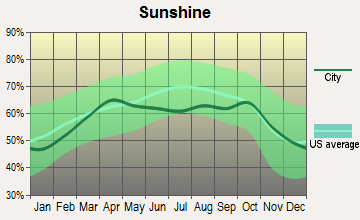
Sunshine amount - Average
68.7%
63.1%
Sunshine amount - Differences during a year
24%
17%
Sunshine amount - Maximum monthly
74%
64%
Sunshine amount - Minimum monthly
50%
47%
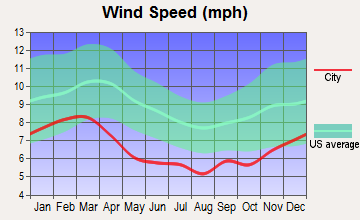
Wind speed - Average
8.8 mph
6.4 mph
Average climate in Memphis, Tennessee
Average climate in Montgomery, Alabama
Air pollution
Type
AQI
CO
NO2
OZONE
PM10
PM25
SO2
Year
Memphis
Montgomery
Memphis
Memphis
Memphis
Montgomery
Memphis
Memphis
Montgomery
Memphis
2018
81
75
0.24
N/A
10.4
N/A
27.1
26.3
19.0
N/A
8.1
13.8
0.4
N/A
2017
74
89
0.24
N/A
10.2
N/A
28.1
27.8
17.5
N/A
7.9
11.7
0.3
N/A
2016
76
75
0.24
N/A
10.2
N/A
28.8
29.6
19.6
N/A
8.5
8.8
0.9
N/A
2015
77
76
0.26
N/A
11.1
N/A
26.9
26.8
N/A
N/A
9.2
10.6
1.0
N/A
2014
75
55
0.27
N/A
10.1
N/A
26.5
28.2
N/A
N/A
9.9
N/A
1.3
N/A
2013
74
53
0.31
N/A
8.3
N/A
26.6
27.2
N/A
N/A
10.2
N/A
1.0
N/A
2012
94
63
0.32
N/A
9.3
N/A
29.7
29.7
N/A
N/A
10.7
N/A
0.6
N/A
2011
93
67
0.34
N/A
10.0
N/A
29.0
31.2
N/A
N/A
11.1
N/A
0.5
N/A
2010
95
84
0.43
N/A
10.3
N/A
27.9
31.2
N/A
N/A
12.9
12.5
N/A
N/A
2009
86
68
0.35
N/A
8.7
N/A
24.9
27.1
N/A
N/A
11.8
10.5
N/A
N/A
2008
94
79
0.36
N/A
10.3
N/A
26.3
30.4
N/A
N/A
13.2
N/A
N/A
N/A
2007
106
90
0.47
N/A
11.2
N/A
26.7
34.0
N/A
N/A
14.8
N/A
5.6
N/A
2006
108
73
0.43
N/A
13.0
N/A
26.8
31.4
N/A
N/A
14.7
N/A
6.3
N/A
2005
110
71
0.46
N/A
10.1
N/A
26.9
28.0
N/A
N/A
17.9
N/A
4.9
N/A
2004
98
62
0.51
N/A
N/A
N/A
24.9
26.0
N/A
N/A
14.5
N/A
5.9
N/A
2003
110
67
0.57
N/A
20.1
N/A
25.3
25.4
N/A
N/A
15.0
N/A
5.8
N/A
2002
110
78
0.58
N/A
20.4
N/A
25.1
28.6
15.6
N/A
N/A
N/A
4.5
N/A
2001
111
94
0.66
N/A
24.7
N/A
26.0
28.3
22.7
N/A
N/A
N/A
6.1
N/A
2000
103
108
0.63
N/A
25.2
N/A
26.2
35.9
24.9
N/A
N/A
N/A
6.4
N/A
Natural disasters
Type
Memphis
Montgomery
Tornado activity compared to U.S. average
198.6%
144.5%
Earthquake activity compared to U.S. average
474%
166.1%
Natural disasters compared to U.S. average
18%
15%
Transportation
Both cities give way for an easy commute, with most residents driving their cars. However, Memphis has a more robust public transit system and better walkability, especially in the downtown area. Montgomery has a less extensive public transit system, but the Montgomery Area Transit System provides adequate bus service.
Transport
Type
Memphis
Montgomery
Amtrak stations
1
1
Amtrak stations nearby
1
1
FAA registered aircraft
1
168
FAA registered aircraft manufacturers and dealers
52
9
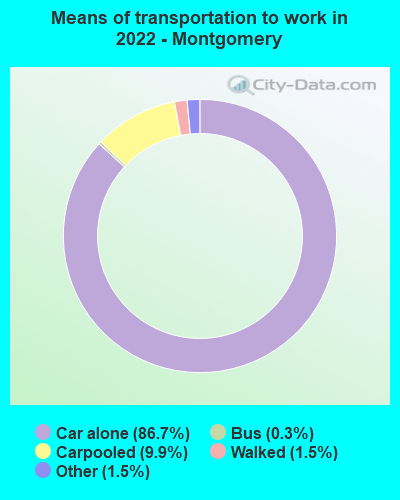
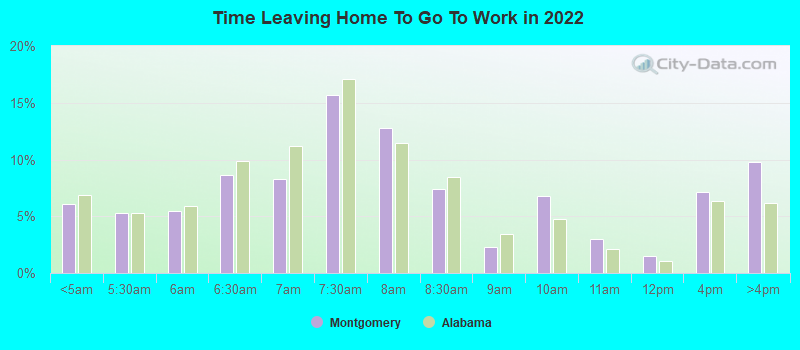
Means of transportation to work
Type
Memphis
Montgomery
Bus
0.4%
0.3%
Carpooled
7.5%
8.1%
Car alone
88.8%
89.9%
Taxicab
0.1%
0.2%
Walked
1.2%
1.1%
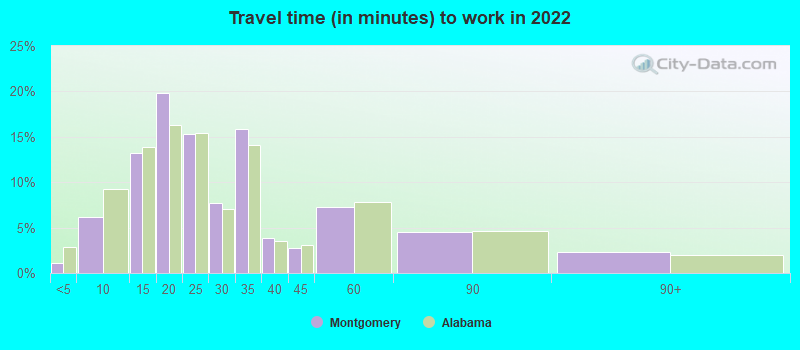
Average travel time to work
Type
Memphis
Montgomery
Average
27 min
26.5 min
Other means
22.5 min
19.9 min
Public transportation
43.5 min
31.7 min
Private vehicle occupancy
Type
Memphis
Montgomery
Average
1.1
1.1
Drove alone
89.9%
90.3%
In 2 person carpool
7.9%
7.7%
In 3 person carpool
1.6%
1.1%
In 4 person carpool
0.4%
0.4%
In 5-6 person carpool
0.2%
0.1%
In 7+ person carpool
0.1%
0.3%
How many people usually rode to work in the car, truck or van.
Real Estate
Memphis' real estate market is highly affordable and offers a variety of options, from downtown city living to suburban and rural options. Compared to Montgomery, homes in Memphis are generally valued higher. Montgomery offers more affordable housing options overall, with a median home price below the national average.
Neighborhoods
Both cities boast a variety of neighborhoods to suit different lifestyles. Memphis offers Downtown for the urbanite, Collierville for the family-oriented, and Germantown for those seeking luxury. Montgomery offers Old Cloverdale for a historic vibe, Hampstead for a planned community feel, and Dalraida for its family-friendly atmosphere.
Houses and residents
Type
Memphis
Montgomery
Houses
288,491
93,055
Average household size (people)
2.5
2.4
Median year apartment built
1972
1981
Median year house/condo built
1967
1979
Length of stay in the house since moving in
16.2 years
14.9 years
Houses occupied
256,968 (89.1%)
81,529 (87.6%)
Houses occupied by owners
119,622 (46.6%)
45,969 (56.4%)
Houses occupied by renters
137,346 (53.4%)
35,560 (43.6%)
Median rent asked for vacant for-rent units
$760.83
$1,021
Median monthly housing costs
$967
$926
Median price asked for vacant for-sale houses and condos
$201,932
$177,602
Estimated median house or condo value
$142,800
$136,800
Median numbers of rooms
5.5
5.7
Median number of rooms in apartments
4.8
4.4
Median number of rooms in houses and condos
6.6
6.7
Median house price - detached houses
$205,904
$182,881
Median house price - in 2-unit structures
Over $1,000,000
$83,037
Median house price - in 3-to-4-unit structures
$145,165
$87,195
Median house price - in 5 or more unit structures
$201,411
$55,784
Median house price - mobile homes
$93,577
$154,829
Median house price - Townhouses or other attached units
$170,154
$110,664
Median house price - All housing units
$204,886
$179,453
Median house age
52
43
Renting percentage
48.1%
41.1%
Housing density (houses/condos per square mile)
1,032.8
598.9
House value disparities
44.1%
41.3%
Household income disparities
48.2%
46.9%
Median household income for houses/condes with a mortgage
$72,611
$69,253
Median household income for apartments without a mortgage
$53,615
$43,782
Housing units without a mortgage
1,461 (2%)
462 (1.6%)
Housing units with both a second mortgage and home equity loan
3,970 (5.4%)
1,755 (6.1%)
Housing units with a mortgage
71,386 (98%)
28,109 (98.4%)
Housing units with a home equity loan
322 (0.4%)
309 (1.1%)
Housing units with a second mortgage
5,907 (8.1%)
2,440 (8.5%)
House/condo owner moved in on average (years ago)
16
14
House/condo renter moved in on average (years ago)
1
1
Housing units lacking complete kitchen facilities
5.7%
4%
Housing units lacking complete plumbing facilities
4.6%
3.7%
Housing units in structures
Housing units in structures
Memphis
Montgomery
One, detached
61.0%
70.2%
One, attached
5.8%
3.4%
Two
2.1%
0.9%
3 or 4
7.4%
4.3%
5 to 9
9.1%
8.7%
10 to 19
5.6%
7.0%
20 to 49
1.8%
1.1%
50 or more
6.2%
2.0%
Mobile homes
0.8%
2.4%
Boats, RVs, vans, etc.
0.1%
0.0%
Median real estate property taxes paid for housing units
Self-employed workers in own not incorporated business
16,111
4,332
State government workers
7,650
6,387
Unpaid family workers
668
0
Industries and Occupations
In Memphis, the main industries include Transportation, Manufacturing, and Healthcare. In contrast, Montgomery is principally driven by Public Administration, Healthcare, and Retail. Both cities offer a varied mix of white and blue-collar jobs to cater to different professionals.
Both cities offer high-quality healthcare facilities. Memphis is home to St. Jude Children’s Research Hospital, a leading institution for pediatric treatment and research. Montgomery, meanwhile, benefits from excellent healthcare institutions like the Jackson Hospital and Baptist Medical Center South.
Health (county statistics)
Type
Memphis
Montgomery
General health status score of residents in this county from 1 (poor) to 5 (excellent)
Both cities have high-quality infrastructure systems, but Memphis offers a more extensive network of highways, a bustling international airport, and the nation's largest cargo airport. Montgomery has a significant advantage in waterway transportation, as it sits on the Alabama River, providing excellent waterway access for commerce.
Infrastructure
Type
Memphis
Montgomery
Hospitals
35
14
TV stations
14
11
Arenas or stadiums
2
2
Bank branches located here
160
69
Bank institutions located here
33
18
Main business address for public companies
17
3
Drinking water stations with no reported violations in the past
0
3
Drinking water stations with reported violations in the past
HMDA - Conventional home purchase loans - Applications denied
Year
Memphis
Montgomery
1999
2,195
1,463
2000
2,406
832
2001
1,775
509
2002
1,444
393
2003
2,116
393
2004
3,266
529
2005
4,730
779
2006
5,833
694
2007
3,559
538
2008
1,174
243
2009
345
100
Culture and Food
Memphis boasts a rich culture steeped in blues music and BBQ cuisine. The city is also home to Elvis Presley's Graceland. Montgomery, as the birthplace of the Civil Rights Movement, is filled with historical landmarks and Southern cuisine. The city also has many art galleries and museums reflecting the cultural history.
Sports Teams
Memphis is home to the Memphis Grizzlies NBA team and a vibrant minor league baseball scene. Montgomery doesn't have any major league sports, but college football, particularly the Alabama State University games, are a significant area of focus.


 Memphis, TN
 Montgomery, AL