Memphis, Tennessee and Shreveport, Louisiana, both have unique characteristics that offer different experiences for both tourists and residents. From cultural differences, cuisine, cost of living, and education, to sports, taxes, and employment opportunities, these cities offer contrasting experiences. Here is a detailed comparison of Memphis and Shreveport, focusing on the specific factors of interest.
Distance between
Memphis, TN and
Shreveport, LA : 284.8 miles
Memphis's population is larger by 241%. Its population has decreased by 21,973 people (3.4%) since 2000. The population of Shreveport has decreased by 16,124 people (8.1%) during that time.
Safe living conditions are a crucial consideration when relocating or visiting as a tourist. Regrettably, crime rates in both Memphis and Shreveport are quite high compared to national averages. In Memphis, crime rates are more concentrated in certain neighborhoods. Similarly, in Shreveport, some areas have higher crime rates than others. Both cities have invested in public safety measures, including expanded police presence and community initiatives to reduce crime. Despite the statistics, many residents and tourists enjoy these cities without experiencing any crime-related issues.
City-data.com crime index counts serious crimes and violent crime more heavily. It adjusts for the number of visitors and daily workers commuting into cities. (higher means more crime, U.S. average = 301.1)
City-data.com crime index counts serious crimes and violent crime more heavily. It adjusts for the number of visitors and daily workers commuting into cities. (higher means more crime, U.S. average = 301.1)
Sex Offenders
According to our data, there are 2,628 registered sex offenders living in Memphis and 662 registered sex offenders living in . The ratio of residents to sex offenders in Memphis is 248 to 1; the ratio in Shreveport is 295 to 1. The number of registered sex offenders compared to the number of residents in Memphis is near to than in Shreveport.
Cost of Living
Compared to national averages, both Memphis and Shreveport have relatively low costs of living. Housing is particularly affordable in both cities. However, compared to Shreveport, Memphis has a slightly higher cost of living, primarily influenced by transport and healthcare. Generally, Shreveport may offer more financial ease for individuals and families on a budget.
Income Tax
Tennessee does not have a state income tax, which could make Memphis more attractive for potential residents. Louisiana, on the other hand, does have a state income tax, which applies to Shreveport residents.
Property Tax
Tennessee has lower property taxes than Louisiana, placing Memphis ahead of Shreveport in this regard. However, these taxes can vary from county to county within each state.
Sales Tax
Tennessee's state sales tax is higher than Louisiana's. Memphis imposes an additional local sales tax, making its combined rate one of the highest in the US. Shreveport has a lower combined state and local sales tax rate, so you might find everyday items less expensive there.
Income
Type
Memphis
Shreveport
Estimated median household income
$44,317
$42,034
Estimated per capita income
$28,571
$27,828
Cost of living index (U.S. average is 100)
85.5
84.7
If you make $50,000 in Shreveport, you will have to make $50,472 in Memphis to maintain the same standard of living.
Geographical Conditions
Memphis is located near the Mississippi River and has a more hilly landscape. Shreveport sits on the Red River and is known for its lush greenery and flat terrain. Both offer beautiful natural landscapes but differ significantly in their topography.
Both cities have a variety of educational institutions. Memphis boasts numerous elementary, middle, and high schools. It's also home to several universities and colleges, including the University of Memphis. Shreveport has several public and private schools, two universities, and a medical school. While both cities offer good educational opportunities, Memphis has a more diverse post-secondary landscape.
Memphis has a more vibrant economy than Shreveport, thanks to its larger population and more diverse industry base. Memphis is a hub for transportation and logistics, health care, and music and entertainment. Shreveport's economy focuses on the gaming industry, healthcare, and some manufacturing. Unemployment rates are slightly higher in Shreveport than in Memphis, although job opportunities depend largely on one's industry and qualifications.
Biggest Employers
FedEx, AutoZone, and St. Jude Children's Research Hospital are among Memphis' major employers. The University of Memphis and several healthcare institutions also provide significant employment. In Shreveport, the gaming industry, Barksdale Air Force Base, Willis-Knighton Health System, and the Caddo Parish School System are significant employers.
In Memphis (Shelby County), 62.9% voted for Democrats and 36.7% for Republicans in 2012 Presidential Election. In Shreveport (Caddo Parish), 52.2% voted for Democrats and 47.1% for Republicans.
Elections
Type
Democrats
Republicans
Other
Year
Memphis
Shreveport
Memphis
Shreveport
Memphis
Shreveport
2020
64.8%
52.8%
34.2%
46.0%
1.1%
1.3%
2016
62.3%
50.7%
34.7%
46.5%
3.1%
2.8%
2012
62.9%
52.2%
36.7%
47.1%
0.4%
0.7%
2008
63.8%
51.4%
36.2%
48.3%
0.0%
0.3%
2004
57.7%
48.8%
42.0%
51.2%
0.3%
0.0%
2000
56.8%
49.8%
42.3%
49.1%
0.9%
1.1%
1996
78.9%
79.7%
19.6%
17.8%
1.5%
2.5%
Breakdown of population affiliated with a religious congregation
Type
Adherents
Congregations
Religion
Memphis
Shreveport
Memphis
Shreveport
SOUTHERN BAPTIST CONVENTION
14.8%
27.7%
15.1%
23.1%
CATHOLIC CHURCH
6.5%
5.6%
2.7%
3.2%
EVANGELICAL PRESBYTERIAN CHURCH
1.5%
0.0%
0.7%
0.0%
EPISCOPAL CHURCH
0.8%
1.2%
1.8%
1.6%
MUSLIM ESTIMATE
0.5%
0.2%
0.8%
0.6%
LUTHERAN CHURCH
0.4%
0.1%
1.0%
0.9%
PRESBYTERIAN CHURCH IN AMERICA
0.4%
0.0%
0.6%
0.3%
SEVENTH DAY ADVENTIST CHURCH
0.4%
0.6%
0.9%
1.9%
INTERNA PENTECO HOLINESS CHURCH
0.1%
0.4%
0.5%
0.6%
SALVATION ARMY
0.0%
0.4%
0.2%
0.3%
Weather
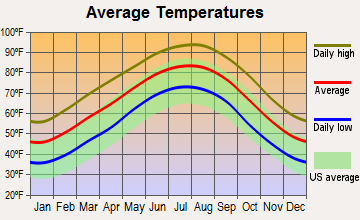
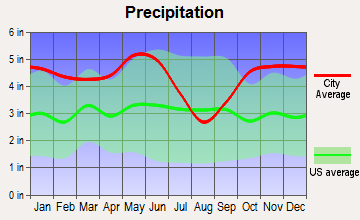
Both cities experience warm temperatures, with Memphis being slightly cooler due to its inland location. Memphis experiences four defined seasons with a pleasantly warm spring and fall. Winters can be cold but are usually mild. Shreveport has a humid subtropical climate with mild winters and hot, humid summers. Rainfall is ample in both cities, but Shreveport gets slightly more rain on average than Memphis.
Weather and climate
Type
Memphis
Shreveport
Temperature - Average
61.9°F
65.5°F
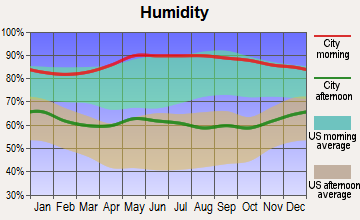
Humidity - Average morning or afternoon humidity
74%
78.3%
Humidity - Differences between morning and afternoon humidity
33%
36%
Humidity - Maximum monthly morning or afternoon humidity
85%
90%
Humidity - Minimum monthly morning or afternoon humidity
52%
54%
Precipitation - Yearly average
54.3 in
51.8 in
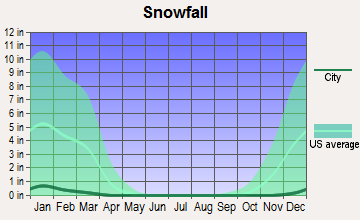
Snowfall - Yearly average
8.6 in
3 in
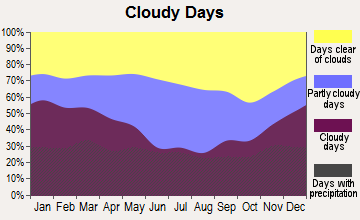
Clouds - Number of days clear of clouds
19.7%
19%
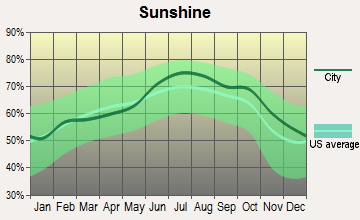
Sunshine amount - Average
68.7%
63.8%
Sunshine amount - Differences during a year
24%
25%
Sunshine amount - Maximum monthly
74%
70%
Sunshine amount - Minimum monthly
50%
45%
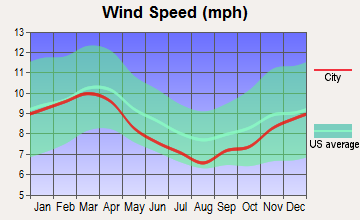
Wind speed - Average
8.8 mph
7.9 mph
Average climate in Memphis, Tennessee
Average climate in Shreveport, Louisiana
Air pollution
Type
AQI
CO
NO2
OZONE
PM10
PM25
SO2
Year
Memphis
Shreveport
Memphis
Memphis
Memphis
Shreveport
Memphis
Shreveport
Memphis
Shreveport
Memphis
Shreveport
2018
81
64
0.24
N/A
10.4
N/A
27.1
25.7
19.0
18.5
8.1
6.5
0.4
0.8
2017
74
69
0.24
N/A
10.2
N/A
28.1
28.0
17.5
15.0
7.9
7.2
0.3
0.7
2016
76
66
0.24
N/A
10.2
N/A
28.8
27.4
19.6
17.4
8.5
9.0
0.9
1.5
2015
77
70
0.26
N/A
11.1
N/A
26.9
27.5
N/A
15.4
9.2
9.3
1.0
1.2
2014
75
69
0.27
N/A
10.1
N/A
26.5
27.1
N/A
15.3
9.9
9.8
1.3
1.1
2013
74
71
0.31
N/A
8.3
N/A
26.6
28.1
N/A
19.2
10.2
9.5
1.0
1.4
2012
94
72
0.32
N/A
9.3
N/A
29.7
28.7
N/A
21.4
10.7
8.5
0.6
N/A
2011
93
90
0.34
N/A
10.0
N/A
29.0
32.1
N/A
21.8
11.1
9.2
0.5
N/A
2010
95
88
0.43
N/A
10.3
N/A
27.9
30.5
N/A
20.3
12.9
9.2
N/A
N/A
2009
86
75
0.35
N/A
8.7
N/A
24.9
25.6
N/A
N/A
11.8
8.7
N/A
2.1
2008
94
72
0.36
N/A
10.3
N/A
26.3
26.1
N/A
N/A
13.2
9.5
N/A
2.3
2007
106
86
0.47
N/A
11.2
N/A
26.7
25.9
N/A
N/A
14.8
10.7
5.6
2.4
2006
108
91
0.43
N/A
13.0
N/A
26.8
29.7
N/A
N/A
14.7
10.9
6.3
2.7
2005
110
90
0.46
N/A
10.1
N/A
26.9
28.5
N/A
N/A
17.9
12.4
4.9
2.3
2004
98
81
0.51
N/A
N/A
N/A
24.9
24.7
N/A
N/A
14.5
10.3
5.9
2.5
2003
110
91
0.57
N/A
20.1
N/A
25.3
26.5
N/A
N/A
15.0
11.9
5.8
2.1
2002
110
80
0.58
N/A
20.4
N/A
25.1
25.8
15.6
N/A
N/A
10.0
4.5
1.3
2001
111
99
0.66
N/A
24.7
N/A
26.0
27.4
22.7
N/A
N/A
10.2
6.1
1.4
2000
103
98
0.63
N/A
25.2
N/A
26.2
27.9
24.9
N/A
N/A
10.7
6.4
1.1
Natural disasters
Type
Memphis
Shreveport
Tornado activity compared to U.S. average
198.6%
226.4%
Earthquake activity compared to U.S. average
474%
448.8%
Natural disasters compared to U.S. average
18%
18%
Transportation
Memphis' transportation network is larger and more accessible, with public buses and trolleys serving the metro area. Shreveport also offers public transit, with a well-functioning bus system. Commute times are relatively short in both cities, but Memphis, as a larger city, may have more congestion during peak periods.
Transport
Type
Memphis
Shreveport
Amtrak stations
1
1
Amtrak stations nearby
1
2
FAA registered aircraft
1
334
FAA registered aircraft manufacturers and dealers
52
2
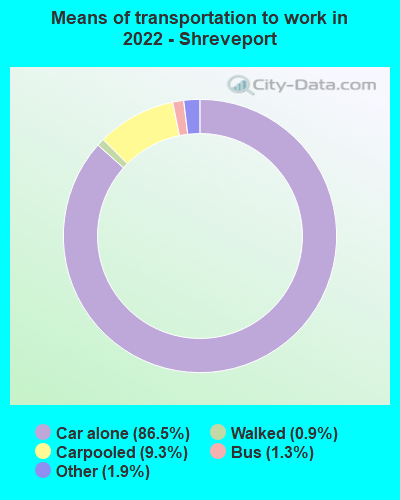
Means of transportation to work
Type
Memphis
Shreveport
Bus
0.4%
1.6%
Carpooled
7.5%
8.8%
Car alone
88.8%
87.4%
Motorcycle
0.1%
0.2%
Taxicab
0.1%
0.2%
Walked
1.2%
0.7%
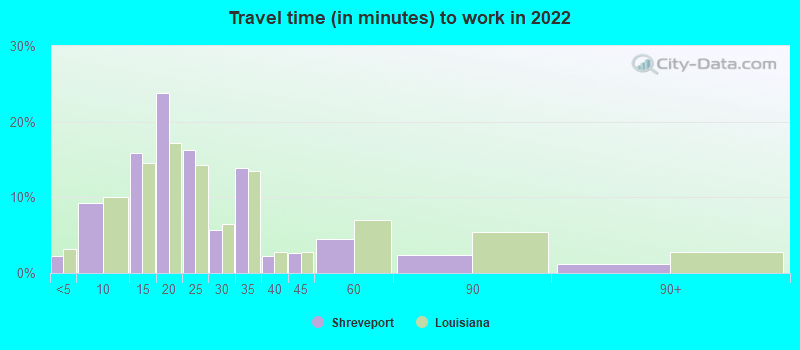
Average travel time to work
Type
Memphis
Shreveport
Average
27 min
26 min
Other means
22.5 min
19.5 min
Public transportation
43.5 min
40 min
Private vehicle occupancy
Type
Memphis
Shreveport
Average
1.1
1.1
Drove alone
89.9%
90.6%
In 2 person carpool
7.9%
7.5%
In 3 person carpool
1.6%
1.4%
In 4 person carpool
0.4%
0.2%
In 5-6 person carpool
0.2%
0.1%
In 7+ person carpool
0.1%
0.3%
How many people usually rode to work in the car, truck or van.
Real Estate
Memphis' real estate market is slightly more expensive than Shreveport's, but it offers a broader range of options. Both cities have seen an upward trend in real estate prices, but properties in both locations remain affordable compared to national averages.
Neighborhoods
Each city offers a variety of living options, from historic to modern neighborhoods. Memphis' suburbs and midtown neighborhoods are highly coveted, while Shreveport's Broadmoor and South Highlands neighborhoods stand out for their charm and community spirit.
Houses and residents
Type
Memphis
Shreveport
Houses
288,491
90,211
Average household size (people)
2.5
2.4
Median year apartment built
1972
1975
Median year house/condo built
1967
1972
Length of stay in the house since moving in
16.2 years
14.7 years
Houses occupied
256,968 (89.1%)
76,167 (84.4%)
Houses occupied by owners
119,622 (46.6%)
40,664 (53.4%)
Houses occupied by renters
137,346 (53.4%)
35,503 (46.6%)
Median rent asked for vacant for-rent units
$760.83
$994.20
Median monthly housing costs
$967
$853
Median price asked for vacant for-sale houses and condos
$201,932
$46,043
Estimated median house or condo value
$142,800
$161,500
Median numbers of rooms
5.5
5.2
Median number of rooms in apartments
4.8
4.3
Median number of rooms in houses and condos
6.6
6.3
Median house price - detached houses
$205,904
$227,450
Median house price - in 2-unit structures
Over $1,000,000
$194,383
Median house price - in 3-to-4-unit structures
$145,165
$53,983
Median house price - in 5 or more unit structures
$201,411
$113,344
Median house price - mobile homes
$93,577
$70,748
Median house price - Townhouses or other attached units
$170,154
$167,641
Median house price - All housing units
$204,886
$222,391
Median house age
52
49
Renting percentage
48.1%
44.5%
Housing density (houses/condos per square mile)
1,032.8
874.6
House value disparities
44.1%
41.2%
Household income disparities
48.2%
49.7%
Median household income for houses/condes with a mortgage
$72,611
$74,880
Median household income for apartments without a mortgage
$53,615
$42,467
Housing units without a mortgage
1,461 (2%)
355 (1.5%)
Housing units with both a second mortgage and home equity loan
3,970 (5.4%)
677 (2.9%)
Housing units with a mortgage
71,386 (98%)
22,643 (98.5%)
Housing units with a home equity loan
322 (0.4%)
217 (0.9%)
Housing units with a second mortgage
5,907 (8.1%)
1,247 (5.4%)
House/condo owner moved in on average (years ago)
16
14
House/condo renter moved in on average (years ago)
1
2
Housing units lacking complete kitchen facilities
5.7%
4.1%
Housing units lacking complete plumbing facilities
4.6%
3.1%
Housing units in structures
Housing units in structures
Memphis
Shreveport
One, detached
61.0%
68.7%
One, attached
5.8%
2.7%
Two
2.1%
2.1%
3 or 4
7.4%
5.8%
5 to 9
9.1%
8.7%
10 to 19
5.6%
4.2%
20 to 49
1.8%
2.9%
50 or more
6.2%
2.9%
Mobile homes
0.8%
2.1%
Boats, RVs, vans, etc.
0.1%
0.0%
Median real estate property taxes paid for housing units
Self-employed workers in own not incorporated business
16,111
2,951
State government workers
7,650
5,454
Unpaid family workers
668
126
Industries and Occupations
Memphis is notable for its healthcare, education, and transportation sectors. Shreveport's key sectors include gaming, oil, and healthcare. Memphis attracts professionals in music and healthcare, while Shreveport appeals to those in the gambling, energy, and health sectors.
Both cities have numerous hospitals and clinics, but Memphis stands out with globally recognized healthcare institutions like St. Jude Children's Research Hospital. Healthcare in Shreveport is relatively good, with several hospitals and clinics offering standard and specialized care.
Health (county statistics)
Type
Memphis
Shreveport
General health status score of residents in this county from 1 (poor) to 5 (excellent)
Memphis boasts stronger infrastructure, including an international airport, cargo and shipping services via the Mississippi River, and several interstates. Shreveport has a smaller airport and a port on the Red River, making it a regional logistics hub, albeit smaller than Memphis.
Infrastructure
Type
Memphis
Shreveport
Hospitals
35
45
TV stations
14
12
Arenas or stadiums
2
1
Bank branches located here
160
74
Bank institutions located here
33
18
Main business address for public companies
17
1
Drinking water stations with no reported violations in the past
0
1
Drinking water stations with reported violations in the past
HMDA - Conventional home purchase loans - Applications denied
Year
Memphis
Shreveport
1999
2,195
622
2000
2,406
651
2001
1,775
693
2002
1,444
398
2003
2,116
374
2004
3,266
441
2005
4,730
726
2006
5,833
822
2007
3,559
465
2008
1,174
203
2009
345
105
Culture and Food
Culture is a major draw for both cities. Memphis has a rich musical history, home to Elvis Presley's Graceland, while Shreveport's music scene is also notable, with the renowned Louisiana Hayride. Food-wise, Memphis is famous for its barbeque, and Shreveport offers a blend of southern and Creole cooking.
Sports Teams
Memphis is home to NBA's Memphis Grizzlies and a minor league baseball team, the Memphis Redbirds. Shreveport does not host any professional sports teams but supports local high school and college sports enthusiastically.


 Memphis, TN
 Shreveport, LA