Memphis, TN vs St. Louis, MO - Advanced U.S. city comparison tool

Memphis, TN vs St. Louis, MO

Memphis, Tennessee and St. Louis, Missouri are two vibrant American cities that carry significant history and cultural gravitas. Both cities have their distinct appeal but possess different characteristics that may draw or deter potential residents or tourists. They differ on many fronts such as crime rates, weather patterns, living costs, educational opportunities, work environment, economic performance, infrastructural development, industries, employment opportunities, real estate, neighborhoods, transportation options, taxation system, gastronomic culture, sports culture, geographical landscape, and healthcare system. This detailed comparison between the two cities can guide those planning to relocate or visit these cities on what to expect.
 
 
Distance between Memphis, TN and St. Louis, MO : 243.0 miles

Memphis's population is larger by 114%. Its population has decreased by 21,973 people (3.4%) since 2000. The population of St. Louis has decreased by 54,879 people (15.8%) during that time.

Population
Type Memphis St. Louis
Population 628,127 293,310
Female / male percentage 52.8% / 47.2%
52.8%
47.2%
51.2% / 48.8%
51.2%
48.8%
Racial makeup - percentage
Ethnicity MemphisSt. Louis
Black 63.4% 43.6%
White Non-Hispanic 23.5% 44.7%
Hispanic 8.5% 4.4%
Two or more 2.4% 3.1%
Asian 1.6% 3.4%
Racial makeup - absolute values
Ethnicity MemphisSt. Louis
Black 398,220 128,007
White Non-Hispanic 147,318 131,121
Hispanic 53,666 13,028
Two or more 15,236 9,085
Asian 9,745 10,064
Pacific Islander 513 263
American Indian 509 265

Crime and Safety

Both Memphis and St. Louis have higher crime rates compared to the national average, with St. Louis often ranking among the cities with the highest crime rate. However, this doesn't mean every area in these cities is inherently dangerous. Both cities have specific neighborhoods known for their safety. Downtown Memphis and Central West End in St. Louis are popular among tourists and generally safer.

Crime by year per 100,000 residents
Type City-data.com crime indexRobberies per 100,000Murders per 100,000Rapes per 100,000Assaults per 100,000Burglaries per 100,000Theft per 100,000Auto theft per 100,000Arson per 100,000
Year MemphisSt. LouisMemphisSt. LouisMemphisSt. LouisMemphisSt. LouisMemphisSt. LouisMemphisSt. LouisMemphisSt. LouisMemphisSt. LouisMemphisSt. Louis
2020 897.5 952.6 327.4 416.2 44.4 88.1 63.1 78.4 1,917.1 1,433.5 895.8 855.2 3,982.6 3,895.8 682.4 1,079.3 54.8 73.7
2019 824.5 921.3 374.2 490.8 29.8 64.6 75.6 88.2 1,427.6 1,283.8 1,205.2 1,012.9 4,308.7 4,172.8 623.0 997.6 51.7 56.2
2018 862.2 878.9 469.2 473.2 28.8 60.9 80.3 100.7 1,380.2 1,165.6 1,305.1 970.8 4,436.5 4,045.0 683.5 896.1 44.2 61.3
2017 884.2 960.9 529.7 626.5 28.5 66.1 94.7 93.1 1,357.8 1,296.6 1,464.4 1,011.3 4,235.7 4,155.5 613.7 874.4 55.9 64.8
2016 806.8 912.6 485.7 605.4 30.5 59.8 84.9 91.9 1,225.4 1,156.1 1,395.0 1,017.8 3,751.6 3,940.8 493.4 972.3 59.0 85.5
2015 772.5 908.4 476.5 564.5 21.0 59.3 81.9 82.9 1,164.6 1,110.4 1,562.8 1,325.2 3,661.8 3,998.8 416.0 992.1 45.9 70.3
2014 795.1 857.7 501.6 490.3 21.2 49.9 79.2 87.6 1,141.7 1,050.9 1,750.3 1,321.2 3,790.5 3,912.1 454.3 1,019.2 53.4 59.6
2013 767.7 842.1 476.5 457.4 19.0 37.7 69.6 104.5 1,090.6 994.2 1,800.8 1,351.4 3,852.4 4,222.7 409.8 1,045.3 55.6 56.2
2012 802.9 879.2 514.7 557.9 20.4 35.5 65.1 62.4 1,136.4 1,120.6 1,915.5 1,564.6 3,953.5 4,242.7 452.2 1,094.9 61.9 61.5
2011 775.5 964.5 472.3 663.7 17.9 35.3 62.2 58.7 1,031.4 1,099.1 2,032.4 2,189.1 3,937.2 4,769.8 526.4 1,051.3 48.9 59.6
2010 782.4 1,030.4 500.4 665.5 13.8 45.1 66.9 58.9 1,026.8 1,173.8 2,025.1 2,099.9 3,886.9 5,122.6 608.1 1,335.1 50.7 78.3
2009 865.2 1,052.2 620.1 766.0 19.8 40.3 58.0 70.4 1,110.8 1,193.4 2,090.6 1,923.9 4,361.0 5,010.9 628.8 1,396.9 49.9 72.1
2008 949.7 1,081.5 712.5 739.5 20.5 46.9 54.5 66.5 1,137.9 1,219.8 2,362.8 2,042.1 4,846.7 4,864.6 806.3 1,639.8 28.3 91.2
2007 964.2 1,158.6 727.8 792.9 19.6 39.6 67.2 73.2 1,137.5 1,292.4 2,184.5 2,093.4 4,958.6 5,838.6 927.0 1,804.2 22.0 117.7
2006 1,000.7 1,354.8 780.4 907.2 21.9 37.2 63.7 97.2 1,125.2 1,439.1 2,417.2 2,453.3 4,962.0 6,789.7 989.1 2,492.2 36.1 124.3
2005 806.4 948.0 657.7 856.9 20.3 37.9 59.1 79.8 1,124.0 1,430.9 2,335.7 2,084.7 4,812.6 6,614.4 1,223.3 2,354.3 33.1 141.6
2004 738.6 895.7 578.2 785.3 16.4 33.7 68.7 51.0 883.5 1,205.8 2,244.0 1,879.8 4,942.3 7,039.4 1,127.3 2,659.2 35.7 171.9
2003 775.2 962.6 657.5 818.8 19.3 21.7 68.7 23.8 831.7 1,317.5 2,585.9 2,050.8 4,603.3 7,619.6 1,305.2 3,516.8 43.9 138.1

City-data.com crime index counts serious crimes and violent crime more heavily. It adjusts for the number of visitors and daily workers commuting into cities. (higher means more crime, U.S. average = 301.1)


Crime per year
Type City-data.com crime indexRobberiesMurdersRapesAssaultsBurglariesTheftAuto theftArson
Year MemphisSt. LouisMemphisSt. LouisMemphisSt. LouisMemphisSt. LouisMemphisSt. LouisMemphisSt. LouisMemphisSt. LouisMemphisSt. LouisMemphisSt. Louis
2019 824.5 921.3 2,434 1,475 194 194 492 265 9,285 3,858 7,839 3,044 28,024 12,540 4,052 2,998 336 169
2018 862.2 878.9 3,060 1,452 188 187 524 309 9,002 3,577 8,512 2,979 28,936 12,413 4,458 2,750 288 188
2017 884.2 960.9 3,458 1,944 186 205 618 289 8,863 4,023 9,559 3,138 27,649 12,894 4,006 2,713 365 201
2016 806.8 912.6 3,188 1,904 200 188 557 289 8,044 3,636 9,157 3,201 24,627 12,394 3,239 3,058 387 269
2015 772.5 908.4 3,135 1,790 138 188 539 263 7,662 3,521 10,282 4,202 24,092 12,680 2,737 3,146 302 223
2014 795.1 857.7 3,285 1,562 139 159 519 279 7,477 3,348 11,463 4,209 24,825 12,463 2,975 3,247 350 190
2013 767.7 842.1 3,134 1,457 125 120 458 333 7,173 3,167 11,844 4,305 25,337 13,452 2,695 3,330 366 179
2012 802.9 879.2 3,384 1,778 134 113 428 199 7,471 3,571 12,593 4,986 25,992 13,520 2,973 3,489 407 196
2011 775.5 964.5 3,083 2,127 117 113 406 188 6,732 3,522 13,266 7,015 25,699 15,285 3,436 3,369 319 191
2010 782.4 1,030.4 3,237 2,125 89 144 433 188 6,642 3,748 13,100 6,705 25,144 16,356 3,934 4,263 328 250
2009 865.2 1,052.2 4,139 2,721 132 143 387 250 7,414 4,239 13,953 6,834 29,106 17,799 4,197 4,962 333 256
2008 949.7 1,081.5 4,788 2,634 138 167 366 237 7,647 4,345 15,879 7,274 32,572 17,328 5,419 5,841 190 325
2007 964.2 1,158.6 4,871 2,761 131 138 450 255 7,613 4,500 14,620 7,289 33,186 20,330 6,204 6,282 147 410
2006 1,000.7 1,354.8 5,313 3,147 149 129 434 337 7,661 4,992 16,457 8,510 33,783 23,552 6,734 8,645 246 431
2005 806.4 948.0 4,466 2,965 138 131 401 276 7,632 4,951 15,859 7,213 32,677 22,886 8,306 8,146 225 490
2004 738.6 895.7 3,773 2,632 107 113 448 171 5,765 4,041 14,643 6,300 32,250 23,592 7,356 8,912 233 576
2003 775.2 962.6 4,299 2,786 126 74 449 81 5,438 4,483 16,908 6,978 30,099 25,926 8,534 11,966 287 470

City-data.com crime index counts serious crimes and violent crime more heavily. It adjusts for the number of visitors and daily workers commuting into cities. (higher means more crime, U.S. average = 301.1)

Sex Offenders

According to our data, there are 2,629 registered sex offenders living in Memphis and 2,528 registered sex offenders living in .
The ratio of residents to sex offenders in Memphis is 248 to 1; the ratio in St. Louis is 123 to 1.
The number of registered sex offenders compared to the number of residents is a smaller in Memphis than in St. Louis.

Cost of Living

Living in Memphis is generally more affordable than in St. Louis. Housing costs, utilities, groceries, and healthcare are typically lower in Memphis, making it more appealing for those mindful of their budget when considering relocation.

Income Tax

One significant advantage of living in Memphis is the absence of a state income tax. Missouri residents, including those living in St. Louis, must pay state income tax.

Property Tax

Property taxes are generally lower in Memphis compared to St. Louis, contributing to the affordability of Memphis housing.

Sales Tax

Tennessee has a higher sales tax than Missouri, which might increase the cost of goods in Memphis. However, St. Louis also imposes a 1% earnings tax on residents and out-of-town workers.
Income
Type Memphis St. Louis
Estimated median household income $44,317 $49,965
Estimated per capita income $28,571 $33,810
Cost of living index (U.S. average is 100) 85.5 96.5

If you make $50,000 in Memphis, you will have to make $56,433 in St. Louis to maintain the same standard of living.

Geographical Conditions

Both cities sit along mighty rivers: the Mississippi coursing past Memphis and the Missouri and Mississippi framing St. Louis, providing scenic riverfronts. They are mostly flat but St. Louis has more rolling terrain.
Geographical information
Type Memphis St. Louis
Land area 279.3 sq. miles 61.9 sq. miles
Population density 2,248.8 people per sq. mile 4,736.6 people per sq. mile
Elevation 254 feet 465 feet
Relative area comparison
Memphis, TN St. Louis, MO
First ancestry reported - percentage
Ancestry MemphisSt. Louis
English 2.4% 2.1%
Irish 1.8% 4.5%
German 1.2% 9.0%
Italian 0.7% 2.3%
Scotch-Irish 0.5% 0.3%
Scottish 0.5% 0.6%
French 0.2% 0.6%
Norwegian 0.2% 0.3%
Polish 0.2% 0.8%
Dutch 0.1% 0.2%
Population origin - absolute values
Ancestry MemphisSt. Louis
English 11,171 3,703
Irish 8,107 7,998
German 5,405 15,785
Italian 3,410 4,123
Scotch-Irish 2,266 518
Scottish 2,122 1,008
French 993 1,091
Polish 981 1,423
Norwegian 818 464
Arab 691 48
Welsh 569 120
Dutch 460 420
Russian 453 343
Swedish 391 252
Greek 297 193
French Canadian 264 86
Czech 174 312
Portuguese 122 42
Lithuanian 109 129
Ukrainian 84 100
Foreign born residents - absolute values
Type Count
Region MemphisSt. Louis
All 39,553 20,135
Africa 4,450 3,759
Asia 8,483 8,253
Europe 2,040 3,406
Latin America 23,361 3,959
North America 368 420
Oceania 59 137
Foreign born residents - percentage
Type Percentage
Region MemphisSt. Louis
All 6.3% 6.9%
Africa 0.7% 1.3%
Asia 1.3% 2.8%
Europe 0.3% 1.2%
Latin America 3.7% 1.4%
North America 0.1% 0.1%

Education

Both cities have quality educational institutions, but St. Louis surpasses Memphis by hosting world-renowned universities like Washington University. Memphis, despite having fewer prestigious institutions, boasts unique arts-focused schools.
School enrollment
Type Memphis St. Louis
Nursery, preschool 7,762 (5.3%) 2,927 (4.7%)
Kindergarten 10,594 (7.2%) 2,561 (4.1%)
Grade 1 to 4 30,949 (21%) 10,616 (17.1%)
Grade 5 to 8 34,112 (23.1%) 12,215 (19.7%)
Grade 9 to 12 32,817 (22.2%) 10,792 (17.4%)
College undergrad 23,180 (15.7%) 12,801 (20.6%)
Graduate or professional 8,114 (5.5%) 10,107 (16.3%)
Students in private schools - absolute values
Type Count
Grade MemphisSt. Louis
Grades 1 to 8 (elementary and middle school) 7,665 3,825
Grades 9 to 12 (high school) 3,744 1,109
Undergraduate colleges 6,567 7,586
Students in private schools - percentage
Type Percentage
Grade MemphisSt. Louis
Grades 1 to 8 (elementary and middle school) 11.8% 16.8%
Grades 9 to 12 (high school) 11.4% 10.3%
Undergraduate colleges 28.3% 59.3%
Educational attainment
Type Memphis St. Louis
Less than high school 12.8% 10.8%
High school or equiv. 30% 23.8%
Less than 1 year of college 5% 5.6%
1 or more years of college 17.4% 14.2%
Associate degree 6.5% 6.6%
Bachelor's degree 17.6% 23.4%
Master's degree 7.2% 10.7%
Profess. school degree 2% 3.1%
Doctorate degree 1.5% 1.8%
Education level (25-year-olds and older)
Type Memphis St. Louis
Bachelor's degree or higher 28.3% 38.9%
Graduate or professional degree 10.7% 15.5%
High school or higher 87.2% 89.2%

Work and Economy

St. Louis has a diversified economy with a strong presence in the service, manufacturing, trade, transportation, and tourism sectors, while Memphis is a vital national logistics and transportation hub known for industries like shipping, transportation, and healthcare.

Biggest Employers

In Memphis, FedEx, International Paper, and AutoZone are some of the biggest employers. In St. Louis, BJC HealthCare, Washington University, and Boeing Defense, Space & Security employ thousands.
Employment and residency - absolute values
Kind MemphisSt. Louis
Work and live in this city 231,355 82,480
Work and live in this county 254,954 89,814
Workers who work outside the city they live in 418,745 265,709
Workers who work outside the county they live in 18,159 55,948
Working at home 28,812 28,480
Not working at home 244,301 117,282
Daytime population change due to commuting 102,743 122,234
Employment and residency - percentage
Kind MemphisSt. Louis
Work and live in this city 84.1% 58.6%
Work and live in this county 93.4% 61.6%
Workers who work outside the city they live in 15.9% 41.4%
Workers who work outside the county they live in 6.6% 38.4%
Working at home 10.5% 19.5%
Not working at home 89.5% 80.5%
Daytime population change due to commuting 15.8% 35.1%
Geographical mobility: all
Type all
Mobility MemphisSt. Louis
Same house 1 year ago 86.8% 84.5%
Moved from abroad 0.4% 0.4%
Moved within same county 9.2% 7.0%
Moved from different state 2.3% 4.0%
Moved within same state 1.4% 4.1%
Geographical mobility: Asian
Type Asian
Mobility MemphisSt. Louis
Same house 1 year ago 80.3% 78.5%
Moved from abroad 3.3% 3.4%
Moved within same county 14.6% 5.2%
Moved from different state 4.4% 9.5%
Moved within same state 1.1% 3.4%
Geographical mobility: Black
Type Black
Mobility MemphisSt. Louis
Same house 1 year ago 89.2% 87.4%
Moved from abroad 0.1% 0.2%
Moved within same county 8.7% 8.3%
Moved from different state 1.0% 2.3%
Moved within same state 1.1% 1.8%
Geographical mobility: White
Type White
Mobility MemphisSt. Louis
Same house 1 year ago 85.6% 83.7%
Moved from abroad 0.5% 0.3%
Moved within same county 7.7% 6.3%
Moved from different state 3.8% 4.4%
Moved within same state 2.4% 5.4%

In Memphis (Shelby County), 62.9% voted for Democrats and 36.7% for Republicans in 2012 Presidential Election. In St. Louis (St. Louis city), 82.4% voted for Democrats and 15.9% for Republicans.

Elections
Type DemocratsRepublicansOther
Year MemphisSt. LouisMemphisSt. LouisMemphisSt. Louis
2020 64.8% 82.4% 34.2% 16.1% 1.1% 1.6%
2016 62.3% 79.0% 34.7% 15.8% 3.1% 5.2%
2012 62.9% 82.4% 36.7% 15.9% 0.4% 1.6%
2008 63.8% 83.8% 36.2% 15.5% 0.0% 0.7%
2004 57.7% 80.4% 42.0% 19.2% 0.3% 0.3%
2000 56.8% 77.5% 42.3% 19.9% 0.9% 2.6%
1996 78.9% 74.8% 19.6% 18.1% 1.5% 7.1%
Breakdown of population affiliated with a religious congregation
Type AdherentsCongregations
Religion MemphisSt. LouisMemphisSt. Louis
SOUTHERN BAPTIST CONVENTION 14.8% 2.5% 15.1% 9.0%
CATHOLIC CHURCH 6.5% 15.4% 2.7% 9.5%
EVANGELICAL PRESBYTERIAN CHURCH 1.5% 0.0% 0.7% 0.2%
EPISCOPAL CHURCH 0.8% 0.5% 1.8% 1.5%
MUSLIM ESTIMATE 0.5% 1.1% 0.8% 2.4%
LUTHERAN CHURCH 0.4% 2.2% 1.0% 6.1%
PRESBYTERIAN CHURCH IN AMERICA 0.4% 0.2% 0.6% 1.0%
SEVENTH DAY ADVENTIST CHURCH 0.4% 0.3% 0.9% 0.5%
AMERICAN BAPTIST CHURCHES IN THE USA 0.3% 1.8% 0.6% 2.4%

Weather

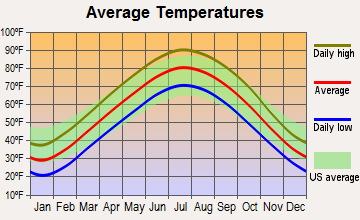
Memphis experiences a typical humid subtropical climate with hot, humid summers and mild to chilly winters. St. Louis has a similar climate, but experiences a wider range of temperatures, with hotter summers and colder winters.
Weather and climate
Type Memphis St. Louis
Temperature - Average 61.9°F 56.5°F
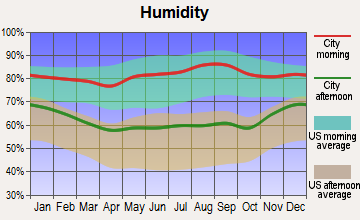
Humidity - Average morning or afternoon humidity 74% 74.8%
Humidity - Differences between morning and afternoon humidity 33% 32%
Humidity - Maximum monthly morning or afternoon humidity 85% 85%
Humidity - Minimum monthly morning or afternoon humidity 52% 53%
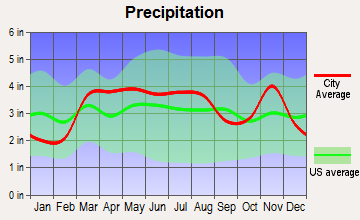
Precipitation - Yearly average 54.3 in 39 in
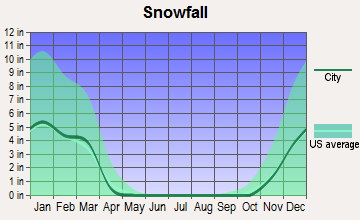
Snowfall - Yearly average 8.6 in 37.2 in
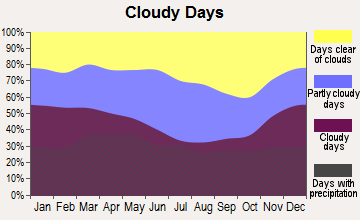
Clouds - Number of days clear of clouds 19.7% 16.7%
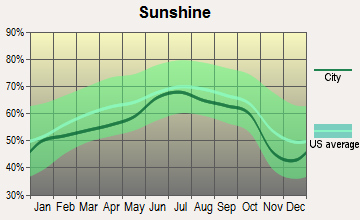
Sunshine amount - Average 68.7% 62.2%
Sunshine amount - Differences during a year 24% 30%
Sunshine amount - Maximum monthly 74% 71%
Sunshine amount - Minimum monthly 50% 41%
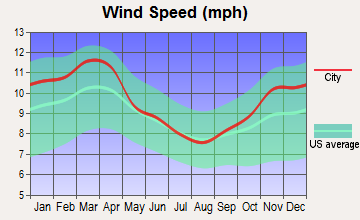
Wind speed - Average 8.8 mph 9.8 mph

Average climate in Memphis, Tennessee

Chicago, Illinois average temperatures Chicago, Illinois average precipitation Chicago, Illinois humidity Chicago, Illinois wind speed Chicago, Illinois snowfall Chicago, Illinois sunshine Chicago, Illinois clear and cloudy days
 

Average climate in St. Louis, Missouri

Chicago, Illinois average temperatures Chicago, Illinois average precipitation Chicago, Illinois humidity Chicago, Illinois wind speed Chicago, Illinois snowfall Chicago, Illinois sunshine Chicago, Illinois clear and cloudy days
 

Air pollution
Type AQICONO2OZONEPBPM10PM25SO2
Year MemphisSt. LouisMemphisSt. LouisMemphisSt. LouisMemphisSt. LouisSt. Louis MemphisSt. LouisMemphisSt. LouisMemphisSt. Louis
2018 81 101 0.24 0.26 10.4 10.7 27.1 27.5 N/A N/A 19.0 19.7 8.1 9.8 0.4 0.8
2017 74 90 0.24 0.25 10.2 10.4 28.1 28.5 N/A N/A 17.5 16.2 7.9 8.0 0.3 1.4
2016 76 96 0.24 0.29 10.2 11.1 28.8 25.8 N/A N/A 19.6 15.5 8.5 8.5 0.9 1.2
2015 77 97 0.26 0.28 11.1 11.8 26.9 22.2 N/A N/A N/A 16.6 9.2 10.5 1.0 1.6
2014 75 97 0.27 0.27 10.1 12.2 26.5 25.5 N/A N/A N/A 17.8 9.9 10.5 1.3 1.8
2013 74 92 0.31 0.27 8.3 12.2 26.6 26.2 N/A N/A N/A 16.3 10.2 10.6 1.0 2.1
2012 94 114 0.32 0.27 9.3 14.4 29.7 27.9 N/A N/A N/A 17.5 10.7 10.2 0.6 2.3
2011 93 107 0.34 0.27 10.0 13.2 29.0 27.0 N/A N/A N/A 17.3 11.1 12.4 0.5 2.7
2010 95 110 0.43 0.31 10.3 12.8 27.9 23.1 N/A N/A N/A 16.2 12.9 12.9 N/A 3.3
2009 86 101 0.35 0.31 8.7 12.5 24.9 22.2 0.039 N/A N/A 21.6 11.8 12.4 N/A 2.8
2008 94 98 0.36 0.32 10.3 12.9 26.3 22.9 0.054 N/A N/A 32.4 13.2 12.8 N/A 2.6
2007 106 125 0.47 0.37 11.2 14.1 26.7 24.3 0.055 N/A N/A 38.8 14.8 14.6 5.6 2.9
2006 108 109 0.43 0.38 13.0 15.2 26.8 23.3 0.044 N/A N/A 38.2 14.7 14.7 6.3 3.1
2005 110 110 0.46 0.39 10.1 16.3 26.9 24.4 0.056 N/A N/A 41.4 17.9 N/A 4.9 4.1
2004 98 92 0.51 0.49 N/A 20.0 24.9 19.6 0.013 N/A N/A 38.3 14.5 N/A 5.9 3.7
2003 110 106 0.57 0.49 20.1 19.6 25.3 21.7 0.044 N/A N/A 37.8 15.0 N/A 5.8 3.7
2002 110 117 0.58 0.56 20.4 21.7 25.1 21.1 0.022 N/A 15.6 45.4 N/A N/A 4.5 4.4
2001 111 100 0.66 0.57 24.7 22.4 26.0 20.4 0.057 N/A 22.7 46.6 N/A N/A 6.1 5.0
2000 103 98 0.63 0.78 25.2 23.8 26.2 20.6 0.057 N/A 24.9 N/A N/A N/A 6.4 5.5
Natural disasters
Type Memphis St. Louis
Tornado activity compared to U.S. average 198.6% 182.4%
Earthquake activity compared to U.S. average 474% 413.3%
Natural disasters compared to U.S. average 18% 0%

Transportation

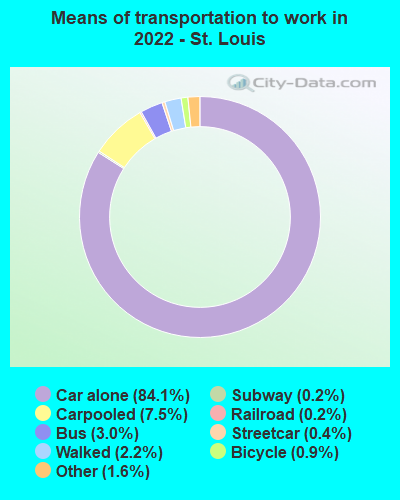
St. Louis provides more efficient public transportation, including extensive bus and light rail systems. Memphis, on the other hand, is more car-dependent, albeit it does offer bus service and a trolley system downtown.
Transport
Type Memphis St. Louis
Amtrak stations 1 1
Amtrak stations nearby 1 2
FAA registered aircraft 1 0
FAA registered aircraft manufacturers and dealers 52 0
Means of transportation to work
Type Memphis St. Louis
Bicycle 0% 0.5%
Bus 0.4% 3.7%
Carpooled 7.5% 7.5%
Car alone 88.8% 83.9%
Railroad 0% 0.3%
Streetcar 0% 0.2%
Subway 0% 0.3%
Taxicab 0.1% 0.3%
Walked 1.2% 2.5%
Means of transportation to work
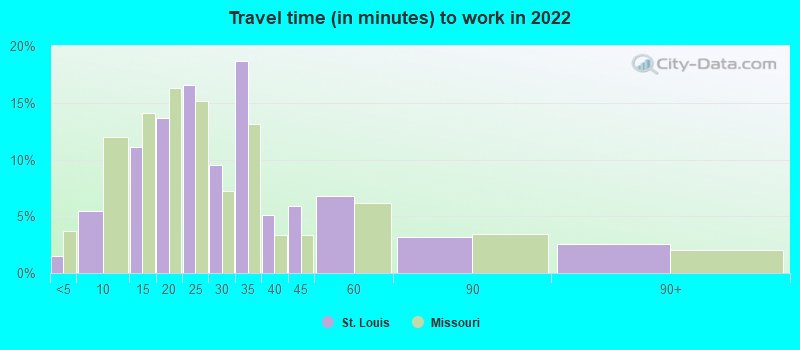
Average travel time to work
Type Memphis St. Louis
Average 27 min 29.4 min
Other means 22.5 min 22.9 min
Public transportation 43.5 min 42.8 min
Travel time to work
Time leaving to work
Travel time to work
Time leaving to work
Private vehicle occupancy
Type Memphis St. Louis
Average 1.1 1.1
Drove alone 89.9% 91.6%
In 2 person carpool 7.9% 6.5%
In 3 person carpool 1.6% 1%
In 4 person carpool 0.4% 0.1%
In 5-6 person carpool 0.2% 0.1%
In 7+ person carpool 0.1% 0.7%

How many people usually rode to work in the car, truck or van.

Real Estate

The real estate market is generally more affordable in Memphis. Homeownership is attainable for many due to the lower average home prices compared to St. Louis.

Neighborhoods

Memphis neighborhoods like Midtown and East Memphis offer a suburban feel, while Downtown offers a bustling urban environment. St. Louis has the lively Central West End, historic Soulard, and family-friendly Richmond Heights.
Houses and residents
Type Memphis St. Louis
Houses 288,491 173,493
Average household size (people) 2.5 2.2
Median year apartment built 1972 1943
Length of stay in the house since moving in 16.2 years 14.2 years
Houses occupied 256,968 (89.1%) 139,736 (80.5%)
Houses occupied by owners 119,622 (46.6%) 63,653 (45.6%)
Houses occupied by renters 137,346 (53.4%) 76,083 (54.4%)
Median rent asked for vacant for-rent units $760.83 $923.98
Median monthly housing costs $967 $883
Median price asked for vacant for-sale houses and condos $201,932 $56,913
Estimated median house or condo value $142,800 $170,800
Median numbers of rooms 5.5 4.8
Median number of rooms in apartments 4.8 4
Median number of rooms in houses and condos 6.6 5.9
Median house price - detached houses $205,904 $196,007
Median house price - in 2-unit structures Over $1,000,000 $166,673
Median house price - in 3-to-4-unit structures $145,165 $155,363
Median house price - in 5 or more unit structures $201,411 $260,843
Median house price - mobile homes $93,577 $35,054
Median house price - Townhouses or other attached units $170,154 $272,667
Median house price - All housing units $204,886 $200,041
Median house age 52 2,021
Renting percentage 48.1% 54.6%
Housing density (houses/condos per square mile) 1,032.8 2,801.7
House value disparities 44.1% 38.7%
Household income disparities 48.2% 48.3%
Median household income for houses/condes with a mortgage $72,611 $87,762
Median household income for apartments without a mortgage $53,615 $55,824
Housing units without a mortgage 1,461 (2%) 1,236 (2.9%)
Housing units with both a second mortgage and home equity loan 3,970 (5.4%) 2,537 (6%)
Housing units with a mortgage 71,386 (98%) 41,018 (97.1%)
Housing units with a home equity loan 322 (0.4%) 188 (0.4%)
Housing units with a second mortgage 5,907 (8.1%) 3,349 (7.9%)
House/condo owner moved in on average (years ago) 16 10
House/condo renter moved in on average (years ago) 1 2
Housing units lacking complete kitchen facilities 5.7% 9.2%
Housing units lacking complete plumbing facilities 4.6% 5.8%
Housing units in structures
Housing units in structures MemphisSt. Louis
One, detached 61.0% 43.2%
One, attached 5.8% 4.1%
Two 2.1% 14.2%
3 or 4 7.4% 13.5%
5 to 9 9.1% 4.9%
10 to 19 5.6% 2.2%
20 to 49 1.8% 3.8%
50 or more 6.2% 13.5%
Mobile homes 0.8% 0.5%
Boats, RVs, vans, etc. 0.1% 0.0%
Median real estate property taxes paid for housing units
Type Memphis St. Louis
With mortgages $1,901 (1.2%) $1,949 (1%)
With no mortgages $1,323 (1.3%) $1,464 (1%)
Marital status
Type Memphis St. Louis
Divorced 10.4% 11.6%
Never married 46.6% 49.8%
Now married 33.6% 30.4%
Separated 3.7% 2.6%
Widowed 5.7% 5.6%
Class of workers - percentage
Class of Workers MemphisSt. Louis
Employee of private company 71.6% 66.0%
Private not-for-profit wage and salary workers 7.7% 14.4%
Local government workers 6.7% 6.1%
Self-employed workers in own not incorporated business 5.8% 5.5%
Federal government workers 3.0% 2.8%
State government workers 2.7% 2.0%
Self-employed in own incorporated business 2.2% 3.0%
Unpaid family workers 0.2% 0.2%
Class of workers - absolute values
Class of Workers MemphisSt. Louis
Employee of private company 199,884 97,680
Federal government workers 8,490 4,154
Local government workers 18,783 8,977
Private not-for-profit wage and salary workers 21,462 21,336
Self-employed in own incorporated business 6,255 4,402
Self-employed workers in own not incorporated business 16,111 8,126
State government workers 7,650 2,962
Unpaid family workers 668 315

Industries and Occupations

Both cities offer numerous employment opportunities but differ in focus. Memphis is driven by transportation, logistics, healthcare, and professional services while St. Louis excels in healthcare, education, and financial services.
Most common male industries
Industry MemphisSt. Louis
Transportation and warehousing 17.9% 8.5%
Manufacturing 12.4% 11.3%
Construction 10.1% 5.4%
Retail trade 9.8% 7.6%
Health care and social assistance 7.9% 6.9%
Administrative and support and waste management services 7.4% 7.1%
Accommodation and food services 6.2% 9.1%
Other services, except public administration 4.7% 4.5%
Professional, scientific, and technical services 4.4% 9.3%
Educational services 4.2% 8.6%
Wholesale trade 3.6% 2.8%
Public administration 3.1% 4.2%
Finance and insurance 2.6% 5.9%
Real estate and rental and leasing 1.7% 1.1%
Arts, entertainment, and recreation 1.6% 3.9%
Information 1.0% 1.8%
Utilities 0.7% 1.7%
Agriculture, forestry, fishing and hunting 0.5% 0.1%
Management of companies and enterprises 0.2% 0.1%
Most common female industries
Industry MemphisSt. Louis
Health care and social assistance 20.7% 23.1%
Retail trade 11.4% 10.5%
Transportation and warehousing 10.4% 3.1%
Educational services 9.6% 14.7%
Accommodation and food services 9.2% 6.4%
Manufacturing 6.3% 5.4%
Administrative and support and waste management services 6.0% 3.5%
Other services, except public administration 5.8% 6.4%
Public administration 5.3% 3.9%
Professional, scientific, and technical services 4.7% 7.7%
Finance and insurance 3.2% 6.0%
Real estate and rental and leasing 2.3% 1.6%
Arts, entertainment, and recreation 1.2% 3.0%
Wholesale trade 1.2% 0.6%
Information 1.1% 1.6%
Construction 0.8% 1.1%
Utilities 0.3% 0.2%
Agriculture, forestry, fishing and hunting 0.2% 1.0%
Mining, quarrying, and oil and gas extraction 0.1% 0.1%
Management of companies and enterprises 0.0% 0.3%
Most common male occupations
Occupation MemphisSt. Louis
Material moving occupations 14.9% 5.6%
Sales and related occupations 8.5% 7.6%
Construction and extraction occupations 8.4% 5.4%
Management occupations 8.4% 10.7%
Office and administrative support occupations 8.1% 7.7%
Production occupations 6.7% 6.1%
Transportation occupations 6.3% 6.3%
Building and grounds cleaning and maintenance occupations 5.3% 5.1%
Installation, maintenance, and repair occupations 4.3% 3.3%
Food preparation and serving related occupations 3.7% 6.0%
Business and financial operations occupations 3.3% 6.5%
Computer and mathematical occupations 3.3% 6.0%
Firefighting and prevention, and other protective service workers including supervisors 2.2% 2.2%
Health diagnosing and treating practitioners and other technical occupations 2.2% 2.6%
Personal care and service occupations 2.1% 2.3%
Educational instruction, and library occupations 1.9% 5.3%
Architecture and engineering occupations 1.4% 2.0%
Health technologists and technicians 1.4% 0.4%
Arts, design, entertainment, sports, and media occupations 1.4% 3.4%
Law enforcement workers including supervisors 1.3% 0.8%
Most common female occupations
Occupation MemphisSt. Louis
Office and administrative support occupations 17.8% 12.7%
Sales and related occupations 9.8% 6.2%
Management occupations 8.4% 11.2%
Educational instruction, and library occupations 7.9% 11.1%
Material moving occupations 7.5% 2.0%
Food preparation and serving related occupations 6.2% 3.9%
Health diagnosing and treating practitioners and other technical occupations 6.1% 7.4%
Business and financial operations occupations 5.2% 6.0%
Healthcare support occupations 5.0% 8.6%
Production occupations 4.6% 3.7%
Health technologists and technicians 3.5% 2.9%
Personal care and service occupations 3.5% 4.6%
Building and grounds cleaning and maintenance occupations 3.2% 2.9%
Community and social service occupations 2.7% 3.0%
Transportation occupations 1.6% 0.9%
Firefighting and prevention, and other protective service workers including supervisors 1.2% 0.9%
Life, physical, and social science occupations 1.1% 1.6%
Legal occupations 1.0% 1.3%
Arts, design, entertainment, sports, and media occupations 0.9% 4.6%
Computer and mathematical occupations 0.7% 2.4%
Food environment data per 10,000 residents
Food environment statistics MemphisSt. Louis
Number of convenience stores (no gas) 4.3 2.5
Number of convenience stores (with gas) 0.5 1.2
Number of full-service restaurants 6.1 8.9
Number of grocery stores 2.1 2.8
Number of supercenters and club stores 0.1 0.0
Food environment - absolute values
Food environment statistics MemphisSt. Louis
Number of convenience stores (no gas) 386 88
Number of convenience stores (with gas) 49 42
Number of full-service restaurants 556 318
Number of grocery stores 186 98
Number of supercenters and club stores 13 0
Obesity and diabetes
Food environment statistics rate MemphisSt. Louis
Adult diabetes rate 11.3% 10.6%
Adult obesity rate 32.8% 31.9%
Low-income preschool obesity rate 9.2% 13.3%

Health Care

St. Louis boasts a robust healthcare infrastructure, with many top-ranked hospitals. Memphis doesn’t fall behind with facilitites such as the Baptist Memorial Hospital and St. Jude Children's Research Hospital.
Health (county statistics)
Type Memphis St. Louis
General health status score of residents in this county from 1 (poor) to 5 (excellent) 3.2 3.4
Average weight of females (lbs) 171 lbs 167.4 lbs
Average weight of males (lbs) 202.5 lbs 200 lbs
Residents visited a dentist within the past year 60.4% 67.3%
Residents exercised in the past month 64.6% 71.9%
Adult residents drank alcohol in the past 30 days 42.2% 53.7%
Residents smoked 100+ cigarettes in their lives 41.4% 45.2%

Fatal vehicle accidents per 100,000 residents
Type Total count per 100,000Drunk per 100,000Fatal count per 100,000Pedestrian count per 100,000Person count per 100,000Vehicle count per 100,000
Year MemphisSt. LouisMemphisSt. LouisMemphisSt. LouisMemphisSt. LouisMemphisSt. LouisMemphisSt. Louis
2021 34.2 21.8 0.0 0.0 38.1 24.2 10.8 8.2 81.2 44.3 61.8 36.1
2020 32.9 25.3 6.8 8.0 35.3 27.0 11.6 7.3 75.2 66.2 54.5 42.6
2019 19.0 18.9 2.5 6.6 20.0 19.9 5.8 5.7 44.4 49.9 31.2 36.9
2018 16.9 16.1 1.1 2.3 18.0 17.1 5.7 4.3 39.6 53.7 27.2 32.9
2017 14.9 16.5 2.1 3.6 15.4 18.2 6.1 5.2 29.2 46.0 23.3 28.2
2016 17.8 18.5 3.2 6.4 18.2 19.8 4.7 6.4 42.0 47.0 30.2 31.6
2015 14.5 14.5 3.5 3.8 15.6 15.8 5.0 7.6 33.9 32.6 24.0 21.8
2014 13.1 10.1 1.1 3.8 13.5 11.7 3.7 2.2 31.4 25.2 21.6 16.7
2013 13.2 12.9 1.7 4.4 13.9 13.8 4.1 3.8 29.1 34.2 21.3 23.2
2012 10.7 10.7 2.0 2.5 11.9 11.9 2.0 4.4 27.3 26.1 17.1 16.7
2011 11.0 12.6 1.1 5.7 11.3 14.5 2.9 3.8 28.1 27.4 18.3 17.9
2010 11.0 13.2 2.6 4.7 11.4 13.8 2.2 3.8 27.1 26.0 16.4 21.6
2009 12.4 10.7 1.6 3.9 13.9 10.9 2.8 3.6 34.3 32.3 21.0 16.5
2008 13.6 10.7 2.1 4.5 14.9 12.6 2.7 4.2 33.3 28.6 22.3 16.8
2007 14.1 14.1 2.2 7.3 15.2 16.0 1.6 4.5 39.7 42.5 24.1 25.6
2006 14.4 12.2 1.6 5.9 15.8 13.3 3.2 2.5 40.6 33.1 23.0 22.3
2005 14.4 14.2 1.2 6.0 15.7 15.3 2.9 3.7 39.1 37.4 24.5 24.1
2004 11.7 12.3 1.6 4.8 13.1 13.4 3.5 4.0 34.9 35.4 20.1 20.5
2003 11.7 13.2 0.4 4.6 13.2 14.9 4.0 4.0 32.9 42.5 18.7 21.8
2002 11.8 13.7 4.7 6.3 13.7 15.1 3.1 4.3 32.0 34.5 18.3 20.2
2001 10.6 12.0 1.0 4.6 12.1 14.3 3.8 4.3 34.1 34.3 18.1 18.6
2000 12.0 11.2 4.8 5.5 13.1 12.1 3.1 4.9 33.2 31.9 19.4 16.4
1999 14.4 12.6 3.3 4.2 16.5 13.2 3.5 5.1 38.8 36.5 21.8 18.3
1998 16.9 12.7 5.9 5.0 17.9 14.5 4.1 3.5 43.6 35.7 24.3 19.8
1997 18.3 12.5 5.6 4.6 19.9 13.9 5.6 4.9 56.7 38.6 30.7 17.1
1996 18.2 12.5 4.9 3.7 20.1 14.0 3.9 3.7 54.7 33.9 31.5 18.8
1995 16.9 13.9 4.2 3.3 18.4 15.0 4.7 5.3 49.2 36.5 29.2 22.5
1994 19.7 15.8 6.0 6.5 21.9 16.6 4.8 5.7 57.7 45.1 29.5 24.2
1993 14.2 10.4 3.5 4.8 15.2 10.9 3.4 4.8 39.2 29.0 22.4 16.2
1992 15.6 9.9 6.1 4.9 17.7 10.4 3.2 3.1 43.7 21.6 25.1 14.3
1991 15.2 11.2 5.3 4.3 15.6 11.5 7.3 3.3 40.8 32.2 22.1 17.4
1990 15.7 12.4 4.7 3.8 17.0 12.4 0.0 0.0 42.8 29.1 23.7 17.5
1989 12.5 11.9 5.4 4.0 14.2 12.7 0.0 0.0 34.4 25.4 19.7 17.2
1988 14.6 9.8 3.9 3.2 16.5 10.1 0.0 0.0 42.1 27.0 23.6 17.9
1987 13.5 8.7 4.2 2.9 14.7 9.7 0.0 0.0 32.8 21.8 20.9 13.3
1986 16.0 11.2 7.5 4.3 17.0 12.6 0.0 0.0 39.1 28.6 24.8 16.0
1985 15.3 12.0 5.9 3.1 16.1 12.7 0.0 0.0 35.3 29.0 22.0 17.4
1984 12.2 9.5 6.0 2.6 12.5 10.7 0.0 0.0 30.5 24.9 18.0 15.3
1983 14.8 9.4 8.2 3.9 16.2 10.3 0.0 0.0 36.8 25.7 21.9 13.8
1982 11.9 9.7 7.7 2.5 13.1 10.9 0.0 0.0 29.3 26.0 17.8 13.1
1981 11.2 10.3 5.4 1.3 12.1 11.6 0.0 0.0 25.1 24.4 16.0 14.1
1980 16.6 13.7 9.1 5.5 18.1 14.4 0.0 0.0 41.9 32.2 25.2 19.0
1979 16.0 12.3 7.1 2.8 16.9 12.8 0.0 0.0 40.8 28.3 25.3 16.6
1978 14.5 12.1 5.6 1.4 15.7 12.7 0.0 0.0 31.5 30.2 18.4 14.6
1977 17.5 14.3 6.9 4.4 19.4 16.7 0.0 0.0 46.0 33.4 25.8 18.1
1976 13.0 9.8 4.7 1.7 15.1 10.8 0.0 0.0 32.8 25.2 18.0 13.4
1975 13.1 9.5 4.7 1.7 15.1 10.4 0.0 0.0 32.9 24.4 18.1 13.0

Fatal vehicle accidents
Type Total countDrunkFatal countPedestrian countPerson countVehicle count
Year MemphisSt. LouisMemphisSt. LouisMemphisSt. LouisMemphisSt. LouisMemphisSt. LouisMemphisSt. Louis
1975 83 51 30 9 96 56 0 0 209 131 115 70
1976 83 51 30 9 96 56 0 0 209 131 115 70
1977 112 72 44 22 124 84 0 0 294 168 165 91
1978 93 59 36 7 101 62 0 0 202 147 118 71
1979 103 58 46 13 109 60 0 0 263 133 163 78
1980 107 62 59 25 117 65 0 0 271 146 163 86
1981 72 46 35 6 78 52 0 0 161 109 103 63
1982 76 43 49 11 84 48 0 0 187 115 114 58
1983 94 41 52 17 103 45 0 0 234 112 139 60
1984 77 41 38 11 79 46 0 0 193 107 114 66
1985 96 51 37 13 101 54 0 0 222 123 138 74
1986 100 47 47 18 106 53 0 0 244 120 155 67
1987 84 36 26 12 91 40 0 0 204 90 130 55
1988 90 40 24 13 102 41 0 0 260 110 146 73
1989 77 48 33 16 87 51 0 0 211 102 121 69
1990 97 49 29 15 105 49 0 0 265 115 147 69
1991 94 44 33 17 97 45 45 13 253 126 137 68
1992 97 38 38 19 110 40 20 12 271 83 156 55
1993 88 39 22 18 94 41 21 18 243 109 139 61
1994 122 58 37 24 136 61 30 21 358 166 183 89
1995 105 50 26 12 114 54 29 19 305 131 181 81
1996 112 44 30 13 124 49 24 13 337 119 194 66
1997 112 43 34 16 122 48 34 17 347 133 188 59
1998 103 43 36 17 109 49 25 12 266 121 148 67
1999 87 42 20 14 100 44 21 17 235 122 132 61
2000 78 39 31 19 85 42 20 17 216 111 126 57
2001 73 42 7 16 83 50 26 15 234 120 124 65
2002 81 48 32 22 94 53 21 15 219 121 125 71
2003 80 46 3 16 90 52 27 14 225 148 128 76
2004 80 43 11 17 89 47 24 14 238 124 137 72
2005 98 50 8 21 107 54 20 13 266 132 167 85
2006 98 43 11 21 108 47 22 9 277 117 157 79
2007 96 50 15 26 103 57 11 16 270 151 164 91
2008 92 38 14 16 101 45 18 15 225 102 151 60
2009 84 38 11 14 94 39 19 13 232 115 142 59
2010 71 42 17 15 74 44 14 12 175 83 106 69
2011 72 40 7 18 74 46 19 12 183 87 119 57
2012 70 34 13 8 78 38 13 14 179 83 112 53
2013 86 41 11 14 91 44 27 12 190 109 139 74
2014 86 32 7 12 89 37 24 7 206 80 142 53
2015 95 46 23 12 102 50 33 24 222 103 157 69
2016 116 58 21 20 119 62 31 20 274 147 197 99
2017 97 51 14 11 100 56 40 16 190 142 152 87
2018 110 49 7 7 117 52 37 13 258 163 177 100
2019 124 57 16 20 130 60 38 17 289 150 203 111
2020 208 76 43 24 223 81 73 22 475 199 344 128
2021 215 64 0 0 239 71 68 24 510 130 388 106
Police full-time law enforcement employees
Year MemphisSt. Louis
2021 2,446 1,537
2020 2,563 1,659
2019 2,635 1,609
2018 2,605 1,608
2017 2,501 1,624
2016 2,385 1,632
2015 2,389 1,757
2014 2,572 1,946
2013 2,694 1,842
2012 2,826 1,866
2011 2,855 1,920
2010 2,775 1,920
2009 2,724 1,923
2008 2,523 1,997
2007 2,529 1,967
2006 2,440 1,936
2005 2,657 1,909
2004 2,891 1,905
2003 2,668 2,047
Police full-time law enforcement employees (per 1,000 residents)
Year MemphisSt. Louis
2021 3.8 5.2
2020 3.9 5.6
2019 4.1 5.4
2018 4.0 5.2
2017 3.8 5.2
2016 3.6 5.2
2015 3.6 5.5
2014 3.9 6.1
2013 4.1 5.8
2012 4.3 5.9
2011 4.4 6.0
2010 4.3 6.0
2009 4.1 5.4
2008 3.8 5.6
2007 3.8 5.6
2006 3.6 5.6
2005 3.9 5.5
2004 4.4 5.7
2003 4.1 6.0
Place of birth - Foreign born
Residents MemphisSt. Louis
All residents 6.7% 6.2%
American Indian / Alaska Native residents 37.7% 24.7%
Asian residents 65.3% 68.5%
Black or African American residents 1.5% 2.2%
Native Hawaiian / Pacific Islander residents 20.4% 10.2%
Other race residents 44.5% 28.0%
Two or more races residents 21.3% 11.4%
White residents 3.4% 3.3%
White alone, not Hispanic / Latino residents 2.7% 4.0%
Place of birth - Native, outside of US
Residents MemphisSt. Louis
All residents 0.6% 0.6%
Asian residents 2.5% 0.5%
Black or African American residents 0.4% 0.3%
Native Hawaiian / Pacific Islander residents 14.6% 0.0%
Other race residents 0.9% 0.5%
Two or more races residents 1.7% 2.5%
White residents 0.7% 0.8%
White alone, not Hispanic / Latino residents 0.8% 0.8%
Place of birth - Born in state of residence
Residents MemphisSt. Louis
All residents 65.2% 67.7%
American Indian / Alaska Native residents 40.1% 38.4%
Asian residents 15.7% 13.5%
Black or African American residents 74.8% 81.8%
Native Hawaiian / Pacific Islander residents 24.9% 23.0%
Other race residents 43.1% 50.0%
Two or more races residents 49.0% 59.1%
White residents 52.6% 61.2%
White alone, not Hispanic / Latino residents 54.4% 59.6%
Place of birth - Born in other state
Residents MemphisSt. Louis
All residents 27.6% 25.5%
American Indian / Alaska Native residents 22.2% 36.9%
Asian residents 16.5% 17.5%
Black or African American residents 23.3% 15.8%
Native Hawaiian / Pacific Islander residents 40.0% 66.8%
Other race residents 11.5% 21.4%
Two or more races residents 27.9% 27.0%
White residents 43.3% 34.7%
White alone, not Hispanic / Latino residents 42.0% 35.6%
English speakers (speaking English at home)
Type Memphis St. Louis
Born in the United States residents 95.8% 94.5%
Foreign born residents 15.4% 18%
Native, born elsewhere residents 69.1% 63.6%
Total residents 90.5% 90.5%
Mechanisms of homicide
Mechanism MemphisSt. Louis
Homicides from 2000 to 2006 1,090 676
Cut / Pierce 103 67
Firearm 816 524
Suffocation 26 0
Mechanisms of homicide per 1,000,000 residents
Mechanism MemphisSt. Louis
Homicides from 2000 to 2006 171.8 275.4
Cut / Pierce 16.2 27.3
Firearm 128.6 213.5
Suffocation 4.1 0
Mechanisms of suicide per 1,000,000 residents
Mechanism MemphisSt. Louis
Suicides from 2000 to 2006 99.3 127.5
Firearm 65.2 60.3
Poisoning 13.7 26.5
Suffocation 13.7 30.6

Infrastructure

St. Louis features a blend of historic and modern architecture while Memphis has prioritized redevelopment in recent years. Both have ample parks and leisure facilities, but St. Louis edges out slightly in terms of infrastructural development.
Infrastructure
Type Memphis St. Louis
Hospitals 35 1
TV stations 14 19
Arenas or stadiums 2 4
Bank branches located here 160 30
Bank institutions located here 33 12
Main business address for public companies 17 7

Schools

School facilities
Type Memphis St. Louis
Private elementary/middle schools 30 0
Private high schools 24 0
Public elementary/middle schools 168 136
Public high schools 59 44
Colleges/Universities 31 6
HMDA - Conventional home purchase loans - Applications denied
Year MemphisSt. Louis
1999 2,195 0
2000 2,406 0
2001 1,775 0
2002 1,444 0
2003 2,116 1,583
2004 3,266 2,101
2005 4,730 2,853
2006 5,833 3,391
2007 3,559 2,022
2008 1,174 841
2009 345 247

Culture and Food

Both cities have a rich cultural and culinary scene. Memphis is famous for its music (particularly blues) and barbecue, while St. Louis is known for its unique cuisines like gooey butter cake, toasted ravioli, and St. Louis-style pizza.

Sports Teams

Both cities are passionate about sports. Memphis has the Grizzlies (NBA) and the Redbirds (AAA Baseball), while St. Louis boasts the Cardinals (MLB), the Blues (NHL), and STL City SC (MLS).