Comparing two diverse cities like Memphis, Tennessee and Tampa, Florida gives great insights about the differences in southern living. Key constituents like crime and safety, weather, cost of living, education, and many other categories shape the standard of living in these locations. This comparison provides a detailed overview for those looking to relocate or visit either city. It covers aspects of culture, food, sports, taxes, and the overall quality of life, helping you make an informed decision.
Distance between
Memphis, TN and
Tampa, FL : 662.2 miles
Memphis's population is larger by 62%. Its population has decreased by 21,973 people (3.4%) since 2000. The population of Tampa has grown by 83,603 people (27.6%) during that time.
Memphis has a higher crime rate compared to Tampa. However, one must remember that crime is concentrated in certain areas and not evenly spread. Avoiding certain neighborhoods can greatly decrease incidences. On the other hand, Tampa has its own fair share of crime, but the overall rate is much lower than in Memphis.
City-data.com crime index counts serious crimes and violent crime more heavily. It adjusts for the number of visitors and daily workers commuting into cities. (higher means more crime, U.S. average = 301.1)
City-data.com crime index counts serious crimes and violent crime more heavily. It adjusts for the number of visitors and daily workers commuting into cities. (higher means more crime, U.S. average = 301.1)
Sex Offenders
According to our data, there are 2,629 registered sex offenders living in Memphis and 1,340 registered sex offenders living in . The ratio of residents to sex offenders in Memphis is 248 to 1; the ratio in Tampa is 281 to 1. The number of registered sex offenders compared to the number of residents in Memphis is near to than in Tampa.
Cost of Living
Living in Memphis is generally less expensive than in Tampa. Lower real estate prices contribute to a lower overall cost of living. However, in Tampa, amenities and opportunities found within larger urban areas may justify the higher cost for some.
Income Tax
Neither Tennessee nor Florida has an income tax, providing residents of both Memphis and Tampa with a financial incentive.
Property Tax
Property taxes in Memphis are usually higher than in Tampa, which is worth considering when thinking about homeownership in either city.
Sales Tax
Both Tennessee and Florida have no state income tax. However, Memphis has a higher sales tax rate compared to Tampa.
Income
Type
Memphis
Tampa
Estimated median household income
$44,317
$63,404
Estimated per capita income
$28,571
$43,517
Cost of living index (U.S. average is 100)
85.5
99.8
If you make $50,000 in Memphis, you will have to make $58,363 in Tampa to maintain the same standard of living.
Geographical Conditions
Memphis is located along the Mississippi River while Tampa is nestled on the Gulf Coast. This offers varying geographical conditions from river scenes in Memphis to beach life in Tampa.
Both cities have an array of educational opportunities, although the presences are different. Memphis is home to a number of secondary and higher education institutions, including the University of Memphis. Meanwhile, Tampa boasts an array of higher learning institutions as well, including the University of South Florida.
Memphis has a robust economy with industries such as transportation, shipping, and music playing significant roles. In contrast, Tampa has a diversified economy with strong sectors in tourism, agriculture, construction, and finance.
Biggest Employers
In Memphis, the largest employers are FedEx and the healthcare sector including Baptists Memorial HealthCare. Alternatively, in Tampa, largest employers include Baycare Health System and Publix Supermarkets.
In Memphis (Shelby County), 62.9% voted for Democrats and 36.7% for Republicans in 2012 Presidential Election. In Tampa (Hillsborough County), 53.0% voted for Democrats and 46.3% for Republicans.
Elections
Type
Democrats
Republicans
Other
Year
Memphis
Tampa
Memphis
Tampa
Memphis
Tampa
2020
64.8%
52.9%
34.2%
46.0%
1.1%
1.1%
2016
62.3%
51.2%
34.7%
44.4%
3.1%
4.5%
2012
62.9%
53.0%
36.7%
46.3%
0.4%
0.6%
2008
63.8%
53.4%
36.2%
46.2%
0.0%
0.4%
2004
57.7%
46.4%
42.0%
53.2%
0.3%
0.4%
2000
56.8%
47.2%
42.3%
50.4%
0.9%
2.4%
1996
78.9%
46.8%
19.6%
44.3%
1.5%
8.9%
Breakdown of population affiliated with a religious congregation
Type
Adherents
Congregations
Religion
Memphis
Tampa
Memphis
Tampa
SOUTHERN BAPTIST CONVENTION
14.8%
8.3%
15.1%
19.4%
CATHOLIC CHURCH
6.5%
10.7%
2.7%
2.8%
EVANGELICAL PRESBYTERIAN CHURCH
1.5%
0.0%
0.7%
0.1%
EPISCOPAL CHURCH
0.8%
0.5%
1.8%
1.4%
MUSLIM ESTIMATE
0.5%
1.7%
0.8%
1.1%
LUTHERAN CHURCH
0.4%
0.3%
1.0%
1.1%
PRESBYTERIAN CHURCH IN AMERICA
0.4%
0.1%
0.6%
0.7%
SEVENTH DAY ADVENTIST CHURCH
0.4%
0.5%
0.9%
2.2%
EVANGELICAL LUTHERAN CHURCH IN AMERICA
0.1%
0.5%
0.4%
1.2%
Weather
Memphis experiences all four seasons, with hot summers and chilly winters. Tampa's weather tends to be more tropical with hot, humid summers and mild winters. Tampa also faces the threat of hurricanes due to its coastal Florida location, while Memphis is positioned in a relatively stable, inland geographical position.
Weather and climate
Type
Memphis
Tampa
Temperature - Average
61.9°F
73.1°F
Humidity - Average morning or afternoon humidity
74%
77.6%
Humidity - Differences between morning and afternoon humidity
33%
38%
Humidity - Maximum monthly morning or afternoon humidity
85%
89%
Humidity - Minimum monthly morning or afternoon humidity
52%
51%
Precipitation - Yearly average
54.3 in
45.6 in
Snowfall - Yearly average
8.6 in
0 in
Clouds - Number of days clear of clouds
19.7%
16.9%
Sunshine amount - Average
68.7%
74.8%
Sunshine amount - Differences during a year
24%
18%
Sunshine amount - Maximum monthly
74%
80%
Sunshine amount - Minimum monthly
50%
62%
Wind speed - Average
8.8 mph
7.4 mph
Average climate in Memphis, Tennessee
Average climate in Tampa, Florida
Air pollution
Type
AQI
CO
NO2
OZONE
PB
PM10
PM25
SO2
Year
Memphis
Tampa
Memphis
Tampa
Memphis
Tampa
Memphis
Tampa
Tampa
Memphis
Tampa
Memphis
Tampa
Memphis
Tampa
2018
81
68
0.24
0.16
10.4
N/A
27.1
27.7
N/A
N/A
19.0
18.9
8.1
7.9
0.4
1.1
2017
74
79
0.24
0.17
10.2
N/A
28.1
28.4
N/A
N/A
17.5
20.5
7.9
8.8
0.3
0.6
2016
76
71
0.24
0.17
10.2
N/A
28.8
30.8
N/A
N/A
19.6
20.2
8.5
7.9
0.9
0.8
2015
77
74
0.26
0.15
11.1
N/A
26.9
28.7
N/A
N/A
N/A
19.0
9.2
10.0
1.0
2.2
2014
75
74
0.27
0.16
10.1
N/A
26.5
28.0
N/A
N/A
N/A
20.0
9.9
8.4
1.3
1.6
2013
74
68
0.31
0.16
8.3
N/A
26.6
27.7
N/A
N/A
N/A
20.3
10.2
9.3
1.0
1.4
2012
94
85
0.32
0.17
9.3
N/A
29.7
28.0
N/A
N/A
N/A
21.0
10.7
9.7
0.6
1.0
2011
93
83
0.34
0.18
10.0
N/A
29.0
29.2
N/A
N/A
N/A
20.8
11.1
10.1
0.5
1.2
2010
95
84
0.43
0.25
10.3
N/A
27.9
29.8
N/A
N/A
N/A
21.8
12.9
9.9
N/A
1.3
2009
86
77
0.35
0.27
8.7
N/A
24.9
27.4
N/A
N/A
N/A
21.2
11.8
10.1
N/A
1.5
2008
94
86
0.36
0.18
10.3
4.0
26.3
27.5
N/A
N/A
N/A
23.3
13.2
10.2
N/A
2.4
2007
106
102
0.47
0.31
11.2
5.4
26.7
28.8
N/A
N/A
N/A
26.0
14.8
12.0
5.6
3.3
2006
108
99
0.43
0.42
13.0
6.9
26.8
29.5
N/A
N/A
N/A
25.8
14.7
11.6
6.3
3.0
2005
110
99
0.46
0.45
10.1
6.7
26.9
27.9
N/A
N/A
N/A
25.0
17.9
13.2
4.9
3.0
2004
98
92
0.51
0.40
N/A
7.2
24.9
26.5
0.004
N/A
N/A
25.0
14.5
12.5
5.9
3.2
2003
110
94
0.57
0.42
20.1
N/A
25.3
23.8
0.004
N/A
N/A
23.9
15.0
11.7
5.8
4.4
2002
110
84
0.58
0.38
20.4
N/A
25.1
24.5
0.006
N/A
15.6
24.2
N/A
11.5
4.5
4.9
2001
111
100
0.66
0.44
24.7
N/A
26.0
26.2
0.012
N/A
22.7
24.9
N/A
12.1
6.1
4.7
2000
103
98
0.63
0.48
25.2
N/A
26.2
29.3
0.020
N/A
24.9
26.3
N/A
N/A
6.4
5.1
Natural disasters
Type
Memphis
Tampa
Tornado activity compared to U.S. average
198.6%
152.6%
Earthquake activity compared to U.S. average
474%
11.1%
Natural disasters compared to U.S. average
18%
25%
Transportation
Both cities have comprehensive public transportation systems. In Memphis, the MATA also runs historic streetcars downtown. Tampa's HART services the city and surrounding county, while a free downtown trolley makes navigating the city center easy.
Transport
Type
Memphis
Tampa
Amtrak stations
1
1
Amtrak stations nearby
1
3
FAA registered aircraft
1
541
FAA registered aircraft manufacturers and dealers
52
78
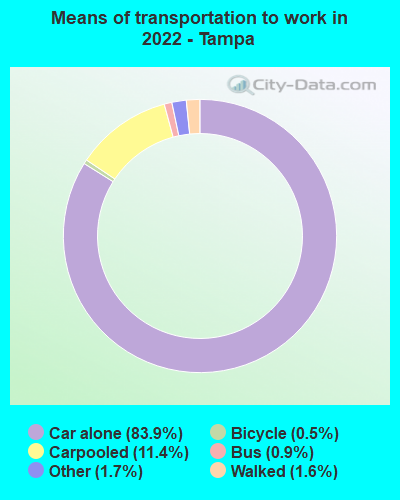
Means of transportation to work
Type
Memphis
Tampa
Bicycle
0%
0.4%
Bus
0.4%
1.1%
Carpooled
7.5%
8.5%
Car alone
88.8%
87%
Motorcycle
0.1%
0.2%
Railroad
0%
0.2%
Taxicab
0.1%
0.1%
Walked
1.2%
1.3%
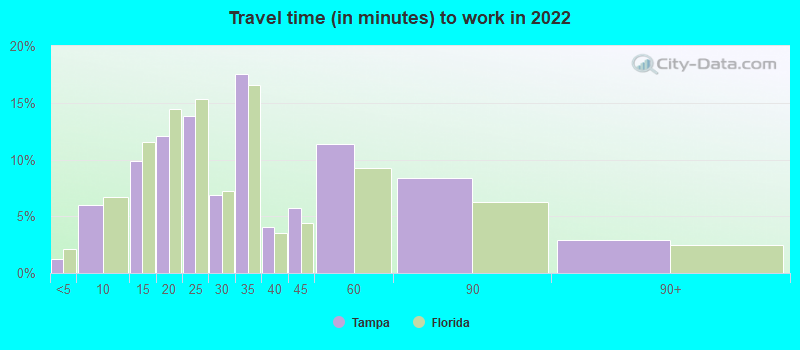
Average travel time to work
Type
Memphis
Tampa
Average
27 min
31.4 min
Other means
22.5 min
23.2 min
Public transportation
43.5 min
45.3 min
Private vehicle occupancy
Type
Memphis
Tampa
Average
1.1
1.1
Drove alone
89.9%
90.8%
In 2 person carpool
7.9%
6.1%
In 3 person carpool
1.6%
1.7%
In 4 person carpool
0.4%
0.8%
In 5-6 person carpool
0.2%
0.4%
How many people usually rode to work in the car, truck or van.
Real Estate
Real estate in Memphis tends to be less expensive compared to Tampa, making homeownership more feasible for many residents. However, the Tampa market offers a larger variety of options, from beachfront properties to urban condos.
Neighborhoods
Distinctive neighborhoods within both cities offer a variety of living experiences. Neighborhoods like Cooper-Young in Memphis and Hyde Park in Tampa offer an urban village environment with easy access to amenities.
Houses and residents
Type
Memphis
Tampa
Houses
288,491
172,886
Average household size (people)
2.5
2.4
Median year apartment built
1972
1988
Median year house/condo built
1967
1977
Length of stay in the house since moving in
16.2 years
12.5 years
Houses occupied
256,968 (89.1%)
159,925 (92.5%)
Houses occupied by owners
119,622 (46.6%)
84,660 (52.9%)
Houses occupied by renters
137,346 (53.4%)
75,265 (47.1%)
Median rent asked for vacant for-rent units
$760.83
$1,369
Median monthly housing costs
$967
$1,326
Median price asked for vacant for-sale houses and condos
$201,932
$380,334
Estimated median house or condo value
$142,800
$336,200
Median numbers of rooms
5.5
4.9
Median number of rooms in apartments
4.8
3.9
Median number of rooms in houses and condos
6.6
6
Median house price - detached houses
$205,904
$477,728
Median house price - in 2-unit structures
Over $1,000,000
$191,392
Median house price - in 3-to-4-unit structures
$145,165
$249,678
Median house price - in 5 or more unit structures
$201,411
$443,026
Median house price - mobile homes
$93,577
$95,765
Median house price - Townhouses or other attached units
$170,154
$499,254
Median house price - All housing units
$204,886
$470,393
Median house age
52
38
Renting percentage
48.1%
48.3%
Housing density (houses/condos per square mile)
1,032.8
1,542.7
House value disparities
44.1%
34.7%
Household income disparities
48.2%
48.9%
Median household income for houses/condes with a mortgage
$72,611
$107,575
Median household income for apartments without a mortgage
$53,615
$66,260
Housing units without a mortgage
1,461 (2%)
1,024 (1.9%)
Housing units with both a second mortgage and home equity loan
3,970 (5.4%)
4,974 (9.2%)
Housing units with a mortgage
71,386 (98%)
53,063 (98.1%)
Housing units with a home equity loan
322 (0.4%)
110 (0.2%)
Housing units with a second mortgage
5,907 (8.1%)
5,716 (10.6%)
House/condo owner moved in on average (years ago)
16
8
House/condo renter moved in on average (years ago)
1
1
Housing units lacking complete kitchen facilities
5.7%
1.2%
Housing units lacking complete plumbing facilities
4.6%
0.9%
Housing units in structures
Housing units in structures
Memphis
Tampa
One, detached
61.0%
54.3%
One, attached
5.8%
7.1%
Two
2.1%
2.0%
3 or 4
7.4%
4.5%
5 to 9
9.1%
4.8%
10 to 19
5.6%
5.5%
20 to 49
1.8%
5.5%
50 or more
6.2%
15.1%
Mobile homes
0.8%
1.0%
Boats, RVs, vans, etc.
0.1%
0.0%
Median real estate property taxes paid for housing units
Self-employed workers in own not incorporated business
16,111
10,160
State government workers
7,650
6,101
Unpaid family workers
668
602
Industries and Occupations
Memphis is known for its music and shipping industries. FedEx, one of the world's largest delivery companies, is headquartered there. In Tampa, the tourism industry reigns due to its beautiful beaches and attractions like Busch Gardens.
Both cities have excellent healthcare systems. Memphis is home to St. Jude Children's Research Hospital, a world leader in pediatric treatment and research. Tampa hosts a number of well-regarded hospitals like Tampa General.
Health (county statistics)
Type
Memphis
Tampa
General health status score of residents in this county from 1 (poor) to 5 (excellent)
Tampa has a younger infrastructure with ongoing growth and development. Memphis, a city with a rich history, has a combination of historic and modern structures, which give it a unique character.
Infrastructure
Type
Memphis
Tampa
Hospitals
35
19
TV stations
14
26
Arenas or stadiums
2
3
Bank branches located here
160
205
Bank institutions located here
33
45
Main business address for public companies
17
24
Drinking water stations with no reported violations in the past
0
58
Drinking water stations with reported violations in the past
HMDA - Conventional home purchase loans - Applications denied
Year
Memphis
Tampa
1999
2,195
1,627
2000
2,406
1,292
2001
1,775
1,001
2002
1,444
968
2003
2,116
1,390
2004
3,266
2,093
2005
4,730
3,515
2006
5,833
4,460
2007
3,559
2,950
2008
1,174
1,075
2009
345
415
Culture and Food
Culturally, Memphis boasts rich history in the music scene and unique barbecue style. Tampa, however, is known for its Cuban influence, vibrant nightlife, and fresh seafood.
Sports Teams
Memphis is home to the NBA’s Grizzlies, while Tampa hosts the NFL’s Buccaneers, the NHL’s Lightning, and MLB's Rays, catering to a wide range of sports fans.


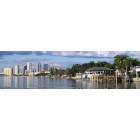
 Memphis, TN
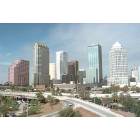
 Tampa, FL