Relocating or visiting a city requires a thorough comparison to weigh the pros and cons. This article will explore how living or visiting Memphis, TN varies from Tulsa, OK. Several parameters will be investigated such as crime/safety, weather, cost of living, education, work & economy, infrastructure, industries and occupations, biggest employers, real estate, neighborhoods, transportation, taxes, culture, sports, geographical conditions, and healthcare.
Distance between
Memphis, TN and
Tulsa, OK : 342.2 miles
Memphis's population is larger by 53%. Its population has decreased by 21,973 people (3.4%) since 2000. The population of Tulsa has grown by 18,352 people (4.7%) during that time.
Unfortunately, both Memphis and Tulsa have crime rates higher than the national average. Memphis, with a larger population, reports more incidents of violent and property crime. However, Tulsa is not far behind. Safety is an issue in some parts of both cities, so potential residents or visitors should research neighborhoods carefully.
Cost of Living
Generally, the cost of living is lower in Tulsa compared to Memphis. This includes housing, food, transportation, and utilities. However, the median income is also slightly lower in Tulsa than in Memphis.
Income Tax
Tennessee does not levy a state income tax, which provides a financial advantage for Memphis residents. In contrast, Tulsa residents have to pay Oklahoma's state income tax, which can reach up to 5%.
Property Tax
Property taxes are lower in Memphis than in Tulsa. This can make home ownership more affordable for Memphis residents compared to those living in Tulsa.
Sales Tax
Both cities have comparable sales tax rates, with Memphis at 9.25% and Tulsa at 8.517%. The sales taxes contribute to the state and municipal operations and services.
Income
Type
Memphis
Tulsa
Estimated median household income
$44,317
$51,008
Estimated per capita income
$28,571
$33,002
Cost of living index (U.S. average is 100)
85.5
86.5
If you make $50,000 in Memphis, you will have to make $50,585 in Tulsa to maintain the same standard of living.
Geographical Conditions
Memphis, located on the Mississippi River, offers a low-lying landscape with some hilly areas. Tulsa, located in the Green Country region of Oklahoma, features a more varied terrain, including rolling hills and the scenic Arkansas River.
Tulsa boasts higher high-school graduation rates compared to Memphis. Both cities have numerous universities and colleges, yet graduation rates for higher education tend to be higher in Tulsa.
Memphis has a larger economy, with key sectors being shipping, manufacturing, and healthcare. In Tulsa, energy, aviation, and healthcare dominate. However, job growth is relatively comparable in both cities.
Biggest Employers
The largest employers differ between the two cities. In Memphis, FedEx, the Methodist Le Bonheur Healthcare, and St. Jude's Children's Research Hospital provide many jobs, whereas in Tulsa, top employers include the State of Oklahoma, Tulsa Public Schools, and American Airlines.
In Memphis (Shelby County), 62.9% voted for Democrats and 36.7% for Republicans in 2012 Presidential Election. In Tulsa (Tulsa County), 36.3% voted for Democrats and 63.7% for Republicans.
Elections
Type
Democrats
Republicans
Other
Year
Memphis
Tulsa
Memphis
Tulsa
Memphis
Tulsa
2020
64.8%
40.9%
34.2%
56.5%
1.1%
2.7%
2016
62.3%
35.6%
34.7%
58.4%
3.1%
6.1%
2012
62.9%
36.3%
36.7%
63.7%
0.4%
0.0%
2008
63.8%
37.8%
36.2%
62.2%
0.0%
0.0%
2004
57.7%
35.6%
42.0%
64.4%
0.3%
0.0%
2000
56.8%
37.3%
42.3%
61.3%
0.9%
1.3%
1996
78.9%
37.1%
19.6%
53.6%
1.5%
9.3%
Breakdown of population affiliated with a religious congregation
Type
Adherents
Congregations
Religion
Memphis
Tulsa
Memphis
Tulsa
SOUTHERN BAPTIST CONVENTION
14.8%
14.9%
15.1%
18.6%
CATHOLIC CHURCH
6.5%
8.1%
2.7%
3.1%
EVANGELICAL PRESBYTERIAN CHURCH
1.5%
0.4%
0.7%
0.1%
EPISCOPAL CHURCH
0.8%
0.8%
1.8%
1.3%
MUSLIM ESTIMATE
0.5%
0.5%
0.8%
0.7%
LUTHERAN CHURCH
0.4%
0.7%
1.0%
1.2%
PRESBYTERIAN CHURCH IN AMERICA
0.4%
0.1%
0.6%
0.3%
SEVENTH DAY ADVENTIST CHURCH
0.4%
0.4%
0.9%
1.1%
AMERICAN BAPTIST CHURCHES IN THE USA
0.3%
0.3%
0.6%
0.5%
EVANGELICAL LUTHERAN CHURCH IN AMERICA
0.1%
0.4%
0.4%
0.9%
INTERNA PENTECO HOLINESS CHURCH
0.1%
0.7%
0.5%
0.7%
NATIONAL ASSOCIATION FREE WILL BAPTISTS
0.0%
0.5%
0.2%
3.1%
Weather
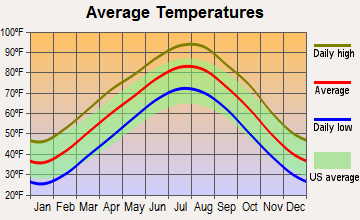
The weather conditions in Memphis and Tulsa are similar, with hot, humid summers and cool winters. Memphis, closer to the Mississippi River, experiences more humidity compared to Tulsa. Both cities are prone to tornadoes and heavy thunderstorms.
Weather and climate
Type
Memphis
Tulsa
Temperature - Average
61.9°F
60.4°F
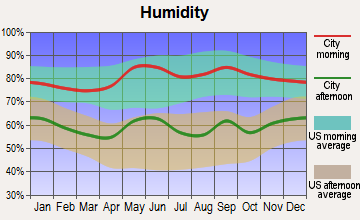
Humidity - Average morning or afternoon humidity
74%
73.8%
Humidity - Differences between morning and afternoon humidity
33%
33%
Humidity - Maximum monthly morning or afternoon humidity
85%
85%
Humidity - Minimum monthly morning or afternoon humidity
52%
52%
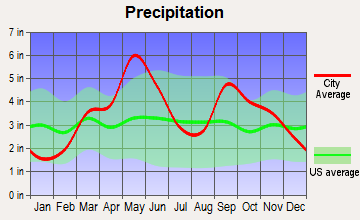
Precipitation - Yearly average
54.3 in
42.1 in
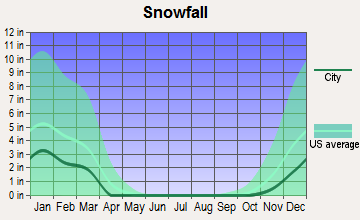
Snowfall - Yearly average
8.6 in
18.4 in
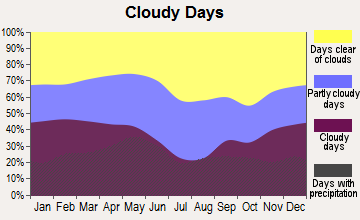
Clouds - Number of days clear of clouds
19.7%
21.1%
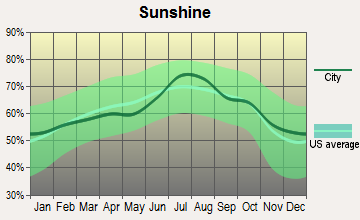
Sunshine amount - Average
68.7%
64.8%
Sunshine amount - Differences during a year
24%
24%
Sunshine amount - Maximum monthly
74%
74%
Sunshine amount - Minimum monthly
50%
50%
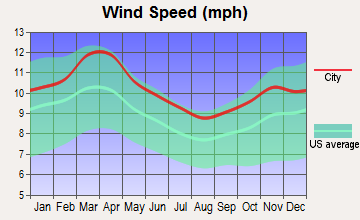
Wind speed - Average
8.8 mph
10.2 mph
Average climate in Memphis, Tennessee
Average climate in Tulsa, Oklahoma
Air pollution
Type
AQI
CO
NO2
OZONE
PB
PM10
PM25
SO2
Year
Memphis
Tulsa
Memphis
Tulsa
Memphis
Tulsa
Memphis
Tulsa
Tulsa
Memphis
Memphis
Tulsa
Memphis
Tulsa
2018
81
88
0.24
0.24
10.4
N/A
27.1
28.6
0.004
N/A
19.0
N/A
8.1
11.6
0.4
0.4
2017
74
80
0.24
0.22
10.2
N/A
28.1
29.9
0.004
N/A
17.5
N/A
7.9
10.2
0.3
0.5
2016
76
86
0.24
0.24
10.2
N/A
28.8
29.1
0.005
N/A
19.6
N/A
8.5
9.5
0.9
0.5
2015
77
74
0.26
0.25
11.1
N/A
26.9
28.1
0.004
N/A
N/A
N/A
9.2
8.6
1.0
0.8
2014
75
74
0.27
0.16
10.1
N/A
26.5
29.2
0.005
N/A
N/A
N/A
9.9
9.2
1.3
0.3
2013
74
85
0.31
0.21
8.3
N/A
26.6
29.8
0.005
N/A
N/A
N/A
10.2
10.1
1.0
0.5
2012
94
103
0.32
0.21
9.3
N/A
29.7
32.4
0.007
N/A
N/A
N/A
10.7
11.7
0.6
0.7
2011
93
108
0.34
0.27
10.0
N/A
29.0
33.8
0.005
N/A
N/A
N/A
11.1
13.8
0.5
0.8
2010
95
83
0.43
0.26
10.3
N/A
27.9
30.1
0.004
N/A
N/A
N/A
12.9
12.2
N/A
0.7
2009
86
88
0.35
0.26
8.7
N/A
24.9
29.8
0.004
N/A
N/A
N/A
11.8
12.2
N/A
0.7
2008
94
71
0.36
N/A
10.3
N/A
26.3
26.7
0.007
N/A
N/A
N/A
13.2
N/A
N/A
N/A
2007
106
77
0.47
0.32
11.2
N/A
26.7
28.8
0.007
N/A
N/A
N/A
14.8
N/A
5.6
0.8
2006
108
95
0.43
N/A
13.0
N/A
26.8
32.9
N/A
N/A
N/A
N/A
14.7
N/A
6.3
N/A
2005
110
84
0.46
N/A
10.1
N/A
26.9
28.9
N/A
N/A
N/A
N/A
17.9
N/A
4.9
N/A
2004
98
71
0.51
N/A
N/A
N/A
24.9
27.5
N/A
N/A
N/A
N/A
14.5
N/A
5.9
N/A
2003
110
94
0.57
N/A
20.1
N/A
25.3
29.2
N/A
N/A
N/A
N/A
15.0
N/A
5.8
N/A
2002
110
85
0.58
0.83
20.4
7.8
25.1
27.7
N/A
N/A
15.6
N/A
N/A
N/A
4.5
N/A
2001
111
102
0.66
0.75
24.7
14.4
26.0
30.6
N/A
N/A
22.7
N/A
N/A
N/A
6.1
N/A
2000
103
101
0.63
0.69
25.2
15.3
26.2
28.9
N/A
N/A
24.9
N/A
N/A
N/A
6.4
N/A
Natural disasters
Type
Memphis
Tulsa
Tornado activity compared to U.S. average
198.6%
277.6%
Earthquake activity compared to U.S. average
474%
901.9%
Natural disasters compared to U.S. average
18%
34%
Transportation
Both cities offer public transportation, yet Memphis's system is larger due to its population. Traffic congestion is less common in Tulsa, providing shorter commuting times compared to Memphis.
Transport
Type
Memphis
Tulsa
Amtrak stations
1
1
Amtrak stations nearby
1
1
FAA registered aircraft
1
808
FAA registered aircraft manufacturers and dealers
52
35
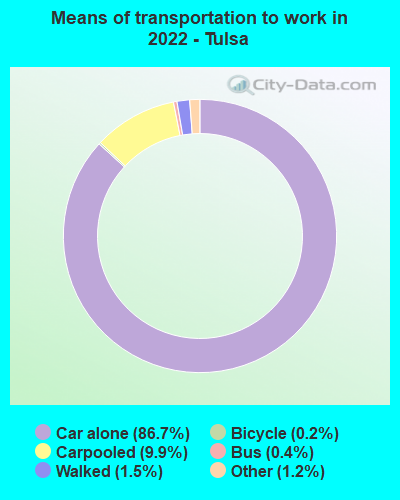
Means of transportation to work
Type
Memphis
Tulsa
Bus
0.4%
0.1%
Carpooled
7.5%
9%
Car alone
88.8%
87.9%
Motorcycle
0.1%
0.1%
Taxicab
0.1%
0.1%
Walked
1.2%
1.4%
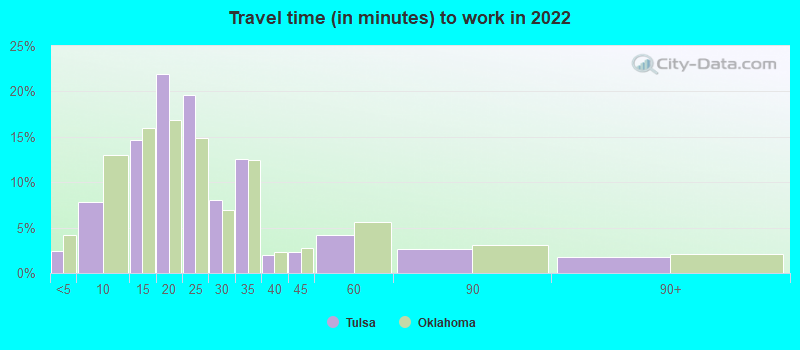
Average travel time to work
Type
Memphis
Tulsa
Average
27 min
23.8 min
Other means
22.5 min
19.2 min
Public transportation
43.5 min
40.1 min
Private vehicle occupancy
Type
Memphis
Tulsa
Average
1.1
1.2
Drove alone
89.9%
88.9%
In 2 person carpool
7.9%
8.7%
In 3 person carpool
1.6%
1.5%
In 4 person carpool
0.4%
0.3%
In 5-6 person carpool
0.2%
0.5%
In 7+ person carpool
0.1%
0.1%
How many people usually rode to work in the car, truck or van.
Real Estate
Memphis offers a wider range of real estate options, as the city is larger. Tulsa real estate is generally more affordable, with a lower average home price. Both cities offer both urban and suburban living options.
Neighborhoods
Memphis offers diverse neighborhoods, from bustling Downtown to quieter areas like Midtown. Tulsa's neighborhoods are somewhat comparable, ranging from the revitalized Downtown to quieter, residential South Tulsa.
Houses and residents
Type
Memphis
Tulsa
Houses
288,491
194,402
Average household size (people)
2.5
2.3
Median year apartment built
1972
1975
Median year house/condo built
1967
1969
Length of stay in the house since moving in
16.2 years
12.9 years
Houses occupied
256,968 (89.1%)
173,943 (89.5%)
Houses occupied by owners
119,622 (46.6%)
89,307 (51.3%)
Houses occupied by renters
137,346 (53.4%)
84,636 (48.7%)
Median rent asked for vacant for-rent units
$760.83
$899.30
Median monthly housing costs
$967
$897
Median price asked for vacant for-sale houses and condos
$201,932
$163,212
Estimated median house or condo value
$142,800
$172,000
Median numbers of rooms
5.5
5.2
Median number of rooms in apartments
4.8
4.1
Median number of rooms in houses and condos
6.6
6.4
Median house price - detached houses
$205,904
$247,367
Median house price - in 2-unit structures
Over $1,000,000
$496,968
Median house price - in 3-to-4-unit structures
$145,165
$94,964
Median house price - in 5 or more unit structures
$201,411
$176,274
Median house price - mobile homes
$93,577
$73,235
Median house price - occupied boats, rvs, vans etc.
$39,582
$166,906
Median house price - Townhouses or other attached units
$170,154
$184,309
Median house price - All housing units
$204,886
$241,263
Median house age
52
49
Renting percentage
48.1%
46.5%
Housing density (houses/condos per square mile)
1,032.8
1,064.4
House value disparities
44.1%
41.8%
Household income disparities
48.2%
48.1%
Median household income for houses/condes with a mortgage
$72,611
$84,820
Median household income for apartments without a mortgage
$53,615
$57,403
Housing units without a mortgage
1,461 (2%)
855 (1.7%)
Housing units with both a second mortgage and home equity loan
3,970 (5.4%)
2,464 (4.8%)
Housing units with a mortgage
71,386 (98%)
50,494 (98.3%)
Housing units with a home equity loan
322 (0.4%)
93 (0.2%)
Housing units with a second mortgage
5,907 (8.1%)
3,580 (7%)
House/condo owner moved in on average (years ago)
16
11
House/condo renter moved in on average (years ago)
1
1
Housing units lacking complete kitchen facilities
5.7%
2.9%
Housing units lacking complete plumbing facilities
4.6%
1.7%
Housing units in structures
Housing units in structures
Memphis
Tulsa
One, detached
61.0%
62.9%
One, attached
5.8%
2.8%
Two
2.1%
1.9%
3 or 4
7.4%
5.0%
5 to 9
9.1%
6.8%
10 to 19
5.6%
9.2%
20 to 49
1.8%
4.4%
50 or more
6.2%
5.8%
Mobile homes
0.8%
1.1%
Boats, RVs, vans, etc.
0.1%
0.2%
Median real estate property taxes paid for housing units
Self-employed workers in own not incorporated business
16,111
13,964
State government workers
7,650
5,897
Unpaid family workers
668
284
Industries and Occupations
The major industries in Memphis are logistics, healthcare, and manufacturing, while Tulsa is known for its energy, aviation, and telecommunications industries. Occupations in healthcare, education, and logistics are prevalent in Memphis, while jobs in energy, aviation, and technology are common in Tulsa.
Memphis has an excellent health care system, with renowned hospitals such as St. Jude's. In contrast, Tulsa’s health care system is strong but is not recognized on the same scale nationally.
Health (county statistics)
Type
Memphis
Tulsa
General health status score of residents in this county from 1 (poor) to 5 (excellent)
Memphis has a more developed infrastructure due to its size and status as a shipping hub. In contrast, Tulsa, while smaller, has a well-maintained infrastructure, but less extensive than Memphis.
Infrastructure
Type
Memphis
Tulsa
Hospitals
35
45
TV stations
14
20
Arenas or stadiums
2
2
Bank branches located here
160
160
Bank institutions located here
33
40
Main business address for public companies
17
27
Drinking water stations with reported violations in the past
HMDA - Conventional home purchase loans - Applications denied
Year
Memphis
Tulsa
1999
2,195
2,135
2000
2,406
1,531
2001
1,775
1,216
2002
1,444
1,106
2003
2,116
1,243
2004
3,266
1,354
2005
4,730
1,709
2006
5,833
1,756
2007
3,559
1,014
2008
1,174
517
2009
345
327
Culture and Food
Both cities offer a rich cultural and culinary experience. Memphis is known for its blues, rock 'n' roll history, and soul food, while Tulsa offers a blend of Southern, Western, and Native American cultures, with a food scene highlighting BBQ, Mexican food, and craft beer.
Sports Teams
Memphis is home to the NBA team, the Memphis Grizzlies. Tulsa doesn't have a major league sports team, but does have minor league baseball and soccer teams and the popular college football team, the Golden Hurricane.


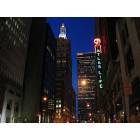


 Memphis, TN
 Tulsa, OK