Mesa and Surprise, both appealing cities in the sun-drenched state of Arizona, offer unique experiences for both residents and tourists. From crime rates to cost of living, from education to economy, each city has its unique points to consider. Whether it's the large number of industries and employers in Mesa, or the tranquil neighborhoods in Surprise, there are enough reasons to choose either. This detailed comparison aims to highlight their differences and similarities to aid your decision.
Distance between
Mesa, AZ and
Surprise, AZ : 41.0 miles
Mesa's population is larger by 242%. Its population has grown by 113,100 people (28.5%) since 2000. The population of Surprise has grown by 118,343 people (383.6%) during that time.
While crime is a concern in any city, Mesa's crime rate is higher than that of Surprise. However, the city authorities work efficiently to ensure safety and security, making Mesa fairly safe for both residents and tourists. Surprise, on the other hand, boasts one of the lowest crime rates in the state, making it safer in comparison. It's a peaceful city that attracts families looking for a safe community living environment.
City-data.com crime index counts serious crimes and violent crime more heavily. It adjusts for the number of visitors and daily workers commuting into cities. (higher means more crime, U.S. average = 301.1)
City-data.com crime index counts serious crimes and violent crime more heavily. It adjusts for the number of visitors and daily workers commuting into cities. (higher means more crime, U.S. average = 301.1)
Sex Offenders
According to our data, there are 635 registered sex offenders living in Mesa and 70 registered sex offenders living in . The ratio of residents to sex offenders in Mesa is 763 to 1; the ratio in Surprise is 1,890 to 1. The number of registered sex offenders compared to the number of residents is larger in Mesa than in Surprise.
Cost of Living
The cost of living in Mesa is somewhat higher than in Surprise. This is due to higher housing costs and slightly more expensive goods and services. On the other hand, Surprise offers a more affordable lifestyle while maintaining the comforts of city living. However, both cities are relatively cheaper than many other cities in the US.
Income Tax
Both cities do not have a city income tax and share Arizona's state income tax, which ranges from 2.59% to 4.50% dependent on income levels.
Property Tax
Mesa's property tax rates are slightly higher than those in Surprise. However, both cities have property tax rates lower than the national average.
Sales Tax
The sales tax in Mesa is higher due to a city sales tax of 2%, in addition to the state’s 5.6% sales tax. Surprise, on the other hand, has only a 2.2% city sales tax, making the combined sales tax lower than Mesa.
Income
Type
Mesa
Surprise
Estimated median household income
$69,266
$78,411
Estimated per capita income
$35,439
$36,114
Cost of living index (U.S. average is 100)
101
101.1
If you make $50,000 in Mesa, you will have to make $50,050 in Surprise to maintain the same standard of living.
Geographical Conditions
Both cities sit in the Sonoran Desert and are surrounded by mountain ranges. Mesa is closer to the Salt River and has higher air pollution, while Surprise, farther from major urban centers, has cleaner air and clear, picturesque desert views.
Mesa offers learners an array of excellent educational opportunities. It's home to multiple school districts and higher education institutions including Mesa Community College and Arizona State University Polytechnic campus. Surprise, though smaller, also offers quality education, with Dysart Unified School District serving the area and Ottawa University providing higher education options.
Mesa’s economy thrives on healthcare, education, and tourism industries. Large companies like Banner Health Systems employ a significant portion of the population. Conversely, Surprise has a smaller, but steady economy focused around retail, healthcare, and local government jobs.
Biggest Employers
Banner Health System, Mesa Public Schools, and the City of Mesa are some of the largest employers in Mesa. In Surprise, the Walmart Supercenter, Dysart Unified School District, and the City of Surprise are the primary employers.
There were 2,046 building permits issued in Mesa in 2012 (1543 more than in 2011) compared to 2,685 building permits issued in Surprise in 2012 (2466 more than in 2011).
Weather
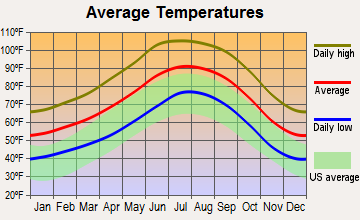
Both Mesa and Surprise offer sun-soaked climates typical of Arizona. Mesa, being larger and closer to the metropolitan area, can be slightly hotter in the summer. But it also offers plenty of recreational areas to beat the heat. Surprise enjoys a slightly cooler climate, owing to its higher elevation. Both cities have mild and pleasant winters attracting snowbirds from colder states.
Weather and climate
Type
Mesa
Surprise
Temperature - Average
71.7°F
72.5°F
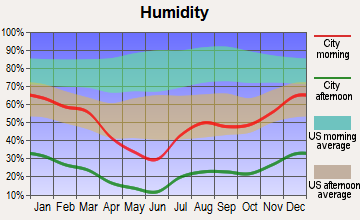
Humidity - Average morning or afternoon humidity
37.5%
37.5%
Humidity - Differences between morning and afternoon humidity
48%
48%
Humidity - Maximum monthly morning or afternoon humidity
60%
60%
Humidity - Minimum monthly morning or afternoon humidity
12%
12%
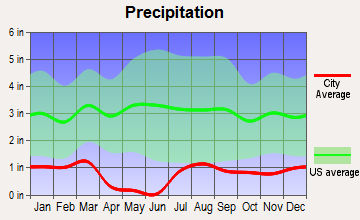
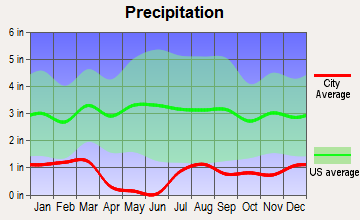
Precipitation - Yearly average
9.5 in
9.7 in
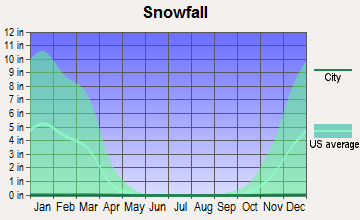
Snowfall - Yearly average
0 in
0.1 in
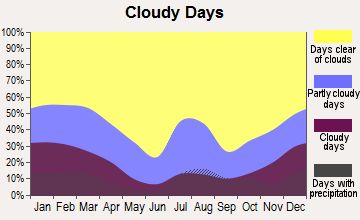
Clouds - Number of days clear of clouds
35.2%
35.3%
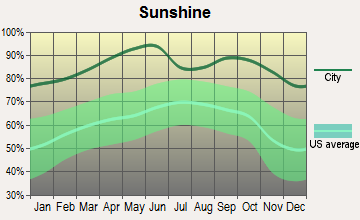
Sunshine amount - Average
92.8%
92.8%
Sunshine amount - Differences during a year
16%
16%
Sunshine amount - Maximum monthly
95%
95%
Sunshine amount - Minimum monthly
79%
79%
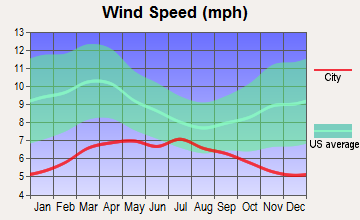
Wind speed - Average
6.6 mph
6.6 mph
Average climate in Mesa, Arizona
Average climate in Surprise, Arizona
Air pollution
Type
AQI
CO
NO2
OZONE
PM10
PM25
SO2
Year
Mesa
Surprise
Mesa
Surprise
Mesa
Surprise
Mesa
Surprise
Mesa
Surprise
Mesa
Surprise
Mesa
Surprise
2018
200
134
0.28
0.35
15.1
13.3
34.8
34.8
28.1
30.8
7.5
7.7
0.6
0.6
2017
128
110
0.28
0.35
15.8
14.0
35.1
34.8
24.5
29.7
8.2
6.8
1.4
1.4
2016
121
106
0.31
0.31
15.7
13.8
34.6
30.4
21.5
29.3
6.8
7.0
0.4
0.4
2015
104
88
0.34
0.26
17.6
15.3
33.4
30.5
17.7
22.9
6.8
7.2
0.9
0.9
2014
135
109
0.33
0.28
19.6
17.3
34.0
31.9
30.8
27.1
8.4
7.7
1.1
1.1
2013
141
117
0.31
0.29
19.9
17.4
34.8
32.7
29.3
25.3
5.8
7.6
0.9
0.9
2012
159
119
0.38
0.27
21.2
18.7
33.7
31.5
37.9
30.5
8.1
8.7
1.3
1.3
2011
205
165
0.31
0.28
18.5
17.6
34.1
31.5
40.4
29.6
9.5
9.5
0.9
0.9
2010
100
89
0.31
0.28
16.4
17.2
32.9
30.0
29.5
21.9
8.3
N/A
1.2
0.9
2009
109
122
0.33
0.29
16.6
17.6
32.3
27.5
37.8
32.3
N/A
N/A
1.0
1.8
2008
106
110
0.29
0.37
17.5
18.8
34.2
26.8
39.9
38.9
N/A
N/A
1.1
2.4
2007
134
128
0.43
0.45
19.3
20.9
31.0
24.9
50.6
47.6
N/A
N/A
1.9
2.4
2006
138
132
0.44
0.32
22.1
22.8
30.9
25.4
57.5
51.0
N/A
N/A
1.8
2.3
2005
109
103
0.49
0.38
22.6
23.3
30.0
24.3
49.1
45.9
N/A
N/A
1.7
2.8
2004
97
94
0.51
0.55
22.4
24.3
30.4
23.7
33.4
32.1
N/A
N/A
1.4
N/A
2003
99
97
0.56
0.52
24.0
26.6
31.7
25.8
42.6
42.6
N/A
N/A
1.4
N/A
2002
110
102
0.69
0.54
24.9
28.4
28.0
27.4
41.8
41.8
N/A
N/A
1.6
N/A
2001
105
100
0.65
0.54
23.8
28.3
27.2
28.9
37.8
37.8
N/A
N/A
1.5
N/A
2000
117
113
0.76
1.08
29.8
29.7
27.1
25.2
45.6
45.6
N/A
N/A
1.7
N/A
Natural disasters
Type
Mesa
Surprise
Tornado activity compared to U.S. average
18.1%
15.8%
Earthquake activity compared to U.S. average
2,348.6%
2,864.1%
Natural disasters compared to U.S. average
16%
16%
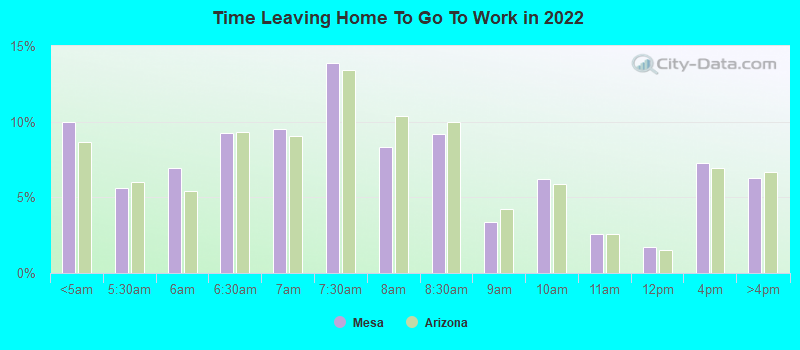
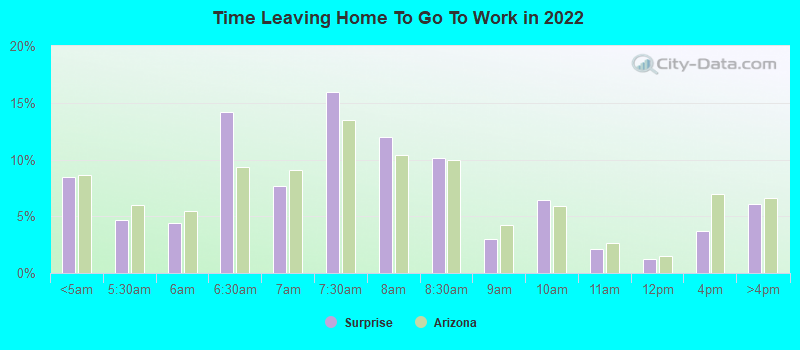
Transportation
Mesa enjoys convenient connections to other parts of the Phoenix Metropolitan Area via multiple freeways and the light rail system, Valley Metro Rail. Surprise is more car-dependent, with lesser public transit options. However, Surprise is only a 45-minute drive to downtown Phoenix.
Transport
Type
Mesa
Surprise
Amtrak stations nearby
2
1
FAA registered aircraft
828
65
FAA registered aircraft manufacturers and dealers
20
1
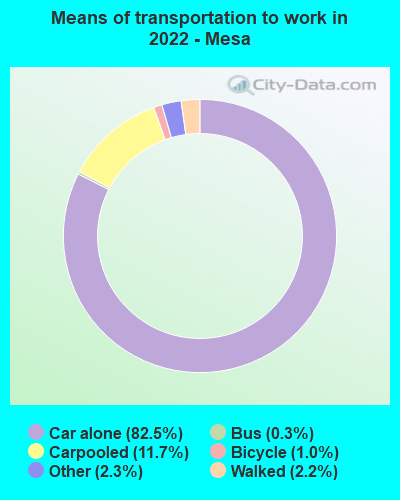
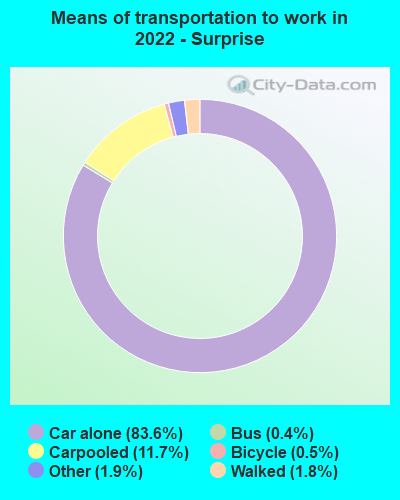
Means of transportation to work
Type
Mesa
Surprise
Bicycle
0.6%
0.8%
Bus
0.3%
0.3%
Carpooled
14.4%
11.4%
Car alone
79.9%
84.1%
Motorcycle
0.5%
0.3%
Walked
2.5%
1.7%
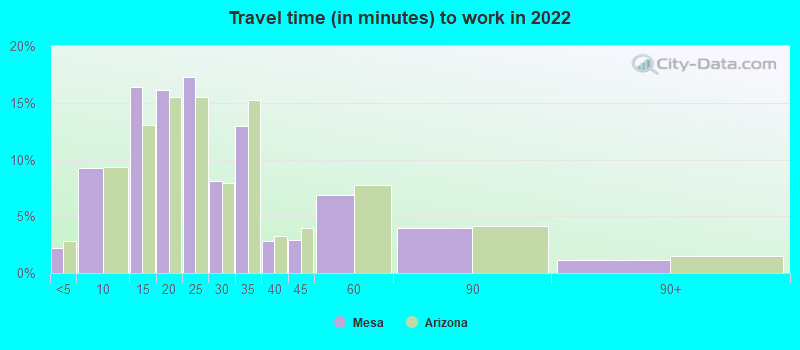
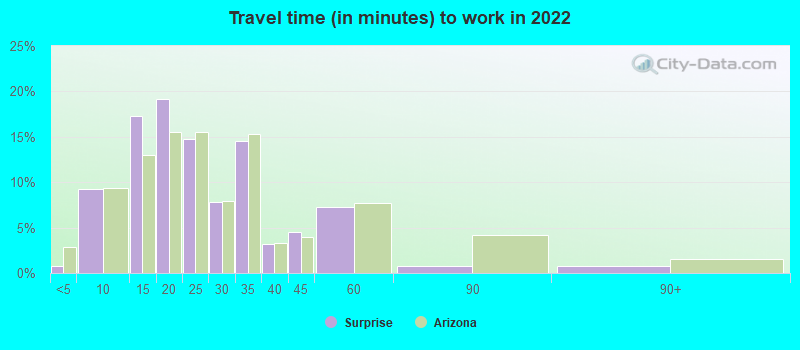
Average travel time to work
Type
Mesa
Surprise
Average
25 min
24.6 min
Other means
26.9 min
32.7 min
Public transportation
45.9 min
45.4 min
Private vehicle occupancy
Type
Mesa
Surprise
Average
1.2
1.2
Drove alone
85.8%
90%
In 2 person carpool
11.1%
7.1%
In 3 person carpool
2.1%
1.3%
In 4 person carpool
0.5%
1.1%
In 5-6 person carpool
0.5%
0.4%
In 7+ person carpool
0.1%
0.1%
How many people usually rode to work in the car, truck or van.
Real Estate
Real-estate in Mesa is more expensive in comparison to Surprise, reflecting its larger size and closer proximity to Phoenix. The market is competitive with higher demand for homes. In contrast, Surprise offers affordable options, although the real-estate market is trending upward due to growing demand.
Neighborhoods
Mesa offers a mix of urban and suburban neighborhoods. Its historic downtown area is attractive with locally owned businesses and cultural attractions. Surprise, predominantly suburban, offers calm, family-friendly neighborhoods.
Houses and residents
Type
Mesa
Surprise
Houses
221,995
62,261
Average household size (people)
2.6
2.7
Median year apartment built
1987
2004
Median year house/condo built
1989
2005
Length of stay in the house since moving in
11.2 years
8.4 years
Houses occupied
199,112 (89.7%)
55,339 (88.9%)
Houses occupied by owners
126,146 (63.4%)
43,073 (77.8%)
Houses occupied by renters
72,966 (36.6%)
12,266 (22.2%)
Median rent asked for vacant for-rent units
$1,890
$4,015
Median monthly housing costs
$1,220
$1,373
Median price asked for vacant for-sale houses and condos
$262,297
$244,876
Estimated median house or condo value
$350,100
$354,100
Median numbers of rooms
5.2
5.7
Median number of rooms in apartments
4
4.9
Median number of rooms in houses and condos
5.9
6
Median house price - detached houses
$421,563
$337,913
Median house price - in 3-to-4-unit structures
$226,327
$157,006
Median house price - in 5 or more unit structures
$250,077
$147,429
Median house price - mobile homes
$70,636
$165,662
Median house price - occupied boats, rvs, vans etc.
$94,693
$112,765
Median house price - Townhouses or other attached units
$256,984
$335,357
Median house price - All housing units
$364,728
$327,855
Median house age
33
16
Renting percentage
36.8%
21.4%
Housing density (houses/condos per square mile)
1,776.1
895.9
House value disparities
31.1%
20.9%
Household income disparities
42.1%
35.2%
Median household income for houses/condes with a mortgage
$97,987
$92,681
Median household income for apartments without a mortgage
$63,218
$66,954
Housing units without a mortgage
1,338 (1.6%)
650 (2.1%)
Housing units with both a second mortgage and home equity loan
5,628 (6.9%)
1,633 (5.2%)
Housing units with a mortgage
80,572 (98.4%)
30,732 (97.9%)
Housing units with a home equity loan
48 (0.1%)
90 (0.3%)
Housing units with a second mortgage
7,236 (8.8%)
2,319 (7.4%)
House/condo owner moved in on average (years ago)
8
6
House/condo renter moved in on average (years ago)
1
1
Housing units lacking complete kitchen facilities
0.9%
1.2%
Housing units lacking complete plumbing facilities
0.4%
0.4%
Housing units in structures
Housing units in structures
Mesa
Surprise
One, detached
55.9%
82.6%
One, attached
6.6%
1.5%
Two
1.0%
1.0%
3 or 4
5.1%
1.5%
5 to 9
6.0%
1.9%
10 to 19
5.0%
2.4%
20 to 49
2.8%
1.2%
50 or more
5.3%
4.0%
Mobile homes
11.8%
3.8%
Boats, RVs, vans, etc.
0.6%
0.2%
Median real estate property taxes paid for housing units
Self-employed workers in own not incorporated business
10,562
3,239
State government workers
6,039
2,234
Unpaid family workers
830
68
Industries and Occupations
The healthcare industry dominates in Mesa, but retail, education, tourism, and tech-related occupations also employ a significant number of residents. Surprise, however, is more limited in industrial diversity, with retail, healthcare, and local government offering most of the job opportunities.
Health diagnosing and treating practitioners and other technical occupations
6.7%
7.1%
Food preparation and serving related occupations
6.0%
8.1%
Healthcare support occupations
5.7%
6.0%
Health technologists and technicians
3.7%
2.2%
Personal care and service occupations
3.6%
4.1%
Production occupations
3.0%
3.0%
Building and grounds cleaning and maintenance occupations
2.6%
2.1%
Material moving occupations
2.3%
1.8%
Transportation occupations
1.9%
0.5%
Community and social service occupations
1.8%
1.4%
Computer and mathematical occupations
1.6%
1.7%
Arts, design, entertainment, sports, and media occupations
1.3%
0.3%
Legal occupations
0.7%
1.8%
Health Care
Mesa provides excellent health care facilities with many major hospitals. Surprise, although smaller, is very close to the cardiac-specialist hospital, Abrazo Arrowhead Campus, in the neighboring city of Glendale.
Mesa dwellers enjoy a comprehensive infrastructure with good road networks, hospitals, parks, and shopping centers. The city has embraced technological advancements with widespread availability of high-speed internet. Surprise, while smaller, has been expanding its infrastructure steadily in line with its growing population.
Infrastructure
Type
Mesa
Surprise
TV stations
18
3
Bank branches located here
97
29
Bank institutions located here
22
12
Drinking water stations with no reported violations in the past
1
0
Drinking water stations with reported violations in the past
HMDA - Conventional home purchase loans - Applications denied
Year
Mesa
Surprise
1999
2,532
154
2000
2,428
148
2001
1,854
170
2002
1,520
178
2003
1,991
291
2004
2,897
632
2005
3,857
1,000
2006
3,727
901
2007
1,896
469
2008
765
185
2009
440
123
Culture and Food
Mesa is rich in culture with a historic downtown, art centers, and museums. It offers a diverse food scene with influences from Mexican, Native American, and other cultures. Surprise, while smaller, has a growing arts scene and offers a range of dining options with a heavy emphasis on American and Mexican cuisines.
Sports Teams
Mesa is home to the Chicago Cubs and Oakland A's spring training camps attracting baseball fans. Surprise, meanwhile, hosts spring training for the Kansas City Royals and Texas Rangers. Both cities offer abundant recreational sports facilities and community programs.


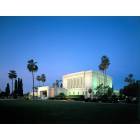
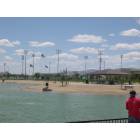
 Mesa, AZ
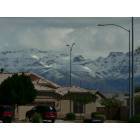
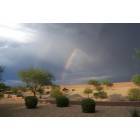
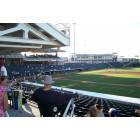
 Surprise, AZ