When comparing the Metropolitan Government of Nashville and Davidson County, TN, referred to as Metro Nashville, with Miami, FL, there are various facets of lifestyle and living conditions to consider. These two areas are unique regarding their local culture, cost of living, climate, and economic opportunities. This comprehensive comparison will provide potential residents and visitors with key insights about the typical living conditions, work opportunities, tax regimes, housing, and other fundamental aspects of life in these two robust and vibrant locations.
According to local data, the crime rates in both Metro Nashville and Miami are relatively high compared to the national average, with Miami having a slightly higher rate for violent and property crimes. Both cities have focused on improving police presence and developing community relations programs to improve safety. For tourists, both cities offer safe tourism hotspots, though as with any major metropolitan region, there are areas it's better to avoid, particularly at night.
Cost of Living
The overall cost of living in Miami is generally higher than in Metro Nashville. Miami's higher housing costs significantly contribute to this disparity. However, other costs like healthcare, groceries, and transportation are also usually more expensive in Miami.
Income Tax
Florida, including Miami, has no state income tax, which could be attractive for high-earning professionals. Conversely, Tennessee, including Metropolitan Nashville, also does not impose a state income tax.
Property Tax
Both Metro Nashville and Miami have property tax. However, property taxes in Metro Nashville are generally higher than those in Miami. This difference, in addition to the overall lower cost of real estate in Nashville, might make property ownership more attainable in Miami for some people.
Sales Tax
Metro Nashville has a higher combined state and local sales tax rate of approximately 9.5%, compared to Miami's sales tax of about 7%. These rates can influence the final costs of consumer goods and services in both locations.
Income
Type
Metropolitan Government
Miami
Estimated median household income
$65,348
$48,789
Estimated per capita income
$43,994
$37,223
Cost of living index (U.S. average is 100)
97.9
110.1
If you make $50,000 in Metropolitan Government, you will have to make $56,231 in Miami to maintain the same standard of living.
Geographical Conditions
Geographically, both cities are different. Miami is coastal, with beaches, and a vulnerability to hurricanes. Metro Nashville, situated in central Tennessee, showcases rolling hills, rivers, and has a lower risk of natural disasters.
Geographical information
Type
Metropolitan Government
Miami
Land area
502.3 sq. miles
35.7 sq. miles
Population density
1,236.2 people per sq. mile
12,331 people per sq. mile
Relative area comparison
Metropolitan Government, TN Miami, FL
Education
Both cities have a range of educational opportunities. Metro Nashville is home to premier institutions like Vanderbilt University, and it also has well-regarded public schools. Miami has a diverse array of public and private schools, as well as universities like the University of Miami and Florida International University.
As for economic opportunities, both cities are strong, but they focus on different industries. Miami has a diversified economy with strong sectors in tourism, international trade, and finance. Metro Nashville, while having an active tourism industry, is also known as a center for healthcare services, education, and music industries.
Biggest Employers
In Metro Nashville, major employers include Vanderbilt University and Medical Centre, Nissan North America, and HCA Healthcare. Miami, on the other hand, has a diverse list of major employers such as Baptist Health South Florida, the University of Miami, and American Airlines.
In Metropolitan Government (Davidson County), 58.5% voted for Democrats and 39.9% for Republicans in 2012 Presidential Election. In Miami (Miami-Dade County), 61.8% voted for Democrats and 38.0% for Republicans.
Elections
Type
Democrats
Republicans
Other
Year
Metropolitan Government
Miami
Metropolitan Government
Miami
Metropolitan Government
Miami
2020
65.0%
53.5%
32.6%
46.2%
2.3%
0.3%
2016
60.1%
63.4%
34.1%
33.9%
5.7%
2.7%
2012
58.5%
61.8%
39.9%
38.0%
1.6%
0.3%
2008
60.0%
58.1%
39.0%
41.9%
1.0%
0.0%
2004
54.9%
53.0%
44.6%
46.7%
0.4%
0.3%
2000
57.9%
52.7%
40.4%
46.4%
1.7%
0.9%
1996
79.3%
57.3%
18.1%
37.9%
2.6%
4.8%
Breakdown of population affiliated with a religious congregation
Type
Adherents
Congregations
Religion
Metropolitan Government
Miami
Metropolitan Government
Miami
SOUTHERN BAPTIST CONVENTION
14.1%
3.2%
19.6%
21.8%
CATHOLIC CHURCH
4.9%
21.8%
2.3%
4.5%
EPISCOPAL CHURCH
1.5%
0.5%
1.8%
2.1%
SEVENTH DAY ADVENTIST CHURCH
1.1%
1.1%
1.7%
4.3%
COPTIC ORTHODOX CHURCH
1.0%
0.0%
0.5%
0.0%
MUSLIM ESTIMATE
0.8%
0.9%
1.4%
1.0%
PRESBYTERIAN CHURCH IN AMERICA
0.8%
0.1%
0.9%
1.0%
CUMBERLAND PRESBYTERIAN CHURCH
0.4%
0.0%
1.3%
0.1%
Weather
The climate drastically differs between the two cities. Miami is characterized by a tropical monsoon climate with hot summers and warm winter months, while Metro Nashville experiences a humid subtropical climate. It has hot summers like Miami, but winters are generally much cooler, with occasional snowfall. It's important for relocating residents and tourists to account for these climatic differences when planning activities or moving.
Weather and climate
Type
Metropolitan Government
Miami
Temperature - Average
58.4°F
77.3°F
Humidity - Average morning or afternoon humidity
75.9%
77.3%
Humidity - Differences between morning and afternoon humidity
38%
31%
Humidity - Maximum monthly morning or afternoon humidity
89%
86%
Humidity - Minimum monthly morning or afternoon humidity
51%
55%
Precipitation - Yearly average
49 in
60 in
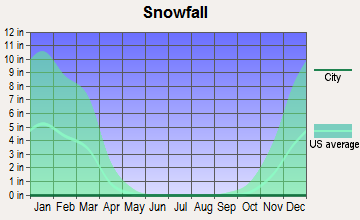
Snowfall - Yearly average
17.8 in
0 in
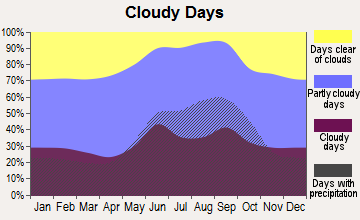
Clouds - Number of days clear of clouds
17.1%
12.3%
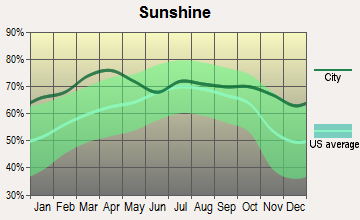
Sunshine amount - Average
59.7%
76.8%
Sunshine amount - Differences during a year
23%
16%
Sunshine amount - Maximum monthly
65%
79%
Sunshine amount - Minimum monthly
42%
63%
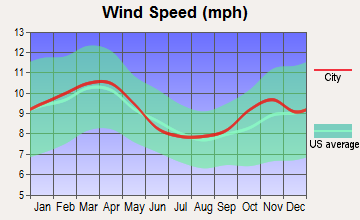
Wind speed - Average
7.7 mph
9.1 mph
Average climate in Metropolitan Government, Tennessee
Average climate in Miami, Florida
Air pollution
Type
AQI
CO
NO2
OZONE
PB
PM10
PM25
SO2
Year
Metropolitan Government
Miami
Metropolitan Government
Miami
Metropolitan Government
Miami
Metropolitan Government
Miami
Metropolitan Government
Metropolitan Government
Miami
Metropolitan Government
Miami
Metropolitan Government
Miami
2018
71
72
0.40
0.24
13.8
2.7
24.1
31.8
N/A
N/A
15.2
15.5
9.2
8.6
0.2
0.3
2017
70
80
0.38
0.27
14.4
3.0
26.8
30.9
N/A
N/A
15.3
N/A
8.7
8.5
0.1
0.4
2016
90
68
0.42
0.30
16.1
2.9
26.4
32.6
N/A
N/A
N/A
N/A
10.1
7.2
0.0
0.0
2015
68
62
0.43
0.23
15.5
2.4
23.6
29.0
N/A
N/A
N/A
N/A
10.8
8.2
0.1
0.0
2014
66
71
N/A
0.21
N/A
3.8
26.3
30.7
N/A
N/A
N/A
N/A
9.8
8.0
1.4
0.0
2013
62
64
N/A
0.22
N/A
3.1
N/A
30.8
N/A
N/A
N/A
N/A
9.7
7.9
N/A
0.0
2012
81
71
N/A
0.19
N/A
2.9
28.3
32.1
N/A
N/A
N/A
N/A
11.0
8.7
2.3
0.0
2011
81
72
N/A
0.16
N/A
3.0
25.9
32.3
N/A
N/A
N/A
N/A
11.0
8.7
1.7
0.0
2010
80
77
N/A
0.31
N/A
4.2
24.3
32.3
N/A
N/A
N/A
N/A
12.2
9.1
2.2
0.0
2009
72
67
N/A
0.53
N/A
3.3
22.5
31.9
N/A
N/A
N/A
N/A
11.5
9.1
2.4
0.0
2008
81
95
N/A
0.55
N/A
3.8
25.7
31.0
N/A
N/A
N/A
18.0
13.4
10.5
2.5
0.0
2007
99
94
N/A
0.59
N/A
5.0
27.4
33.5
N/A
N/A
N/A
21.9
15.5
10.5
2.7
0.0
2006
93
87
0.69
0.48
N/A
5.8
24.9
34.6
N/A
N/A
N/A
22.3
14.9
10.2
2.9
0.0
2005
104
75
0.56
0.55
N/A
6.0
23.5
31.8
N/A
N/A
N/A
18.8
16.9
8.7
3.1
0.0
2004
83
69
0.61
1.02
N/A
5.9
22.0
31.3
0.006
N/A
N/A
19.5
N/A
8.5
2.6
0.3
2003
93
70
0.67
0.99
N/A
6.5
18.5
29.5
0.005
N/A
N/A
N/A
15.8
8.4
3.8
0.4
2002
92
75
0.68
0.71
N/A
6.3
20.2
30.2
N/A
N/A
N/A
N/A
15.3
8.4
4.3
2.1
2001
95
84
0.90
0.80
N/A
5.9
19.5
30.2
N/A
N/A
N/A
N/A
15.6
9.1
4.5
1.5
2000
97
66
0.75
0.89
N/A
6.7
19.8
31.1
N/A
N/A
N/A
N/A
N/A
N/A
4.1
1.3
Natural disasters
Type
Metropolitan Government
Miami
Tornado activity compared to U.S. average
169%
63%
Earthquake activity compared to U.S. average
296.3%
1.1%
Natural disasters compared to U.S. average
17%
10%
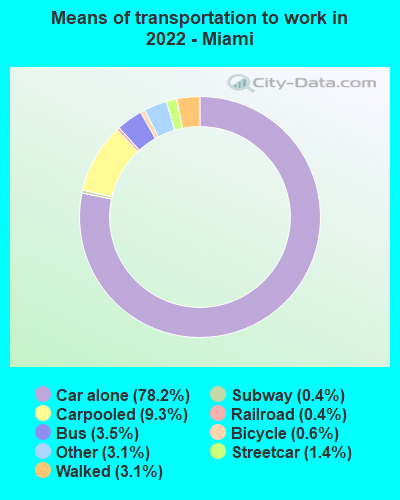
Transportation
Miami offers a more developed public transit system, with Metrorail and Metromover, along with an extensive bus network. Traffic is typically more congested in Miami. On the other hand, Metro Nashville relies heavily on driving as the public transit system is less developed. However, rideshares and some bus services are available.
Transport
Type
Metropolitan Government
Miami
Amtrak stations
0
2
Amtrak stations nearby
1
3
FAA registered aircraft
0
1
FAA registered aircraft manufacturers and dealers
0
159
Means of transportation to work
Type
Metropolitan Government
Miami
Bicycle
0.1%
0.8%
Bus
1.6%
3.8%
Carpooled
13.3%
8.5%
Car alone
78.6%
81.1%
Railroad
0%
0.2%
Streetcar
0%
0.5%
Subway
0%
0.3%
Taxicab
0.1%
0.2%
Walked
2.3%
2.6%
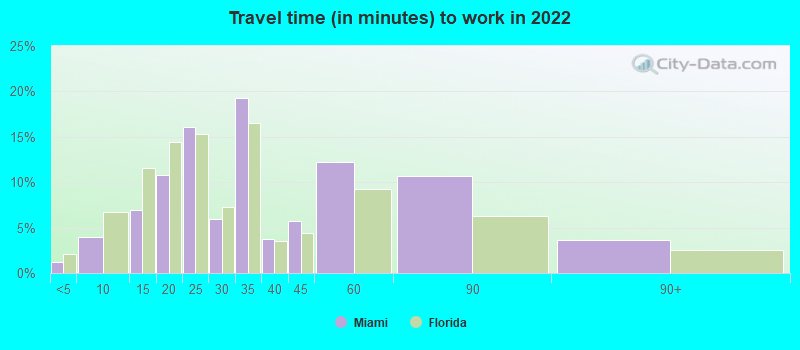
Average travel time to work
Type
Metropolitan Government
Miami
Average
23.7 min
33.7 min
Real Estate
Miami’s real estate is expensive compared to Metro Nashville. Waterfront properties and high-rise condos in Miami are particularly costly. However, Nashville has seen housing prices increase in recent years due to urbanization and popularity among young professionals, but it still offers a more affordable real estate market compared to Miami.
Neighborhoods
Metro Nashville and Miami both boast a variety of unique neighborhoods catering to different lifestyles. In Nashville, among the popular neighborhoods are East Nashville, The Gulch, and Belmont/Hillsboro. Miami, on the other hand, offers lively districts like Miami Beach, Coconut Grove, and Little Havana.
Houses and residents
Type
Metropolitan Government
Miami
Houses
252,977
219,775
Average household size (people)
2.3
2.5
Houses occupied
237,405 (93.8%)
192,219 (87.5%)
Houses occupied by owners
131,384 (55.3%)
58,463 (30.4%)
Houses occupied by renters
106,021 (44.7%)
133,756 (69.6%)
Median rent asked for vacant for-rent units
$1,207
$2,006
Median price asked for vacant for-sale houses and condos
$226,967
$1,201,540
Estimated median house or condo value
$350,700
$411,300
Median number of rooms in apartments
4.2
3.4
Median number of rooms in houses and condos
6.4
5
Housing density (houses/condos per square mile)
503.7
6,160.8
Household income disparities
45.5%
51.3%
Housing units without a mortgage
32,597 (28.1%)
686 (2.1%)
Housing units with both a second mortgage and home equity loan
342 (0.3%)
1,692 (5.1%)
Housing units with a mortgage
83,416 (71.9%)
32,656 (97.9%)
Housing units with a home equity loan
8,009 (6.9%)
36 (0.1%)
Housing units with a second mortgage
9,691 (8.4%)
2,892 (8.7%)
Housing units lacking complete kitchen facilities
0.7%
1.6%
Housing units lacking complete plumbing facilities
Self-employed workers in own not incorporated business
20,090
26,340
State government workers
13,081
3,509
Unpaid family workers
668
695
Industries and Occupations
In terms of industries and occupations, Metro Nashville is primarily known for its healthcare sector, education facilities, and thriving music industry. On the contrary, Miami is mainly characterized by its robust tourism industry, finance sector, and the presence of international corporations doing business across Latin America.
Both cities have accessible healthcare facilities. Nashville is known as the healthcare capital, housing headquarters for numerous healthcare companies. Miami has a dense concentration of hospitals and healthcare facilities, making medical services readily accessible to residents and tourists.
In terms of healthcare quality, both cities provide high standards of medical services. However, healthcare costs in Miami tend to be higher.
Health (county statistics)
Type
Metropolitan Government
Miami
General health status score of residents in this county from 1 (poor) to 5 (excellent)
Miami's infrastructure is more developed given its status as a global city and a hub for international trade. It boasts an international airport, seaport, and an extensive highway system. Metro Nashville, on the other hand, has a smaller but consistently improving infrastructure, with a robust network of highways and Nashville International Airport.
Infrastructure
Type
Metropolitan Government
Miami
TV stations
19
26
Culture and Food
Culturally, both cities are significantly impactful but in different ways. Miami is known for its rich Latin American culture and gastronomy, while Nashville is famous for its influential country music scene and distinctive Southern cuisine.
Sports Teams
Miami boasts several major sports teams, such as the Miami Heat (NBA), Miami Dolphins (NFL), and Miami Marlins (MLB). Nashville, while having fewer teams, is nonetheless passionate about its Nashville Predators (NHL) and Tennessee Titans (NFL).
 Metropolitan Government, TN
 Miami, FL