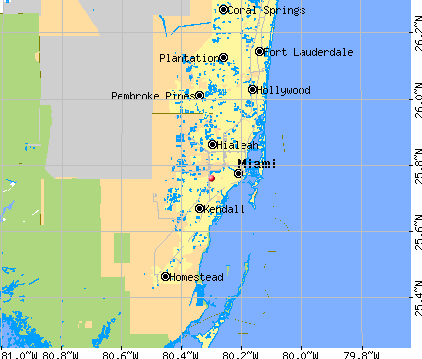
Miami-Dade County, Florida (FL)
County owner-occupied free and clear houses and condos in 2010: 122,951
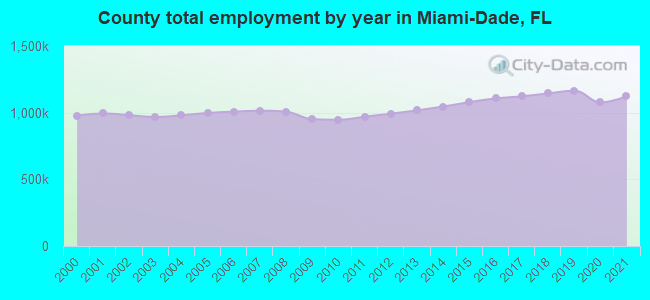
County owner-occupied houses and condos in 2000: 449,333
Renter-occupied apartments: 383,478 (it was 327,441 in 2000)
| % of renters here: | 42% |
| State: | 33% |
Land area: 1946 sq. mi.
Water area: 485.2 sq. mi.
Population density: 1374 people per square mile (very high).
Industries providing employment: Educational, health and social services (20.2%), Professional, scientific, management, administrative, and waste management services (14.3%), Retail trade (10.4%).
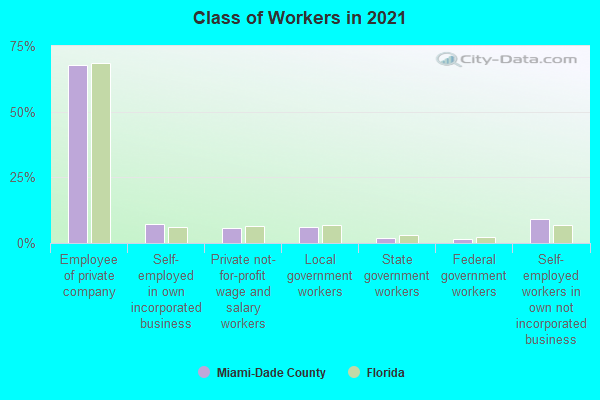
Type of workers:
- Private wage or salary: 81%
- Government: 10%
- Self-employed, not incorporated: 9%
- Unpaid family work: 0%
- OSM Map
- General Map
- Google Map
- MSN Map

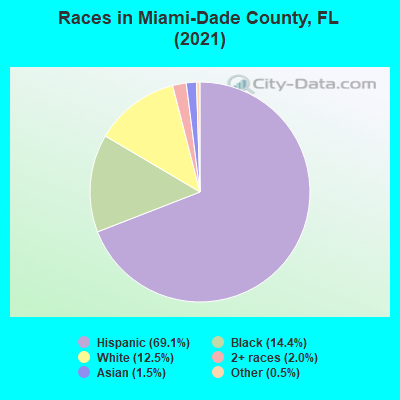
- 1,848,08369.1%Hispanic or Latino
- 382,73314.3%Black Non-Hispanic Alone
- 338,77012.7%White Non-Hispanic Alone
- 50,0691.9%Two or more races
- 39,2081.5%Asian alone
- 12,6890.5%Some other race alone
- 1,5930.06%American Indian and Alaska Native alone
- 6920.03%Native Hawaiian and Other
Pacific Islander alone
| Median resident age: | 40.9 years |
| Florida median age: | 42.7 years |
| Males: 1,314,494 | |
| Females: 1,359,343 |


| Miami-Dade County: | 2.0 people |
| Florida: | 2 people |
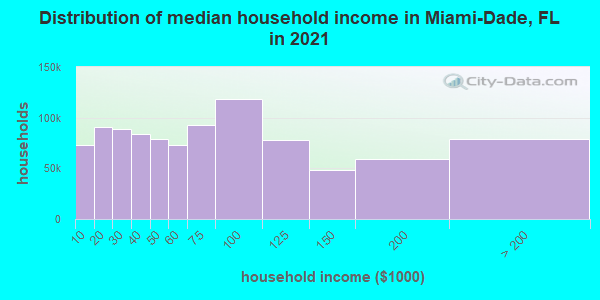
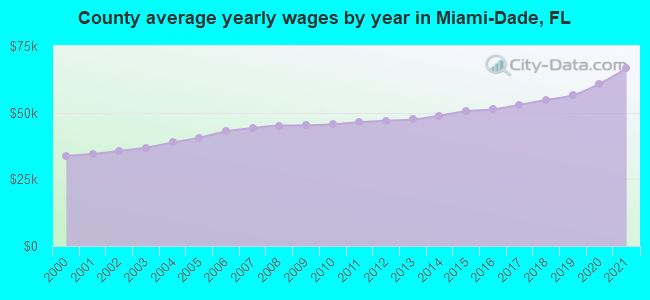
Estimated median household income in 2022: $67,263 ($35,966 in 1999)
| This county: | $67,263 |
| Florida: | $69,303 |
Median contract rent in 2022 for apartments: $1,527 (lower quartile is $1,132, upper quartile is $2,007)
| This county: | $1527 |
| State: | $1367 |
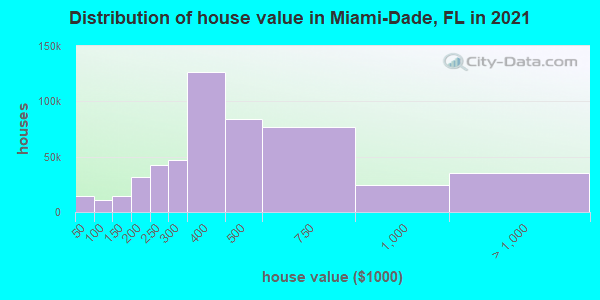
Estimated median house or condo value in 2022: $453,300 (it was $113,200 in 2000)
| Miami-Dade: | $453,300 |
| Florida: | $354,100 |
Mean price in 2022:
Median monthly housing costs for homes and condos with a mortgage: $2,233Detached houses: $666,163
Here: $666,163 State: $500,941 Townhouses or other attached units: $435,342
Here: $435,342 State: $370,869 In 2-unit structures: $480,048
Here: $480,048 State: $423,188 In 3-to-4-unit structures: $325,696
Here: $325,696 State: $309,944 In 5-or-more-unit structures: $554,909
Here: $554,909 State: $447,145 Mobile homes: $128,887
Here: $128,887 State: $113,202 Occupied boats, RVs, vans, etc.: $162,124
Here: $162,124 State: $73,933
Median monthly housing costs for units without a mortgage: $739
Institutionalized population: 20,640
Crime in 2020 (reported by the sheriff's office or county police, not the county total):
- Murders: 113
- Rapes: 410
- Robberies: 967
- Assaults: 4606
- Burglaries: 2400
- Thefts: 21458
- Auto thefts: 3049
Crime in 2019 (reported by the sheriff's office or county police, not the county total):
- Murders: 90
- Rapes: 478
- Robberies: 1294
- Assaults: 3491
- Burglaries: 2869
- Thefts: 25805
- Auto thefts: 3148
Health of residents in Miami-Dade County based on CDC Behavioral Risk Factor Surveillance System Survey Questionnaires from 2013 to 2021:
General health status score of residents in this county from 1 (poor) to 5 (excellent) is 3.5. This is about average.68.5% of residents exercised in the past month. This is less than average.
40.3% of residents smoked 100+ cigarettes in their lives. This is less than average.
54.9% of adult residents drank alcohol in the past 30 days. This is less than average.
69.0% of residents visited a dentist within the past year. This is about average.
Average weight of males is 188 pounds. This is less than average.
Average weight of females is 154 pounds. This is less than average.
Health of residents in Miami-Dade County based on CDC Behavioral Risk Factor Surveillance System Survey Questionnaires from 2003 to 2012:
General health status score of residents in this county from 1 (poor) to 5 (excellent) is 3.4. This is about average.68.3% of residents exercised in the past month. This is less than average.
37.5% of residents smoked 100+ cigarettes in their lives. This is less than average.
70.2% of adult residents drank alcohol in the past 30 days. This is about average.
68.0% of residents visited a dentist within the past year. This is about average.
Average weight of males is 186 pounds. This is less than average.
Average weight of females is 154 pounds. This is less than average.
14.5% of residents keep firearms around their homes. This is less than average.
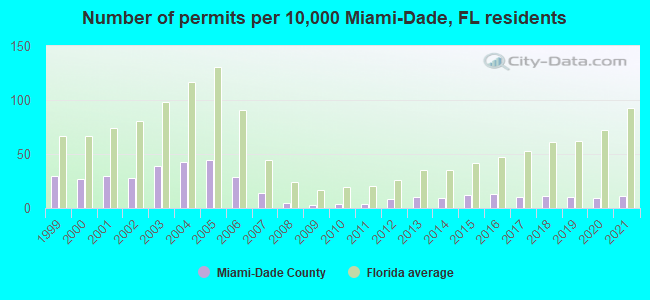
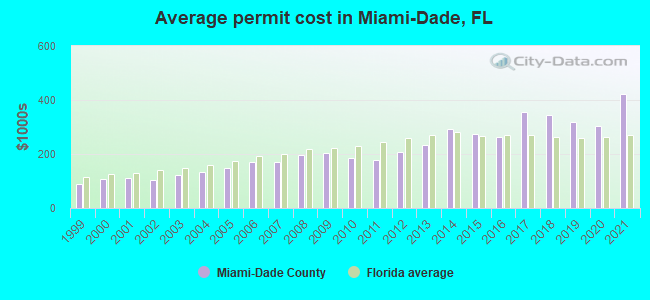
Single-family new house construction building permits:
- 2022: 2445 buildings, average cost: $634,500
- 2021: 2477 buildings, average cost: $423,300
- 2020: 2133 buildings, average cost: $302,600
- 2019: 2343 buildings, average cost: $319,100
- 2018: 2449 buildings, average cost: $343,100
- 2017: 2285 buildings, average cost: $354,800
- 2016: 2873 buildings, average cost: $262,000
- 2015: 2800 buildings, average cost: $274,000
- 2014: 2077 buildings, average cost: $294,000
- 2013: 2266 buildings, average cost: $234,000
- 2012: 1819 buildings, average cost: $206,000
- 2011: 962 buildings, average cost: $176,300
- 2010: 941 buildings, average cost: $185,600
- 2009: 624 buildings, average cost: $202,400
- 2008: 1086 buildings, average cost: $196,700
- 2007: 3246 buildings, average cost: $170,500
- 2006: 6548 buildings, average cost: $169,500
- 2005: 9922 buildings, average cost: $147,000
- 2004: 9603 buildings, average cost: $133,900
- 2003: 8740 buildings, average cost: $120,900
- 2002: 6374 buildings, average cost: $104,400
- 2001: 6828 buildings, average cost: $112,400
- 2000: 5998 buildings, average cost: $106,400
- 1999: 6711 buildings, average cost: $88,600
Median real estate property taxes paid for housing units with mortgages in 2022: $3,985 (0.9%)
Median real estate property taxes paid for housing units with no mortgage in 2022: $3,078 (0.7%)

| Miami-Dade County: | 14.4% |
| Florida: | 12.7% |
Median age of residents in 2022: 40.9 years old
(Males: 39.4 years old, Females: 42.4 years old)
(Median age for: White residents: 36.7 years old, Black residents: 35.9 years old, American Indian residents: 34.6 years old, Asian residents: 40.4 years old, Hispanic or Latino residents: 42.9 years old, Other race residents: 40.2 years old)
Area name: Miami-Fort Lauderdale-Miami Beach, FL MSA
Fair market rent in 2006 for a 1-bedroom apartment in Miami-Dade County is $752 a month.
Fair market rent for a 2-bedroom apartment is $911 a month.
Fair market rent for a 3-bedroom apartment is $1205 a month.
Cities in this county include: Miami, Kendale Lakes-Lindgren Acres, Hialeah, Kendall-Perrine, Northwest Dade, North Westside, South Westside, Miami Beach, Kendall, North Miami.
| Zip Code | City | Certified Residential Database | Mandatory Residential Database | Mandatory Non-Residential Database | |||
|---|---|---|---|---|---|---|---|
| Buildings Measured | Above 4 pCi/L (%) | Buildings Measured | Above 4 pCi/L (%) | Buildings Measured | Above 4 pCi/L (%) | ||
| 33010 | Hialeah | 24 | 0 | 3 | 33 | 3 | 33 |
| 33012 | Hialeah | 11 | 0 | 2 | 0 | 2 | 0 |
| 33013 | Hialeah | 2 | 0 | 3 | 0 | 3 | 0 |
| 33014 | Hialeah | 65 | 42 | - | - | - | - |
| 33015 | Hialeah | 368 | 27 | - | - | - | - |
| 33016 | Hialeah | 24 | 4 | 1 | 0 | 1 | 0 |
| 33018 | Hialeah | 2 | 0 | - | - | - | - |
| 33030 | Homestead | 55 | 24 | 3 | 0 | 3 | 0 |
| 33031 | Homestead | 26 | 42 | - | - | - | - |
| 33032 | Homestead | 30 | 23 | 11 | 18 | 11 | 18 |
| 33033 | Homestead | 29 | 31 | 11 | 0 | 11 | 0 |
| 33034 | Homestead | 10 | 10 | - | - | - | - |
| 33035 | Homestead | 16 | 0 | - | - | - | - |
| 33054 | Opa Locka | 38 | 5 | 9 | 0 | 9 | 0 |
| 33055 | Opa Locka | - | - | 14 | 0 | 14 | 0 |
| 33056 | Opa Locka | 6 | 0 | 5 | 0 | 5 | 0 |
| 33090 | Homestead | - | - | 1 | 0 | 1 | 0 |
| 33107 | Miami | 1 | 0 | - | - | - | - |
| 33111 | Miami | 1 | 0 | - | - | - | - |
| 33122 | Miami | 1 | 0 | - | - | - | - |
| 33125 | Miami | 10 | 0 | 1 | 0 | 1 | 0 |
| 33126 | Miami | 13 | 0 | 4 | 0 | 4 | 0 |
| 33127 | Miami | - | - | 3 | 0 | 3 | 0 |
| 33129 | Miami | 10 | 0 | 1 | 0 | 1 | 0 |
| 33130 | Miami | 3 | 0 | - | - | - | - |
| 33131 | Miami | 6 | 17 | - | - | - | - |
| 33132 | Miami | 1 | 0 | - | - | - | - |
| 33133 | Miami | 129 | 12 | 3 | 0 | 3 | 0 |
| 33134 | Miami | 148 | 5 | 4 | 0 | 4 | 0 |
| 33135 | Miami | 2 | 0 | 11 | 9 | 11 | 9 |
| 33137 | Miami | 13 | 0 | - | - | - | - |
| 33138 | Miami | 61 | 0 | 3 | 0 | 3 | 0 |
| 33139 | Miami Beach | 67 | 0 | 2 | 0 | 2 | 0 |
| 33140 | Miami Beach | 55 | 0 | - | - | - | - |
| 33141 | Miami Beach | 63 | 0 | 1 | 0 | 1 | 0 |
| 33142 | Miami | 1 | 0 | 5 | 0 | 5 | 0 |
| 33143 | Miami | 165 | 12 | - | - | - | - |
| 33144 | Miami | 5 | 20 | 5 | 0 | 5 | 0 |
| 33145 | Miami | 21 | 10 | 5 | 0 | 5 | 0 |
| 33146 | Miami | 141 | 13 | - | - | - | - |
| 33147 | Miami | 4 | 0 | 10 | 0 | 10 | 0 |
| 33149 | Key Biscayne | 36 | 6 | - | - | - | - |
| 33150 | Miami | 1 | 0 | 5 | 0 | 5 | 0 |
| 33153 | Miami | - | - | 1 | 0 | 1 | 0 |
| 33154 | Miami Beach | 25 | 4 | - | - | - | - |
| 33155 | Miami | 61 | 23 | 7 | 14 | 7 | 14 |
| 33156 | Miami | 316 | 14 | - | - | - | - |
| 33157 | Miami | 289 | 10 | 18 | 11 | 18 | 11 |
| 33158 | Miami | 92 | 9 | - | - | - | - |
| 33160 | North Miami Beach | 20 | 5 | 1 | 0 | 1 | 0 |
| 33161 | Miami | 42 | 0 | 9 | 0 | 9 | 0 |
| 33162 | Miami | 26 | 4 | 2 | 0 | 2 | 0 |
| 33165 | Miami | 24 | 0 | 15 | 0 | 15 | 0 |
| 33166 | Miami | 24 | 8 | 1 | 0 | 1 | 0 |
| 33167 | Miami | 43 | 0 | 3 | 0 | 3 | 0 |
| 33168 | Miami | 16 | 6 | 3 | 0 | 3 | 0 |
| 33169 | Miami | 6 | 0 | 6 | 0 | 6 | 0 |
| 33170 | Miami | 10 | 30 | 3 | 0 | 3 | 0 |
| 33172 | Miami | 139 | 25 | - | - | - | - |
| 33173 | Miami | 67 | 22 | 4 | 25 | 4 | 25 |
| 33174 | Miami | 7 | 0 | 3 | 0 | 3 | 0 |
| 33175 | Miami | 23 | 0 | 5 | 0 | 5 | 0 |
| 33176 | Miami | 230 | 16 | 12 | 0 | 12 | 0 |
| 33177 | Miami | 25 | 8 | 8 | 13 | 8 | 13 |
| 33178 | Miami | 160 | 19 | - | - | - | - |
| 33179 | Miami | 39 | 3 | 1 | 0 | 1 | 0 |
| 33180 | Miami | 334 | 20 | 1 | 0 | 1 | 0 |
| 33181 | Miami | 16 | 0 | - | - | - | - |
| 33182 | Miami | 5 | 0 | 2 | 0 | 2 | 0 |
| 33183 | Miami | 51 | 18 | 1 | 0 | 1 | 0 |
| 33184 | Miami | 10 | 0 | - | - | - | - |
| 33185 | Miami | 28 | 4 | - | - | - | - |
| 33186 | Miami | 557 | 35 | 1 | 0 | 1 | 0 |
| 33187 | Miami | 30 | 10 | - | - | - | - |
| 33189 | Miami | 35 | 0 | 2 | 0 | 2 | 0 |
| 33190 | Miami | 8 | 0 | - | - | - | - |
| 33193 | Miami | 35 | 20 | - | - | - | - |
| 33196 | Miami | 224 | 61 | - | - | - | - |
2023 air pollution in Miami-Dade County:
Nitrogen Dioxide: 0.01 ppm (standard limit: 0.053 ppm). Above U.S. average.
Ozone (1-hour): 0.036 ppm (standard limit: 0.12 ppm). Near U.S. average.
Particulate Matter (PM2.5) Annual: 8.6 µg/m3(standard limit: 15.0 µg/m3). Near U.S. average.
Sulfur Oxides Annual: 0.000 ppm (standard limit: 0.03 ppm). Near U.S. average.
Neighboring counties: Honolulu County, Hawaii  .
.
| Here: | 1.6% |
| Florida: | 2.9% |
Current college students: 160,435
People 25 years of age or older with a high school degree or higher: 84.3%
People 25 years of age or older with a bachelor's degree or higher: 34.8%
Number of foreign born residents: 1,451,888 (59.9% naturalized citizens)
| Miami-Dade County: | 54.3% |
| Whole state: | 21.7% |
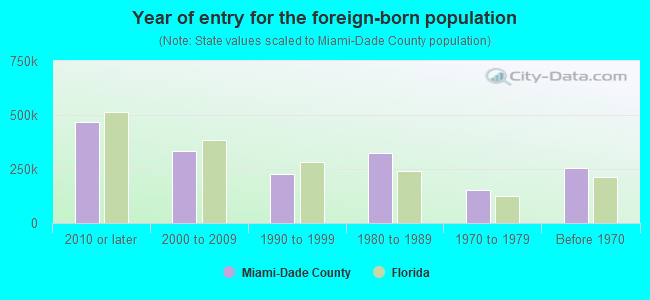
- Year of entry for the foreign-born population
- 557,8482010 or later
- 300,8122000 to 2009
- 214,0511990 to 1999
- 324,9341980 to 1989
- 153,1671970 to 1979
- 253,605Before 1970
Mean travel time to work (commute): minutes
Percentage of county residents living and working in this county: 99.3%
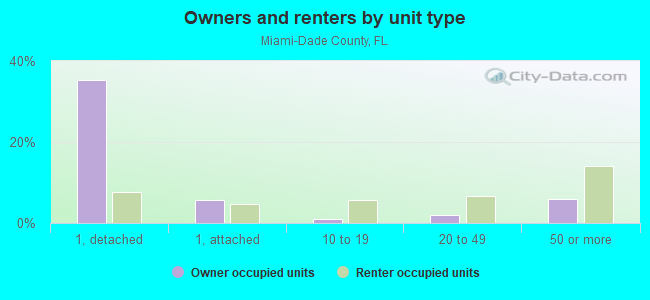
Housing units in structures:
- One, detached: 417,969
- One, attached: 110,431
- Two: 23,322
- 3 or 4: 36,012
- 5 to 9: 55,677
- 10 to 19: 72,832
- 20 to 49: 92,157
- 50 or more: 271,818
- Mobile homes: 14,742
- Boats, RVs, vans, etc.: 550
Housing units in Miami-Dade County with a mortgage: 292,430 (21,507 second mortgage, 615 home equity loan, 17,450 both second mortgage and home equity loan)
Houses without a mortgage: 7,136
| Here: | 97.7% with mortgage |
| State: | 97.6% with mortgage |
Religion statistics for Miami-Dade County
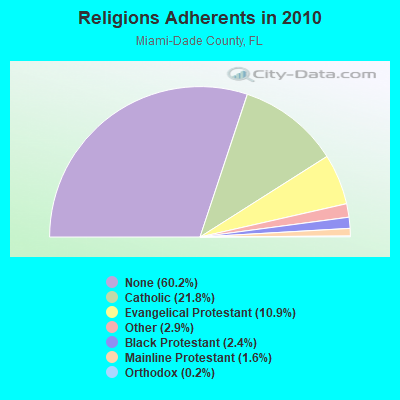
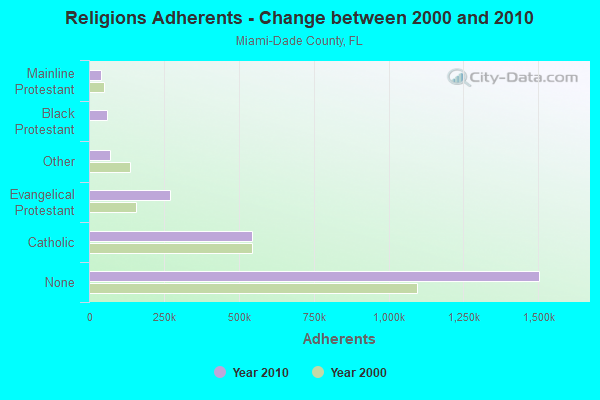
| Religion | Adherents | Congregations |
|---|---|---|
| Catholic | 544,449 | 65 |
| Evangelical Protestant | 271,814 | 922 |
| Other | 71,458 | 200 |
| Black Protestant | 60,074 | 94 |
| Mainline Protestant | 40,287 | 146 |
| Orthodox | 4,440 | 10 |
| None | 1,503,913 | - |
Source: Clifford Grammich, Kirk Hadaway, Richard Houseal, Dale E.Jones, Alexei Krindatch, Richie Stanley and Richard H.Taylor. 2012. 2010 U.S.Religion Census: Religious Congregations & Membership Study. Association of Statisticians of American Religious Bodies. Jones, Dale E., et al. 2002. Congregations and Membership in the United States 2000. Nashville, TN: Glenmary Research Center.
Food Environment Statistics:
| Miami-Dade County: | 2.51 / 10,000 pop. |
| State: | 2.04 / 10,000 pop. |
| Here: | 0.06 / 10,000 pop. |
| Florida: | 0.11 / 10,000 pop. |
| This county: | 1.20 / 10,000 pop. |
| Florida: | 1.28 / 10,000 pop. |
| Miami-Dade County: | 1.98 / 10,000 pop. |
| Florida: | 3.04 / 10,000 pop. |
| This county: | 6.76 / 10,000 pop. |
| State: | 7.45 / 10,000 pop. |
| Miami-Dade County: | 7.9% |
| Florida: | 9.2% |
| Miami-Dade County: | 20.5% |
| State: | 23.7% |
| Here: | 15.8% |
| State: | 14.0% |
Agriculture in Miami-Dade County:
The value of nursery, greenhouse, floriculture, and sod as a percentage of the total market value of agricultural products sold: 0.00%The value of livestock, poultry, and their products as a percentage of the total market value of agricultural products sold: 0.00%
The percentage of farms operated by a family or individual: 0.00%
Average age of principal farm operators: 0 years
Tornado activity:
Miami-Dade County historical area-adjusted tornado activity is significantly below Florida state average. It is 60196101.2 times below overall U.S. average.Tornadoes in this county have caused 20 injuries recorded between 1950 and 2004.
On 11/4/1998, a category 2 (max. wind speeds 113-157 mph) tornado injured 20 people and caused $25 million in damages.
Earthquake activity:
Miami-Dade County-area historical earthquake activity is significantly below Florida state average. It is 99% smaller than the overall U.S. average.On 9/10/2006 at 14:56:08, a magnitude 5.9 (5.9 MB, 5.5 MS, 5.8 MW, Class: Moderate, Intensity: VI - VII) earthquake occurred 394.8 miles away from Miami-Dade County center
On 2/22/1992 at 04:21:34, a magnitude 3.2 (3.2 MB, Depth: 6.2 mi, Class: Light, Intensity: II - III) earthquake occurred 97.2 miles away from the county center
On 6/23/2016 at 17:20:29, a magnitude 3.8 (3.8 ML) earthquake occurred 297.8 miles away from the county center
On 7/16/2016 at 20:00:10, a magnitude 3.7 (3.7 MB) earthquake occurred 282.3 miles away from the county center
On 9/21/2016 at 16:30:52, a magnitude 3.8 (3.8 ML) earthquake occurred 302.6 miles away from Miami-Dade County center
On 9/4/2016 at 18:29:29, a magnitude 3.8 (3.8 ML) earthquake occurred 303.7 miles away from the county center
Magnitude types: body-wave magnitude (MB), local magnitude (ML), surface-wave magnitude (MS), moment magnitude (MW)
Most recent natural disasters:
- Florida Covid-19 Pandemic, Incident Period: January 20, 2020, FEMA Id: 4486, Natural disaster type: Other
- Florida Hurricane Irma, Incident Period: September 4, 2017 - October 18, 2017, FEMA Id: 4337, Natural disaster type: Hurricane
- Florida Hurricane Matthew, Incident Period: October 03, 2016 to October 19, 2016, Emergency Declared EM-3377: October 06, 2016, FEMA Id: 3377, Natural disaster type: Hurricane
- Florida Tropical Storm Fay, Incident Period: August 18, 2008 to September 12, 2008, Emergency Declared EM-3288: August 21, 2008, FEMA Id: 3288, Natural disaster type: Tropical Storm
- Florida Hurricane Wilma, Incident Period: October 23, 2005 to November 18, 2005, Major Disaster (Presidential) Declared DR-1609: October 24, 2005, FEMA Id: 1609, Natural disaster type: Hurricane
- Florida Hurricane Katrina Evacuation, Incident Period: August 29, 2005 to October 01, 2005, Emergency Declared EM-3220: September 05, 2005, FEMA Id: 3220, Natural disaster type: Hurricane
- Florida Hurricane Katrina, Incident Period: August 24, 2005 to September 06, 2005, Major Disaster (Presidential) Declared DR-1602: August 28, 2005, FEMA Id: 1602, Natural disaster type: Hurricane
- Florida Hurricane Frances, Incident Period: September 03, 2004 to October 08, 2004, Major Disaster (Presidential) Declared DR-1545: September 04, 2004, FEMA Id: 1545, Natural disaster type: Hurricane
- Florida Hurricane Charley and Tropical Storm Bonnie, Incident Period: August 11, 2004 to August 30, 2004, Major Disaster (Presidential) Declared DR-1539: August 13, 2004, FEMA Id: 1539, Natural disaster type: Tropical Storm, Hurricane
- Florida Tornado, Incident Period: March 27, 2003, Major Disaster (Presidential) Declared DR-1460: April 25, 2003, FEMA Id: 1460, Natural disaster type: Tornado
The number of natural disasters in Miami-Dade County (10) is smaller than the US average (15).
Major Disasters (Presidential) Declared: 5
Emergencies Declared: 3
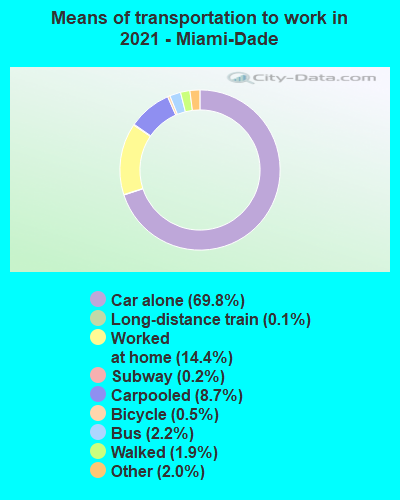
Means of transportation to work:
- Drove a car alone: 951,103 (67.8%)
- Carpooled: 130,280 (9.3%)
- Bus: 32,359 (2.3%)
- Subway or elevated rail: 8,402 (0.6%)
- Long-distance train or commuter rail: 2,352 (0.2%)
- Light rail, streetcar or trolley: 2,432 (0.2%)
- Ferryboat: 105 (0.0%)
- Taxicab, motorcycle, or other means: 36,903 (2.6%)
- Bicycle: 8,285 (0.6%)
- Walked: 27,498 (2.0%)
- Worked at home: 202,679 (14.5%)
- Health care and social assistance (19%)
- Retail trade (9%)
- Educational services (9%)
- Professional, scientific, and technical services (7%)
- Accommodation and food services (7%)
- Other services, except public administration (6%)
- Administrative and support and waste management services (5%)
- Health care and social assistance (22%)
- Retail trade (11%)
- Educational services (10%)
- Professional, scientific, and technical services (8%)
- Accommodation and food services (7%)
- Other services, except public administration (7%)
- Administrative and support and waste management services (6%)
- Management occupations (13%)
- Construction and extraction occupations (12%)
- Sales and related occupations (10%)
- Transportation occupations (9%)
- Office and administrative support occupations (6%)
- Food preparation and serving related occupations (5%)
- Business and financial operations occupations (5%)
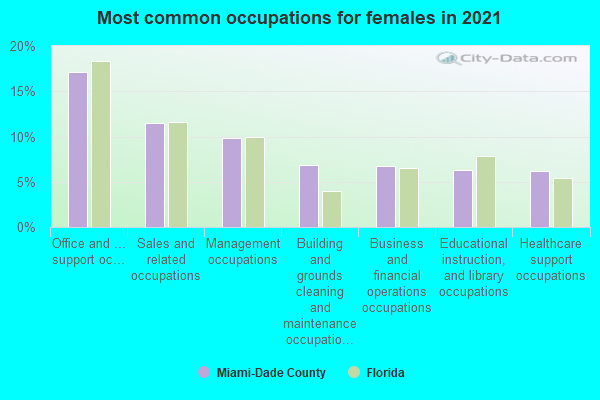
- Office and administrative support occupations (17%)
- Sales and related occupations (11%)
- Management occupations (11%)
- Educational instruction, and library occupations (7%)
- Building and grounds cleaning and maintenance occupations (6%)
- Business and financial operations occupations (6%)
- Health diagnosing and treating practitioners and other technical occupations (6%)
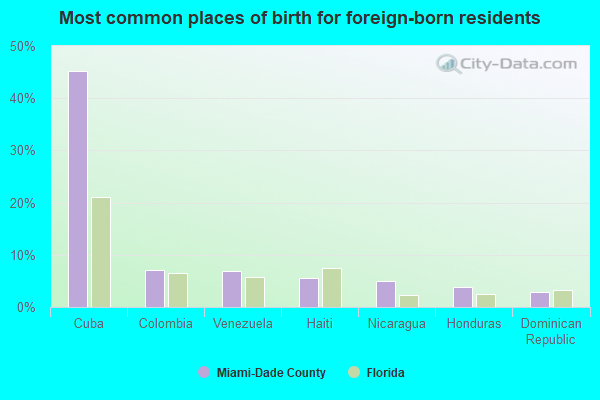
- Cuba (44%)
- Venezuela (8%)
- Colombia (7%)
- Nicaragua (6%)
- Haiti (5%)
- Honduras (3%)
- Dominican Republic (3%)
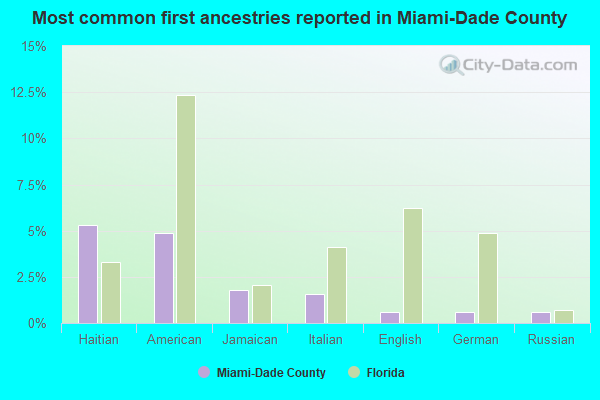
- Haitian (5%)
- American (3%)
- Italian (2%)
- Jamaican (1%)
- English (1%)
- German (1%)
- Brazilian (1%)
People in group quarters in Miami-Dade County, Florida in 2010:
- 10,608 people in college/university student housing
- 6,899 people in nursing facilities/skilled-nursing facilities
- 3,628 people in state prisons
- 3,166 people in local jails and other municipal confinement facilities
- 2,747 people in workers' group living quarters and job corps centers
- 2,393 people in correctional residential facilities
- 2,029 people in group homes intended for adults
- 1,962 people in emergency and transitional shelters (with sleeping facilities) for people experiencing homelessness
- 1,623 people in federal detention centers
- 1,378 people in other noninstitutional facilities
- 1,317 people in federal prisons
- 850 people in mental (psychiatric) hospitals and psychiatric units in other hospitals
- 634 people in residential treatment centers for adults
- 213 people in correctional facilities intended for juveniles
- 203 people in hospitals with patients who have no usual home elsewhere
- 146 people in group homes for juveniles (non-correctional)
- 145 people in residential treatment centers for juveniles (non-correctional)
- 57 people in in-patient hospice facilities
- 37 people in military ships
- 22 people in military barracks and dormitories (nondisciplinary)
People in group quarters in Miami-Dade County, Florida in 2000:
- 10,136 people in nursing homes
- 7,338 people in local jails and other confinement facilities (including police lockups)
- 6,409 people in college dormitories (includes college quarters off campus)
- 5,201 people in other noninstitutional group quarters
- 4,645 people in state prisons
- 3,500 people in federal prisons and detention centers
- 1,459 people in other group homes
- 1,145 people in mental (psychiatric) hospitals or wards
- 967 people in wards in general hospitals for patients who have no usual home elsewhere
- 749 people in schools, hospitals, or wards for the intellectually disabled
- 572 people in other nonhousehold living situations
- 506 people in hospitals/wards and hospices for chronically ill
- 458 people in homes for the mentally ill
- 445 people in other hospitals or wards for chronically ill
- 438 people in agriculture workers' dormitories on farms
- 393 people in homes or halfway houses for drug/alcohol abuse
- 376 people in homes for the mentally retarded
- 369 people in religious group quarters
- 270 people in military barracks, etc.
- 219 people in homes for the physically handicapped
- 201 people in hospitals or wards for drug/alcohol abuse
- 160 people in job corps and vocational training facilities
- 105 people in halfway houses
- 96 people in other types of correctional institutions
- 83 people in unknown juvenile institutions
- 56 people in homes for abused, dependent, and neglected children
- 48 people in hospices or homes for chronically ill
- 46 people in military ships
- 26 people in training schools for juvenile delinquents
- 24 people in orthopedic wards and institutions for the physically handicapped
- 19 people in military transient quarters for temporary residents
- 13 people in military hospitals or wards for chronically ill
- 5 people in other workers' dormitories
4.04% of this county's 2021 resident taxpayers lived in other counties in 2020 ($229,296 average adjusted gross income)
| Here: | 4.04% |
| Florida average: | 8.80% |
0.03% of residents moved from foreign countries ($357 average AGI)
Miami-Dade County: 0.03% Florida average: 0.05%
1.74% relocated from other counties in Florida ($30,203 average AGI)
2.28% relocated from other states ($198,736 average AGI)
Miami-Dade County: 2.28% Florida average: 4.38%
Top counties from which taxpayers relocated into this county between 2020 and 2021:
| from Broward County, FL | |
| from New York County, NY | |
| from Palm Beach County, FL | |
| from Los Angeles County, CA | |
| from Kings County, NY | |
| from Orange County, FL | |
| from Hillsborough County, FL |
5.24% of this county's 2020 resident taxpayers moved to other counties in 2021 ($66,399 average adjusted gross income)
| Here: | 5.24% |
| Florida average: | 7.45% |
0.03% of residents moved to foreign countries ($505 average AGI)
Miami-Dade County: 0.03% Florida average: 0.04%
3.30% relocated to other counties in Florida ($38,726 average AGI)
1.91% relocated to other states ($27,169 average AGI)
Miami-Dade County: 1.91% Florida average: 2.97%
Top counties to which taxpayers relocated from this county between 2020 and 2021:
| to Broward County, FL | |
| to Palm Beach County, FL | |
| to Lee County, FL | |
| to Orange County, FL | |
| to Hillsborough County, FL | |
| to Collier County, FL | |
| to Harris County, TX |
Births per 1000 population from 1990 to 1999: 15.7
Births per 1000 population from 2000 to 2009: 13.9
Births per 1000 population from 2010 to 2022: 9.9
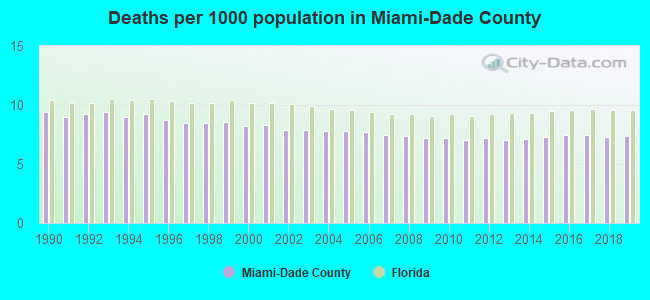
Deaths per 1000 population from 1990 to 1999: 8.9
Deaths per 1000 population from 2000 to 2009: 7.8
Deaths per 1000 population from 2010 to 2020: 7.5
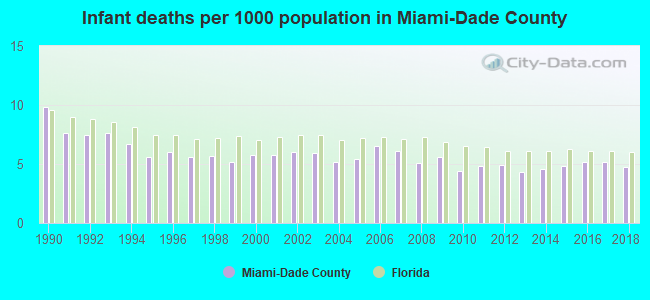
Infant deaths per 1000 live births from 1990 to 1999: 6.7
Infant deaths per 1000 live births from 2000 to 2009: 5.7
Infant deaths per 1000 live births from 2010 to 2021: 4.7
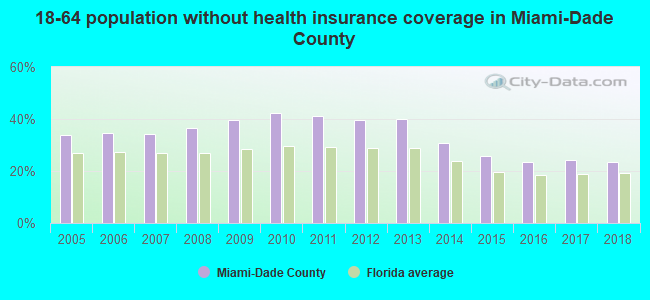
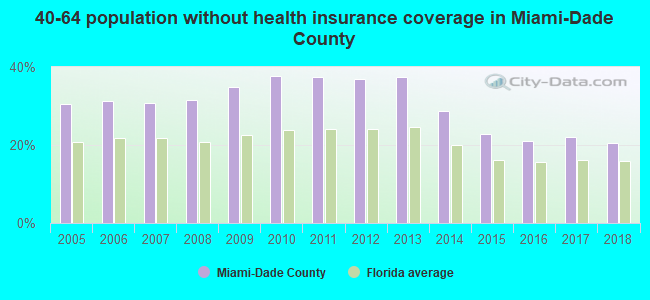
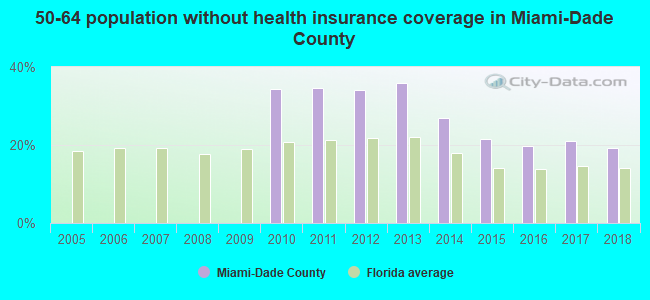
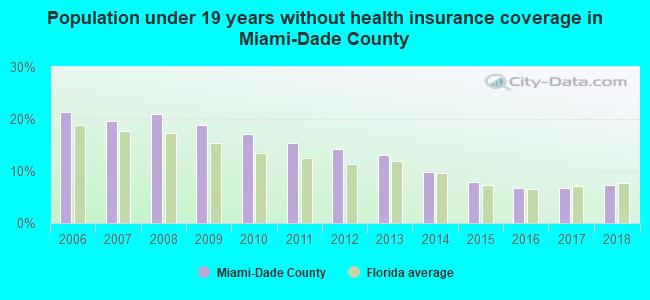
Persons under 19 years old without health insurance coverage in 2018: 7.3%
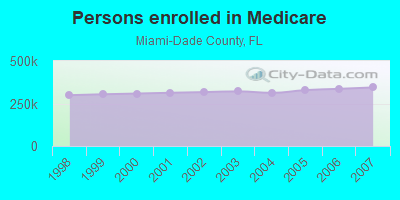
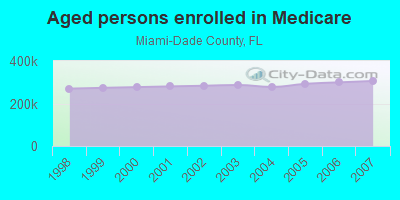
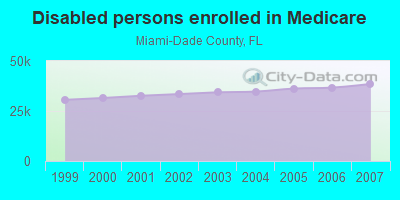
Persons enrolled in hospital insurance and/or supplemental medical insurance (Medicare) in July 1, 2007: 344,480 (305,941 aged, 38,539 disabled)
Children under 18 without health insurance coverage in 2007: 98,275 (18%)
Most common underlying causes of death in Miami-Dade County, Florida in 1999 - 2019:
- Atherosclerotic heart disease (43,244)
- Acute myocardial infarction, unspecified (27,388)
- Bronchus or lung, unspecified - Malignant neoplasms (18,496)
- Chronic obstructive pulmonary disease, unspecified (12,750)
- Alzheimer disease, unspecified (12,079)
- Unspecified dementia (10,248)
- Stroke, not specified as haemorrhage or infarction (8,666)
- Colon, unspecified - Malignant neoplasms (8,235)
- Unspecified diabetes mellitus, without complications (7,002)
- Breast, unspecified - Malignant neoplasms (6,634)
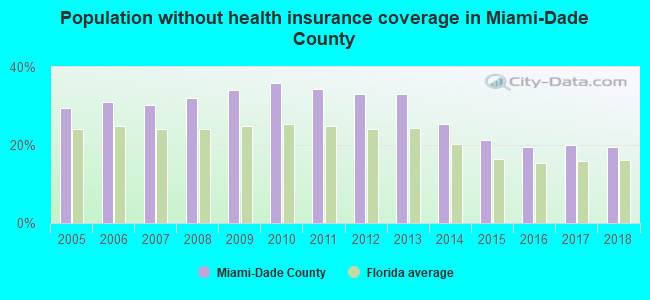
Population without health insurance coverage in 2000: 21%
Children under 18 without health insurance coverage in 2000: 22%
Short term general hospital admissions per 100,000 population in 2004: 13,799
Short term general hospital beds per 100,000 population in 2004: 352
Emergency room visits per 100,000 population in 2004: 29,408
General practice office based MDs per 100,000 population in 2005: 1,443
Medical specialist MDs per 100,000 population in 2005: 800
Dentists per 100,000 population in 1998: 7
Total births per 100,000 population, July 2005 - July 2006 : 50
Total deaths per 100,000 population, July 2005 - July 2006: 78
Limited-service eating places per 100,000 population in 2005 : 9
Fitness & recreation sports centers per 100,000 population in 2005: 13,041
EPA green book nonattainment status in 2004-2006: 1
Crimes per 100,000 population in 1996: 1
Homicides per 1,000,000 population from 2000 to 2006: 88.3. This is more than state average.
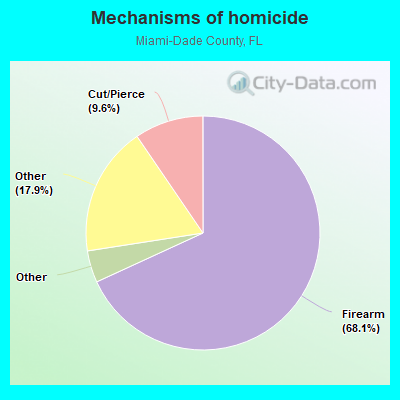
- Firearm - 60.1
- Cut/Pierce - 8.4
- Suffocation - 2.6
- Struck by/against - 1.3
- Other - 15.8
Suicides per 1,000,000 population from 2000 to 2006: 87.7. This is less than state average.
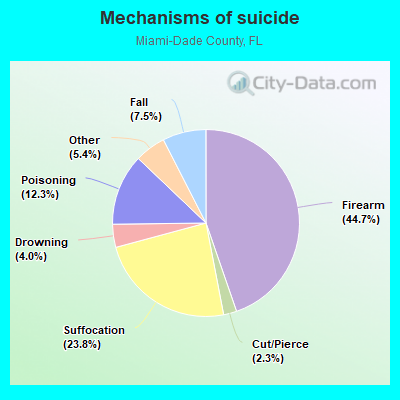
- Firearm - 39.2
- Suffocation - 20.9
- Poisoning - 10.8
- Fall - 6.6
- Drowning - 3.5
- Cut/Pierce - 2.0
- Other - 4.7
Household type by relationship:
Households: 2,673,837- Male householders: 489,007 (120,751 living alone), Female householders: 494,502 (136,883 living alone)
404,792 spouses (395,930 opposite-sex spouses), 94,233 unmarried partners, (89,175 opposite-sex unmarried partners), 738,867 children (703,046 natural, 10,485 adopted, 25,336 stepchildren), 71,830 grandchildren, 49,395 brothers or sisters, 94,487 parents, 1,656 foster children, 101,346 other relatives, 90,540 non-relatives
- In group quarters: 43,182
Size of family households: 235,964 2-persons, 176,747 3-persons, 144,091 4-persons, 60,698 5-persons, 26,048 6-persons, 15,065 7-or-more-persons.
Size of nonfamily households: 257,634 1-person, 56,826 2-persons, 6,379 3-persons, 2,483 4-persons, 824 5-persons, 127 6-persons, 623 7-or-more-persons.
273,834 married couples with children.
173,692 single-parent households (43,852 men, 129,840 women).
25.0% of residents of Miami-Dade speak English at home.
66.2% of residents speak Spanish at home (52% speak English very well, 17% speak English well, 17% speak English not well, 14% don't speak English at all).
7.2% of residents speak other Indo-European language at home (69% speak English very well, 19% speak English well, 9% speak English not well, 2% don't speak English at all).
1.0% of residents speak Asian or Pacific Island language at home (67% speak English very well, 18% speak English well, 13% speak English not well, 2% don't speak English at all).
0.5% of residents speak other language at home (79% speak English very well, 17% speak English well, 3% speak English not well, 1% don't speak English at all).
In fiscal year 2004:
Federal Government expenditure: $15,597,387,000 ($6,599 per capita)
Department of Defense expenditure: $541,594,000
Federal direct payments to individuals for retirement and disability: $4,040,550,000
Federal other direct payments to individuals: $4,546,903,000
Federal direct payments not to individuals: $59,639,000
Federal grants: $4,864,730,000
Federal procurement contracts: $671,878,000 ($286,872,000 Department of Defense)
Federal salaries and wages: $1,413,687,000 ($153,574,000 Department of Defense)
Federal Government direct loans: $38,270,000
Federal guaranteed/insured loans: $982,761,000
Federal Government insurance: $57,419,070,000
Population change from April 1, 2000 to July 1, 2005:
Births: 176,141| Here: | 74 per 1000 residents |
| State: | 63 per 1000 residents |
Deaths: 90,783
| Here: | 38 per 1000 residents |
| State: | 49 per 1000 residents |
Net international migration: +208,877
| Here: | +88 per 1000 residents |
| State: | +30 per 1000 residents |
Net internal migration: -168,493
| Here: | |
| State: |
Total withdrawal of fresh water for public supply: 394.29 millions of gallons per day (all from ground)
| Here: | 5.5 |
| State: | 5.9 |
| Here: | 3.8 |
| State: | 4.2 |
- Year house built in Miami-Dade County, Florida
- 19,1462020 or later
- 108,1862010 to 2019
- 146,6742000 to 2009
- 114,9251990 to 1999
- 174,3011980 to 1989
- 178,4821970 to 1979
- 130,4631960 to 1969
- 137,1351950 to 1959
- 53,3231940 to 1949
- 32,8751939 or earlier
- Rooms in owner-occupied houses in Miami-Dade County, Florida
- 8,7731 room
- 8,0462 rooms
- 42,0713 rooms
- 86,7704 rooms
- 104,1525 rooms
- 110,8556 rooms
- 64,9187 rooms
- 42,8298 rooms
- 39,4659+ rooms
- Rooms in renter-occupied apartments in Miami-Dade County, Florida
- 40,0841 room
- 48,1592 rooms
- 115,9053 rooms
- 133,9864 rooms
- 74,7975 rooms
- 37,9206 rooms
- 15,2037 rooms
- 5,6648 rooms
- 3,9129+ rooms
- Bedrooms in owner-occupied houses in Miami-Dade County, Florida
- 9,755no bedroom
- 24,6911 bedroom
- 114,5942 bedrooms
- 223,6713 bedrooms
- 109,0364 bedrooms
- 26,1325+ bedrooms
- Bedrooms in renter-occupied apartments in Miami-Dade County, Florida
- 42,326no bedroom
- 137,7261 bedroom
- 187,9412 bedrooms
- 85,8553 bedrooms
- 19,4134 bedrooms
- 2,3695+ bedrooms
- Cars and other vehicles available in Miami-Dade County in owner-occupied houses/condos
- 24,201no vehicle
- 160,8091 vehicle
- 203,8562 vehicles
- 81,6563 vehicles
- 28,0774 vehicles
- 9,2805+ vehicles

- Cars and other vehicles available in Miami-Dade County in renter-occupied apartments
- 72,430no vehicle
- 224,8461 vehicle
- 138,8312 vehicles
- 29,9093 vehicles
- 7,8264 vehicles
- 1,7885+ vehicles
88.2% of Miami-Dade County residents lived in the same house 1 years ago.
Out of people who lived in different houses, 42% lived in this county.
Out of people who lived in different counties, 38% lived in Florida.
| Miami-Dade County: | 88.2% |
| State average: | 86.3% |
Place of birth for U.S.-born residents:
- This state: 845,813
- Other state: 290,111
- Northeast: 146,446
- Midwest: 43,354
- South: 70,106
- West: 30,205
- 89.3%Electricity
- 5.8%No fuel used
- 3.7%Utility gas
- 0.8%Bottled, tank, or LP gas
- 0.2%Solar energy
- 0.2%Fuel oil, kerosene, etc.
- 91.1%Electricity
- 4.8%No fuel used
- 3.4%Utility gas
- 0.4%Bottled, tank, or LP gas
- 0.2%Fuel oil, kerosene, etc.
Private vs. public school enrollment:
| Here: | 16.5% |
| Florida: | 15.8% |
| Here: | 14.2% |
| Florida: | 12.9% |
| Here: | 27.3% |
| Florida: | 23.6% |

Miami-Dade County government finances - Expenditure in 2018:
- Bond Funds - Cash and Securities: $925,703,000
Cash and Securities: $822,896,000
- Charges - Hospital Public: $1,561,013,000
Hospital Public: $1,421,639,000
Air Transportation: $820,562,000
Air Transportation: $804,724,000
Other: $643,544,000
Other: $459,672,000
Sewerage: $400,427,000
Sewerage: $391,287,000
Solid Waste Management: $271,447,000
Solid Waste Management: $269,679,000
Sea and Inland Port Facilities: $166,756,000
Sea and Inland Port Facilities: $165,592,000
Housing and Community Development: $77,524,000
Housing and Community Development: $66,054,000
Parks and Recreation: $65,161,000
Parks and Recreation: $59,109,000
Natural Resources - Other: $35,995,000
Natural Resources - Other: $35,561,000
Toll Highways: $17,479,000
Toll Highways: $13,827,000
Parking Facilities: $3,649,000
Parking Facilities: $3,617,000
Regular Highways: $2,169,000
Regular Highways: $73,000
- Construction - Water Utilities: $219,250,000
Sewerage: $218,250,000
Sewerage: $199,000,000
Water Utilities: $199,000,000
Sea and Inland Port Facilities: $173,265,000
Air Transportation: $165,185,000
Air Transportation: $98,040,000
Regular Highways: $62,212,000
Regular Highways: $58,944,000
Sea and Inland Port Facilities: $51,895,000
Solid Waste Management: $40,280,000
Parks and Recreation: $23,429,000
Parks and Recreation: $23,235,000
Solid Waste Management: $9,998,000
- Current Operations - Hospitals: $2,256,292,000
Hospitals: $1,958,698,000
Police Protection: $724,041,000
Police Protection: $660,074,000
Transit Utilities: $641,115,000
Transit Utilities: $555,862,000
Air Transportation: $500,363,000
Local Fire Protection: $464,884,000
Air Transportation: $437,358,000
Local Fire Protection: $412,689,000
Public Welfare - Other: $393,899,000
Public Welfare - Other: $361,873,000
Correctional Institutions: $359,147,000
Housing and Community Development: $355,328,000
Correctional Institutions: $338,788,000
Housing and Community Development: $330,706,000
Parks and Recreation: $295,983,000
Parks and Recreation: $280,138,000
Solid Waste Management: $249,934,000
Solid Waste Management: $249,475,000
Sewerage: $243,840,000
Sewerage: $219,730,000
Water Utilities: $198,384,000
General - Other: $190,356,000
Water Utilities: $178,799,000
Financial Administration: $168,457,000
General - Other: $151,778,000
Financial Administration: $122,233,000
Judicial and Legal Services: $120,684,000
Toll Highways: $115,488,000
Judicial and Legal Services: $114,175,000
Toll Highways: $110,172,000
Natural Resources - Other: $94,896,000
Natural Resources - Other: $92,813,000
Sea and Inland Port Facilities: $85,840,000
Sea and Inland Port Facilities: $79,574,000
Regular Highways: $69,784,000
Libraries: $65,989,000
Health - Other: $54,959,000
Libraries: $53,699,000
Central Staff Services: $53,250,000
Health - Other: $47,882,000
Regular Highways: $43,051,000
Public Welfare, Vendor Payments for Medical Care: $36,636,000
Central Staff Services: $25,035,000
Public Welfare, Vendor Payments for Medical Care: $24,862,000
General Public Buildings: $9,429,000
General Public Buildings: $8,893,000
Protective Inspection and Regulation - Other: $1,632,000
Protective Inspection and Regulation - Other: $701,000
- Federal Intergovernmental - Housing and Community Development: $275,385,000
Housing and Community Development: $246,771,000
Other: $214,813,000
Transit Utilities: $155,657,000
Public Welfare: $148,796,000
Transit Utilities: $147,218,000
Public Welfare: $135,300,000
Highways: $124,114,000
Highways: $104,007,000
Other: $40,448,000
General Local Government Support: $958,000
General Local Government Support: $918,000
- General - Interest on Debt: $564,185,000
Interest on Debt: $551,038,000
- Local Intergovernmental - Other: $197,270,000
Other: $86,684,000
- Long Term Debt - Outstanding Unspecified Public Purpose: $16,386,113,000
Beginning Outstanding - Unspecified Public Purpose: $15,812,584,000
Beginning Outstanding - Unspecified Public Purpose: $15,526,287,000
Outstanding Unspecified Public Purpose: $15,304,184,000
Beginning Outstanding - Public Debt for Private Purpose: $2,243,583,000
Beginning Outstanding - Public Debt for Private Purpose: $2,239,884,000
Outstanding Nonguaranteed - Industrial Revenue: $2,206,818,000
Outstanding Nonguaranteed - Industrial Revenue: $2,125,280,000
Issue, Unspecified Public Purpose: $1,977,670,000
Retired Unspecified Public Purpose: $1,642,544,000
Retired Unspecified Public Purpose: $1,404,141,000
Issue, Unspecified Public Purpose: $1,213,441,000
Retired Nonguaranteed - Public Debt for Private Purpose: $154,814,000
Issue, Nonguaranteed - Public Debt for Private Purpose: $118,049,000
Retired Nonguaranteed - Public Debt for Private Purpose: $115,604,000
- Miscellaneous - General Revenue - Other: $308,001,000
Interest Earnings: $266,224,000
General Revenue - Other: $253,421,000
Interest Earnings: $240,271,000
Special Assessments: $166,067,000
Special Assessments: $144,411,000
Fines and Forfeits: $51,562,000
Fines and Forfeits: $49,487,000
Donations From Private Sources: $21,200,000
Rents: $15,079,000
Donations From Private Sources: $13,844,000
Rents: $12,566,000
Sale of Property: $83,000
Sale of Property: $46,000
- Other Capital Outlay - General - Other: $45,590,000
General - Other: $28,264,000
Police Protection: $18,169,000
Natural Resources - Other: $17,867,000
Local Fire Protection: $15,447,000
Local Fire Protection: $14,671,000
Natural Resources - Other: $13,262,000
Police Protection: $12,443,000
Libraries: $7,409,000
Housing and Community Development: $7,081,000
Libraries: $5,465,000
Correctional Institutions: $4,660,000
Judicial and Legal Services: $4,156,000
Correctional Institutions: $2,958,000
Housing and Community Development: $2,342,000
Financial Administration: $1,957,000
Health - Other: $1,861,000
Health - Other: $1,723,000
Financial Administration: $1,383,000
Hospitals: $588,000
Judicial and Legal Services: $225,000
Central Staff Services: $75,000
- Other Funds - Cash and Securities: $4,545,989,000
Cash and Securities: $4,380,640,000
- Revenue - Water Utilities: $334,023,000
Water Utilities: $316,045,000
Transit Utilities: $100,359,000
Transit Utilities: $95,230,000
- Sinking Funds - Cash and Securities: $3,151,393,000
Cash and Securities: $2,692,056,000
- State Intergovernmental - General Local Government Support: $292,983,000
General Local Government Support: $274,194,000
Other: $71,313,000
Other: $56,551,000
Transit Utilities: $50,224,000
Transit Utilities: $37,469,000
Highways: $31,922,000
Highways: $31,391,000
Housing and Community Development: $7,439,000
Public Welfare: $3,220,000
Public Welfare: $2,374,000
Housing and Community Development: $1,438,000
Health and Hospitals: $447,000
Health and Hospitals: $447,000
- Tax - Property: $2,023,310,000
Property: $1,725,444,000
General Sales and Gross Receipts: $605,749,000
General Sales and Gross Receipts: $551,589,000
Public Utilities Sales: $125,891,000
Public Utilities Sales: $124,965,000
Public Utility License: $99,982,000
Other License: $94,331,000
Motor Fuels Sales: $80,636,000
Motor Fuels Sales: $79,766,000
Other License: $79,210,000
Occupation and Business License - Other: $37,716,000
Occupation and Business License - Other: $30,919,000
Other: $9,790,000
Other: $9,688,000
- Total Salaries and Wages: $659,000
: $570,000
- Water Utilities - Interest on Debt: $111,875,000
Interest on Debt: $25,978,000
Miami-Dade County government finances - Revenue in 2018:
- Bond Funds - Cash and Securities: $925,703,000
Cash and Securities: $822,896,000
- Charges - Hospital Public: $1,561,013,000
Hospital Public: $1,421,639,000
Air Transportation: $820,562,000
Air Transportation: $804,724,000
Other: $643,544,000
Other: $459,672,000
Sewerage: $400,427,000
Sewerage: $391,287,000
Solid Waste Management: $271,447,000
Solid Waste Management: $269,679,000
Sea and Inland Port Facilities: $166,756,000
Sea and Inland Port Facilities: $165,592,000
Housing and Community Development: $77,524,000
Housing and Community Development: $66,054,000
Parks and Recreation: $65,161,000
Parks and Recreation: $59,109,000
Natural Resources - Other: $35,995,000
Natural Resources - Other: $35,561,000
Toll Highways: $17,479,000
Toll Highways: $13,827,000
Parking Facilities: $3,649,000
Parking Facilities: $3,617,000
Regular Highways: $2,169,000
Regular Highways: $73,000
- Construction - Water Utilities: $219,250,000
Sewerage: $218,250,000
Sewerage: $199,000,000
Water Utilities: $199,000,000
Sea and Inland Port Facilities: $173,265,000
Air Transportation: $165,185,000
Air Transportation: $98,040,000
Regular Highways: $62,212,000
Regular Highways: $58,944,000
Sea and Inland Port Facilities: $51,895,000
Solid Waste Management: $40,280,000
Parks and Recreation: $23,429,000
Parks and Recreation: $23,235,000
Solid Waste Management: $9,998,000
- Current Operations - Hospitals: $2,256,292,000
Hospitals: $1,958,698,000
Police Protection: $724,041,000
Police Protection: $660,074,000
Transit Utilities: $641,115,000
Transit Utilities: $555,862,000
Air Transportation: $500,363,000
Local Fire Protection: $464,884,000
Air Transportation: $437,358,000
Local Fire Protection: $412,689,000
Public Welfare - Other: $393,899,000
Public Welfare - Other: $361,873,000
Correctional Institutions: $359,147,000
Housing and Community Development: $355,328,000
Correctional Institutions: $338,788,000
Housing and Community Development: $330,706,000
Parks and Recreation: $295,983,000
Parks and Recreation: $280,138,000
Solid Waste Management: $249,934,000
Solid Waste Management: $249,475,000
Sewerage: $243,840,000
Sewerage: $219,730,000
Water Utilities: $198,384,000
General - Other: $190,356,000
Water Utilities: $178,799,000
Financial Administration: $168,457,000
General - Other: $151,778,000
Financial Administration: $122,233,000
Judicial and Legal Services: $120,684,000
Toll Highways: $115,488,000
Judicial and Legal Services: $114,175,000
Toll Highways: $110,172,000
Natural Resources - Other: $94,896,000
Natural Resources - Other: $92,813,000
Sea and Inland Port Facilities: $85,840,000
Sea and Inland Port Facilities: $79,574,000
Regular Highways: $69,784,000
Libraries: $65,989,000
Health - Other: $54,959,000
Libraries: $53,699,000
Central Staff Services: $53,250,000
Health - Other: $47,882,000
Regular Highways: $43,051,000
Public Welfare, Vendor Payments for Medical Care: $36,636,000
Central Staff Services: $25,035,000
Public Welfare, Vendor Payments for Medical Care: $24,862,000
General Public Buildings: $9,429,000
General Public Buildings: $8,893,000
Protective Inspection and Regulation - Other: $1,632,000
Protective Inspection and Regulation - Other: $701,000
- Federal Intergovernmental - Housing and Community Development: $275,385,000
Housing and Community Development: $246,771,000
Other: $214,813,000
Transit Utilities: $155,657,000
Public Welfare: $148,796,000
Transit Utilities: $147,218,000
Public Welfare: $135,300,000
Highways: $124,114,000
Highways: $104,007,000
Other: $40,448,000
General Local Government Support: $958,000
General Local Government Support: $918,000
- General - Interest on Debt: $564,185,000
Interest on Debt: $551,038,000
- Local Intergovernmental - Other: $197,270,000
Other: $86,684,000
- Long Term Debt - Outstanding Unspecified Public Purpose: $16,386,113,000
Beginning Outstanding - Unspecified Public Purpose: $15,812,584,000
Beginning Outstanding - Unspecified Public Purpose: $15,526,287,000
Outstanding Unspecified Public Purpose: $15,304,184,000
Beginning Outstanding - Public Debt for Private Purpose: $2,243,583,000
Beginning Outstanding - Public Debt for Private Purpose: $2,239,884,000
Outstanding Nonguaranteed - Industrial Revenue: $2,206,818,000
Outstanding Nonguaranteed - Industrial Revenue: $2,125,280,000
Issue, Unspecified Public Purpose: $1,977,670,000
Retired Unspecified Public Purpose: $1,642,544,000
Retired Unspecified Public Purpose: $1,404,141,000
Issue, Unspecified Public Purpose: $1,213,441,000
Retired Nonguaranteed - Public Debt for Private Purpose: $154,814,000
Issue, Nonguaranteed - Public Debt for Private Purpose: $118,049,000
Retired Nonguaranteed - Public Debt for Private Purpose: $115,604,000
- Miscellaneous - General Revenue - Other: $308,001,000
Interest Earnings: $266,224,000
General Revenue - Other: $253,421,000
Interest Earnings: $240,271,000
Special Assessments: $166,067,000
Special Assessments: $144,411,000
Fines and Forfeits: $51,562,000
Fines and Forfeits: $49,487,000
Donations From Private Sources: $21,200,000
Rents: $15,079,000
Donations From Private Sources: $13,844,000
Rents: $12,566,000
Sale of Property: $83,000
Sale of Property: $46,000
- Other Capital Outlay - General - Other: $45,590,000
General - Other: $28,264,000
Police Protection: $18,169,000
Natural Resources - Other: $17,867,000
Local Fire Protection: $15,447,000
Local Fire Protection: $14,671,000
Natural Resources - Other: $13,262,000
Police Protection: $12,443,000
Libraries: $7,409,000
Housing and Community Development: $7,081,000
Libraries: $5,465,000
Correctional Institutions: $4,660,000
Judicial and Legal Services: $4,156,000
Correctional Institutions: $2,958,000
Housing and Community Development: $2,342,000
Financial Administration: $1,957,000
Health - Other: $1,861,000
Health - Other: $1,723,000
Financial Administration: $1,383,000
Hospitals: $588,000
Judicial and Legal Services: $225,000
Central Staff Services: $75,000
- Other Funds - Cash and Securities: $4,545,989,000
Cash and Securities: $4,380,640,000
- Revenue - Water Utilities: $334,023,000
Water Utilities: $316,045,000
Transit Utilities: $100,359,000
Transit Utilities: $95,230,000
- Sinking Funds - Cash and Securities: $3,151,393,000
Cash and Securities: $2,692,056,000
- State Intergovernmental - General Local Government Support: $292,983,000
General Local Government Support: $274,194,000
Other: $71,313,000
Other: $56,551,000
Transit Utilities: $50,224,000
Transit Utilities: $37,469,000
Highways: $31,922,000
Highways: $31,391,000
Housing and Community Development: $7,439,000
Public Welfare: $3,220,000
Public Welfare: $2,374,000
Housing and Community Development: $1,438,000
Health and Hospitals: $447,000
Health and Hospitals: $447,000
- Tax - Property: $2,023,310,000
Property: $1,725,444,000
General Sales and Gross Receipts: $605,749,000
General Sales and Gross Receipts: $551,589,000
Public Utilities Sales: $125,891,000
Public Utilities Sales: $124,965,000
Public Utility License: $99,982,000
Other License: $94,331,000
Motor Fuels Sales: $80,636,000
Motor Fuels Sales: $79,766,000
Other License: $79,210,000
Occupation and Business License - Other: $37,716,000
Occupation and Business License - Other: $30,919,000
Other: $9,790,000
Other: $9,688,000
- Total Salaries and Wages: $659,000
: $570,000
- Water Utilities - Interest on Debt: $111,875,000
Interest on Debt: $25,978,000
Miami-Dade County government finances - Debt in 2018:
- Bond Funds - Cash and Securities: $925,703,000
Cash and Securities: $822,896,000
- Charges - Hospital Public: $1,561,013,000
Hospital Public: $1,421,639,000
Air Transportation: $820,562,000
Air Transportation: $804,724,000
Other: $643,544,000
Other: $459,672,000
Sewerage: $400,427,000
Sewerage: $391,287,000
Solid Waste Management: $271,447,000
Solid Waste Management: $269,679,000
Sea and Inland Port Facilities: $166,756,000
Sea and Inland Port Facilities: $165,592,000
Housing and Community Development: $77,524,000
Housing and Community Development: $66,054,000
Parks and Recreation: $65,161,000
Parks and Recreation: $59,109,000
Natural Resources - Other: $35,995,000
Natural Resources - Other: $35,561,000
Toll Highways: $17,479,000
Toll Highways: $13,827,000
Parking Facilities: $3,649,000
Parking Facilities: $3,617,000
Regular Highways: $2,169,000
Regular Highways: $73,000
- Construction - Water Utilities: $219,250,000
Sewerage: $218,250,000
Sewerage: $199,000,000
Water Utilities: $199,000,000
Sea and Inland Port Facilities: $173,265,000
Air Transportation: $165,185,000
Air Transportation: $98,040,000
Regular Highways: $62,212,000
Regular Highways: $58,944,000
Sea and Inland Port Facilities: $51,895,000
Solid Waste Management: $40,280,000
Parks and Recreation: $23,429,000
Parks and Recreation: $23,235,000
Solid Waste Management: $9,998,000
- Current Operations - Hospitals: $2,256,292,000
Hospitals: $1,958,698,000
Police Protection: $724,041,000
Police Protection: $660,074,000
Transit Utilities: $641,115,000
Transit Utilities: $555,862,000
Air Transportation: $500,363,000
Local Fire Protection: $464,884,000
Air Transportation: $437,358,000
Local Fire Protection: $412,689,000
Public Welfare - Other: $393,899,000
Public Welfare - Other: $361,873,000
Correctional Institutions: $359,147,000
Housing and Community Development: $355,328,000
Correctional Institutions: $338,788,000
Housing and Community Development: $330,706,000
Parks and Recreation: $295,983,000
Parks and Recreation: $280,138,000
Solid Waste Management: $249,934,000
Solid Waste Management: $249,475,000
Sewerage: $243,840,000
Sewerage: $219,730,000
Water Utilities: $198,384,000
General - Other: $190,356,000
Water Utilities: $178,799,000
Financial Administration: $168,457,000
General - Other: $151,778,000
Financial Administration: $122,233,000
Judicial and Legal Services: $120,684,000
Toll Highways: $115,488,000
Judicial and Legal Services: $114,175,000
Toll Highways: $110,172,000
Natural Resources - Other: $94,896,000
Natural Resources - Other: $92,813,000
Sea and Inland Port Facilities: $85,840,000
Sea and Inland Port Facilities: $79,574,000
Regular Highways: $69,784,000
Libraries: $65,989,000
Health - Other: $54,959,000
Libraries: $53,699,000
Central Staff Services: $53,250,000
Health - Other: $47,882,000
Regular Highways: $43,051,000
Public Welfare, Vendor Payments for Medical Care: $36,636,000
Central Staff Services: $25,035,000
Public Welfare, Vendor Payments for Medical Care: $24,862,000
General Public Buildings: $9,429,000
General Public Buildings: $8,893,000
Protective Inspection and Regulation - Other: $1,632,000
Protective Inspection and Regulation - Other: $701,000
- Federal Intergovernmental - Housing and Community Development: $275,385,000
Housing and Community Development: $246,771,000
Other: $214,813,000
Transit Utilities: $155,657,000
Public Welfare: $148,796,000
Transit Utilities: $147,218,000
Public Welfare: $135,300,000
Highways: $124,114,000
Highways: $104,007,000
Other: $40,448,000
General Local Government Support: $958,000
General Local Government Support: $918,000
- General - Interest on Debt: $564,185,000
Interest on Debt: $551,038,000
- Local Intergovernmental - Other: $197,270,000
Other: $86,684,000
- Long Term Debt - Outstanding Unspecified Public Purpose: $16,386,113,000
Beginning Outstanding - Unspecified Public Purpose: $15,812,584,000
Beginning Outstanding - Unspecified Public Purpose: $15,526,287,000
Outstanding Unspecified Public Purpose: $15,304,184,000
Beginning Outstanding - Public Debt for Private Purpose: $2,243,583,000
Beginning Outstanding - Public Debt for Private Purpose: $2,239,884,000
Outstanding Nonguaranteed - Industrial Revenue: $2,206,818,000
Outstanding Nonguaranteed - Industrial Revenue: $2,125,280,000
Issue, Unspecified Public Purpose: $1,977,670,000
Retired Unspecified Public Purpose: $1,642,544,000
Retired Unspecified Public Purpose: $1,404,141,000
Issue, Unspecified Public Purpose: $1,213,441,000
Retired Nonguaranteed - Public Debt for Private Purpose: $154,814,000
Issue, Nonguaranteed - Public Debt for Private Purpose: $118,049,000
Retired Nonguaranteed - Public Debt for Private Purpose: $115,604,000
- Miscellaneous - General Revenue - Other: $308,001,000
Interest Earnings: $266,224,000
General Revenue - Other: $253,421,000
Interest Earnings: $240,271,000
Special Assessments: $166,067,000
Special Assessments: $144,411,000
Fines and Forfeits: $51,562,000
Fines and Forfeits: $49,487,000
Donations From Private Sources: $21,200,000
Rents: $15,079,000
Donations From Private Sources: $13,844,000
Rents: $12,566,000
Sale of Property: $83,000
Sale of Property: $46,000
- Other Capital Outlay - General - Other: $45,590,000
General - Other: $28,264,000
Police Protection: $18,169,000
Natural Resources - Other: $17,867,000
Local Fire Protection: $15,447,000
Local Fire Protection: $14,671,000
Natural Resources - Other: $13,262,000
Police Protection: $12,443,000
Libraries: $7,409,000
Housing and Community Development: $7,081,000
Libraries: $5,465,000
Correctional Institutions: $4,660,000
Judicial and Legal Services: $4,156,000
Correctional Institutions: $2,958,000
Housing and Community Development: $2,342,000
Financial Administration: $1,957,000
Health - Other: $1,861,000
Health - Other: $1,723,000
Financial Administration: $1,383,000
Hospitals: $588,000
Judicial and Legal Services: $225,000
Central Staff Services: $75,000
- Other Funds - Cash and Securities: $4,545,989,000
Cash and Securities: $4,380,640,000
- Revenue - Water Utilities: $334,023,000
Water Utilities: $316,045,000
Transit Utilities: $100,359,000
Transit Utilities: $95,230,000
- Sinking Funds - Cash and Securities: $3,151,393,000
Cash and Securities: $2,692,056,000
- State Intergovernmental - General Local Government Support: $292,983,000
General Local Government Support: $274,194,000
Other: $71,313,000
Other: $56,551,000
Transit Utilities: $50,224,000
Transit Utilities: $37,469,000
Highways: $31,922,000
Highways: $31,391,000
Housing and Community Development: $7,439,000
Public Welfare: $3,220,000
Public Welfare: $2,374,000
Housing and Community Development: $1,438,000
Health and Hospitals: $447,000
Health and Hospitals: $447,000
- Tax - Property: $2,023,310,000
Property: $1,725,444,000
General Sales and Gross Receipts: $605,749,000
General Sales and Gross Receipts: $551,589,000
Public Utilities Sales: $125,891,000
Public Utilities Sales: $124,965,000
Public Utility License: $99,982,000
Other License: $94,331,000
Motor Fuels Sales: $80,636,000
Motor Fuels Sales: $79,766,000
Other License: $79,210,000
Occupation and Business License - Other: $37,716,000
Occupation and Business License - Other: $30,919,000
Other: $9,790,000
Other: $9,688,000
- Total Salaries and Wages: $659,000
: $570,000
- Water Utilities - Interest on Debt: $111,875,000
Interest on Debt: $25,978,000
Miami-Dade County government finances - Cash and Securities in 2018:
- Bond Funds - Cash and Securities: $925,703,000
Cash and Securities: $822,896,000
- Charges - Hospital Public: $1,561,013,000
Hospital Public: $1,421,639,000
Air Transportation: $820,562,000
Air Transportation: $804,724,000
Other: $643,544,000
Other: $459,672,000
Sewerage: $400,427,000
Sewerage: $391,287,000
Solid Waste Management: $271,447,000
Solid Waste Management: $269,679,000
Sea and Inland Port Facilities: $166,756,000
Sea and Inland Port Facilities: $165,592,000
Housing and Community Development: $77,524,000
Housing and Community Development: $66,054,000
Parks and Recreation: $65,161,000
Parks and Recreation: $59,109,000
Natural Resources - Other: $35,995,000
Natural Resources - Other: $35,561,000
Toll Highways: $17,479,000
Toll Highways: $13,827,000
Parking Facilities: $3,649,000
Parking Facilities: $3,617,000
Regular Highways: $2,169,000
Regular Highways: $73,000
- Construction - Water Utilities: $219,250,000
Sewerage: $218,250,000
Sewerage: $199,000,000
Water Utilities: $199,000,000
Sea and Inland Port Facilities: $173,265,000
Air Transportation: $165,185,000
Air Transportation: $98,040,000
Regular Highways: $62,212,000
Regular Highways: $58,944,000
Sea and Inland Port Facilities: $51,895,000
Solid Waste Management: $40,280,000
Parks and Recreation: $23,429,000
Parks and Recreation: $23,235,000
Solid Waste Management: $9,998,000
- Current Operations - Hospitals: $2,256,292,000
Hospitals: $1,958,698,000
Police Protection: $724,041,000
Police Protection: $660,074,000
Transit Utilities: $641,115,000
Transit Utilities: $555,862,000
Air Transportation: $500,363,000
Local Fire Protection: $464,884,000
Air Transportation: $437,358,000
Local Fire Protection: $412,689,000
Public Welfare - Other: $393,899,000
Public Welfare - Other: $361,873,000
Correctional Institutions: $359,147,000
Housing and Community Development: $355,328,000
Correctional Institutions: $338,788,000
Housing and Community Development: $330,706,000
Parks and Recreation: $295,983,000
Parks and Recreation: $280,138,000
Solid Waste Management: $249,934,000
Solid Waste Management: $249,475,000
Sewerage: $243,840,000
Sewerage: $219,730,000
Water Utilities: $198,384,000
General - Other: $190,356,000
Water Utilities: $178,799,000
Financial Administration: $168,457,000
General - Other: $151,778,000
Financial Administration: $122,233,000
Judicial and Legal Services: $120,684,000
Toll Highways: $115,488,000
Judicial and Legal Services: $114,175,000
Toll Highways: $110,172,000
Natural Resources - Other: $94,896,000
Natural Resources - Other: $92,813,000
Sea and Inland Port Facilities: $85,840,000
Sea and Inland Port Facilities: $79,574,000
Regular Highways: $69,784,000
Libraries: $65,989,000
Health - Other: $54,959,000
Libraries: $53,699,000
Central Staff Services: $53,250,000
Health - Other: $47,882,000
Regular Highways: $43,051,000
Public Welfare, Vendor Payments for Medical Care: $36,636,000
Central Staff Services: $25,035,000
Public Welfare, Vendor Payments for Medical Care: $24,862,000
General Public Buildings: $9,429,000
General Public Buildings: $8,893,000
Protective Inspection and Regulation - Other: $1,632,000
Protective Inspection and Regulation - Other: $701,000
- Federal Intergovernmental - Housing and Community Development: $275,385,000
Housing and Community Development: $246,771,000
Other: $214,813,000
Transit Utilities: $155,657,000
Public Welfare: $148,796,000
Transit Utilities: $147,218,000
Public Welfare: $135,300,000
Highways: $124,114,000
Highways: $104,007,000
Other: $40,448,000
General Local Government Support: $958,000
General Local Government Support: $918,000
- General - Interest on Debt: $564,185,000
Interest on Debt: $551,038,000
- Local Intergovernmental - Other: $197,270,000
Other: $86,684,000
- Long Term Debt - Outstanding Unspecified Public Purpose: $16,386,113,000
Beginning Outstanding - Unspecified Public Purpose: $15,812,584,000
Beginning Outstanding - Unspecified Public Purpose: $15,526,287,000
Outstanding Unspecified Public Purpose: $15,304,184,000
Beginning Outstanding - Public Debt for Private Purpose: $2,243,583,000
Beginning Outstanding - Public Debt for Private Purpose: $2,239,884,000
Outstanding Nonguaranteed - Industrial Revenue: $2,206,818,000
Outstanding Nonguaranteed - Industrial Revenue: $2,125,280,000
Issue, Unspecified Public Purpose: $1,977,670,000
Retired Unspecified Public Purpose: $1,642,544,000
Retired Unspecified Public Purpose: $1,404,141,000
Issue, Unspecified Public Purpose: $1,213,441,000
Retired Nonguaranteed - Public Debt for Private Purpose: $154,814,000
Issue, Nonguaranteed - Public Debt for Private Purpose: $118,049,000
Retired Nonguaranteed - Public Debt for Private Purpose: $115,604,000
- Miscellaneous - General Revenue - Other: $308,001,000
Interest Earnings: $266,224,000
General Revenue - Other: $253,421,000
Interest Earnings: $240,271,000
Special Assessments: $166,067,000
Special Assessments: $144,411,000
Fines and Forfeits: $51,562,000
Fines and Forfeits: $49,487,000
Donations From Private Sources: $21,200,000
Rents: $15,079,000
Donations From Private Sources: $13,844,000
Rents: $12,566,000
Sale of Property: $83,000
Sale of Property: $46,000
- Other Capital Outlay - General - Other: $45,590,000
General - Other: $28,264,000
Police Protection: $18,169,000
Natural Resources - Other: $17,867,000
Local Fire Protection: $15,447,000
Local Fire Protection: $14,671,000
Natural Resources - Other: $13,262,000
Police Protection: $12,443,000
Libraries: $7,409,000
Housing and Community Development: $7,081,000
Libraries: $5,465,000
Correctional Institutions: $4,660,000
Judicial and Legal Services: $4,156,000
Correctional Institutions: $2,958,000
Housing and Community Development: $2,342,000
Financial Administration: $1,957,000
Health - Other: $1,861,000
Health - Other: $1,723,000
Financial Administration: $1,383,000
Hospitals: $588,000
Judicial and Legal Services: $225,000
Central Staff Services: $75,000
- Other Funds - Cash and Securities: $4,545,989,000
Cash and Securities: $4,380,640,000
- Revenue - Water Utilities: $334,023,000
Water Utilities: $316,045,000
Transit Utilities: $100,359,000
Transit Utilities: $95,230,000
- Sinking Funds - Cash and Securities: $3,151,393,000
Cash and Securities: $2,692,056,000
- State Intergovernmental - General Local Government Support: $292,983,000
General Local Government Support: $274,194,000
Other: $71,313,000
Other: $56,551,000
Transit Utilities: $50,224,000
Transit Utilities: $37,469,000
Highways: $31,922,000
Highways: $31,391,000
Housing and Community Development: $7,439,000
Public Welfare: $3,220,000
Public Welfare: $2,374,000
Housing and Community Development: $1,438,000
Health and Hospitals: $447,000
Health and Hospitals: $447,000
- Tax - Property: $2,023,310,000
Property: $1,725,444,000
General Sales and Gross Receipts: $605,749,000
General Sales and Gross Receipts: $551,589,000
Public Utilities Sales: $125,891,000
Public Utilities Sales: $124,965,000
Public Utility License: $99,982,000
Other License: $94,331,000
Motor Fuels Sales: $80,636,000
Motor Fuels Sales: $79,766,000
Other License: $79,210,000
Occupation and Business License - Other: $37,716,000
Occupation and Business License - Other: $30,919,000
Other: $9,790,000
Other: $9,688,000
- Total Salaries and Wages: $659,000
: $570,000
- Water Utilities - Interest on Debt: $111,875,000
Interest on Debt: $25,978,000
Supplemental Security Income (SSI) in 2006:
- Total number of recipients: 128,591
- Number of aged recipients: 56,783
- Number of blind and disabled recipients: 71,808
- Number of recipients under 18: 13,750
- Number of recipients between 18 and 64: 40,488
- Number of recipients older than 64: 74,353
- Number of recipients also receiving OASDI: 42,111
- Amount of payments (thousands of dollars): 56,797
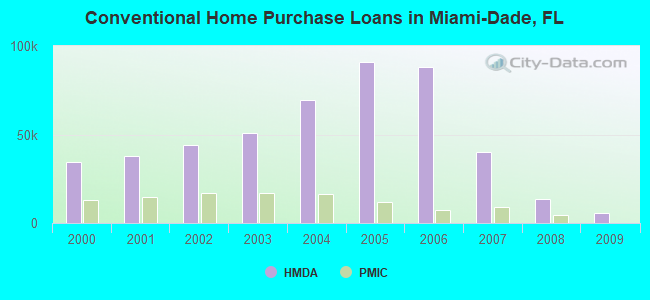
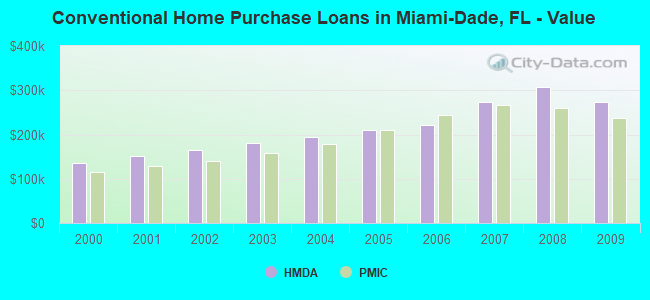
| Home Mortgage Disclosure Act Aggregated Statistics For Year 2009 (Based on 347 full tracts) | ||||||||||||||
| A) FHA, FSA/RHS & VA Home Purchase Loans | B) Conventional Home Purchase Loans | C) Refinancings | D) Home Improvement Loans | E) Loans on Dwellings For 5+ Families | F) Non-occupant Loans on < 5 Family Dwellings (A B C & D) | G) Loans On Manufactured Home Dwelling (A B C & D) | ||||||||
|---|---|---|---|---|---|---|---|---|---|---|---|---|---|---|
| Number | Average Value | Number | Average Value | Number | Average Value | Number | Average Value | Number | Average Value | Number | Average Value | Number | Average Value | |
| LOANS ORIGINATED | 4,651 | $171,407 | 5,527 | $272,515 | 10,047 | $232,272 | 511 | $147,012 | 78 | $4,056,885 | 2,396 | $276,220 | 28 | $77,857 |
| APPLICATIONS APPROVED, NOT ACCEPTED | 469 | $169,013 | 952 | $281,001 | 1,877 | $230,314 | 236 | $78,174 | 25 | $15,516,080 | 422 | $269,040 | 17 | $58,529 |
| APPLICATIONS DENIED | 2,204 | $164,862 | 3,454 | $258,534 | 11,061 | $229,490 | 1,186 | $83,190 | 46 | $2,884,826 | 2,708 | $231,586 | 59 | $61,847 |
| APPLICATIONS WITHDRAWN | 1,071 | $169,615 | 1,370 | $285,285 | 3,955 | $230,752 | 209 | $142,225 | 33 | $2,305,848 | 814 | $246,812 | 15 | $121,800 |
| FILES CLOSED FOR INCOMPLETENESS | 388 | $165,320 | 535 | $277,125 | 1,515 | $238,391 | 63 | $161,794 | 1 | $500,000 | 355 | $256,470 | 2 | $60,500 |
| Private Mortgage Insurance Companies Aggregated Statistics For Year 2009 (Based on 276 full tracts) | ||||||
| A) Conventional Home Purchase Loans | B) Refinancings | C) Non-occupant Loans on < 5 Family Dwellings (A & B) | ||||
|---|---|---|---|---|---|---|
| Number | Average Value | Number | Average Value | Number | Average Value | |
| LOANS ORIGINATED | 268 | $237,582 | 44 | $236,591 | 3 | $280,000 |
| APPLICATIONS APPROVED, NOT ACCEPTED | 447 | $243,557 | 86 | $253,721 | 18 | $196,278 |
| APPLICATIONS DENIED | 119 | $221,025 | 46 | $224,522 | 3 | $204,000 |
| APPLICATIONS WITHDRAWN | 34 | $255,265 | 27 | $246,556 | 3 | $255,000 |
| FILES CLOSED FOR INCOMPLETENESS | 107 | $266,308 | 21 | $248,667 | 11 | $254,273 |
| Most common first names in Miami-Dade County, FL among deceased individuals | ||
| Name | Count | Lived (average) |
|---|---|---|
| Maria | 12,966 | 82.4 years |
| Jose | 8,959 | 76.1 years |
| John | 7,700 | 73.3 years |
| William | 7,138 | 74.1 years |
| Mary | 6,498 | 78.6 years |
| Joseph | 6,118 | 76.1 years |
| James | 5,168 | 70.1 years |
| Charles | 4,688 | 74.3 years |
| Robert | 4,661 | 69.2 years |
| George | 4,361 | 74.3 years |
| Most common last names in Miami-Dade County, FL among deceased individuals | ||
| Last name | Count | Lived (average) |
|---|---|---|
| Rodriguez | 6,724 | 77.2 years |
| Gonzalez | 6,162 | 77.6 years |
| Garcia | 5,045 | 77.8 years |
| Perez | 4,927 | 76.7 years |
| Hernandez | 4,172 | 76.6 years |
| Fernandez | 4,016 | 78.4 years |
| Martinez | 3,323 | 77.1 years |
| Lopez | 3,034 | 77.0 years |
| Diaz | 3,010 | 77.3 years |
| Smith | 2,982 | 72.3 years |
| Businesses in Miami-Dade County, FL | ||||
| Name | Count | Name | Count | |
|---|---|---|---|---|
| 24 Hour Fitness | 3 | Kincaid | 1 | |
| 7-Eleven | 26 | Kmart | 9 | |
| ALDO | 11 | Knights Inn | 1 | |
| AT&T | 60 | Kohl's | 3 | |
| Abercrombie & Fitch | 3 | Kroger | 1 | |
| Abercrombie Kids | 2 | LA Fitness | 18 | |
| Ace Hardware | 17 | La Quinta | 5 | |
| Advance Auto Parts | 61 | La-Z-Boy | 1 | |
| Aeropostale | 7 | Lane Bryant | 3 | |
| Aerosoles | 1 | Lane Furniture | 10 | |
| American Eagle Outfitters | 3 | LensCrafters | 10 | |
| Ann Taylor | 11 | Levi Strauss & Co. | 3 | |
| Apple Store | 4 | Little Caesars Pizza | 28 | |
| Applebee's | 4 | Loews | 1 | |
| Arby's | 5 | Long John Silver's | 3 | |
| Ashley Furniture | 1 | Lowe's | 4 | |
| Audi | 2 | Macy's | 12 | |
| AutoZone | 25 | Marriott | 31 | |
| Avenue | 5 | Marshalls | 15 | |
| BMW | 2 | MasterBrand Cabinets | 21 | |
| Baja Fresh Mexican Grill | 2 | Mazda | 3 | |
| Bakers | 6 | McDonald's | 99 | |
| Bally Total Fitness | 8 | Men's Wearhouse | 8 | |
| Banana Republic | 8 | Motel 6 | 1 | |
| Barnes & Noble | 3 | Motherhood Maternity | 16 | |
| Baskin-Robbins | 7 | New Balance | 21 | |
| Bath & Body Works | 9 | New York & Co | 4 | |
| Baymont Inn | 1 | Nike | 162 | |
| Bebe | 6 | Nissan | 4 | |
| Bed Bath & Beyond | 8 | Nordstrom | 5 | |
| Ben & Jerry's | 9 | Office Depot | 20 | |
| Bentleymotors.Com | 1 | OfficeMax | 11 | |
| Best Western | 8 | Old Navy | 10 | |
| Blockbuster | 34 | Olive Garden | 3 | |
| Brooks Brothers | 3 | On The Border | 2 | |
| Brookstone | 5 | Outback | 6 | |
| Budget Car Rental | 10 | Outback Steakhouse | 6 | |
| Buffalo Wild Wings | 2 | Pac Sun | 5 | |
| Burger King | 72 | Panda Express | 5 | |
| Buybuy BABY | 1 | Panera Bread | 6 | |
| CVS | 69 | Papa John's Pizza | 21 | |
| Cache | 8 | Payless | 54 | |
| CarMax | 1 | Penske | 17 | |
| Casual Male XL | 3 | PetSmart | 7 | |
| Charlotte Russe | 4 | Pier 1 Imports | 7 | |
| Chevrolet | 7 | Pizza Hut | 38 | |
| Chick-Fil-A | 3 | Plato's Closet | 1 | |
| Chico's | 4 | Popeyes | 12 | |
| Chipotle | 6 | Pottery Barn | 2 | |
| Chuck E. Cheese's | 4 | Pottery Barn Kids | 1 | |
| Church's Chicken | 9 | Publix Super Markets | 68 | |
| Cinnabon | 2 | Quality | 1 | |
| Clarks | 4 | Quiznos | 22 | |
| Cold Stone Creamery | 11 | RadioShack | 42 | |
| Comfort Inn | 2 | Ramada | 3 | |
| Comfort Suites | 1 | Red Lobster | 6 | |
| Costco | 4 | Red Roof Inn | 1 | |
| Cracker Barrel | 1 | Rite Aid | 1 | |
| Crate & Barrel | 1 | Rooms To Go | 8 | |
| Curves | 5 | Ruby Tuesday | 3 | |
| DHL | 91 | Ryder Rental & Truck Leasing | 4 | |
| Dairy Queen | 14 | SAS Shoes | 11 | |
| Days Hotel | 1 | Saks Fifth Avenue | 2 | |
| Days Inn | 5 | Sam's Club | 1 | |
| Decora Cabinetry | 4 | Sears | 29 | |
| Dennys | 22 | Sephora | 7 | |
| Domino's Pizza | 19 | Sheraton | 1 | |
| DressBarn | 1 | Skechers USA | 9 | |
| Dressbarn | 1 | Sleep Inn | 1 | |
| Dunkin Donuts | 44 | Soma Intimates | 1 | |
| Econo Lodge | 1 | Spencer Gifts | 3 | |
| Express | 9 | Sprint Nextel | 22 | |
| Extended Stay America | 3 | Staples | 12 | |
| Extended Stay Deluxe | 1 | Starbucks | 77 | |
| Famous Footwear | 7 | Steak 'n Shake | 1 | |
| FedEx | 325 | Subaru | 2 | |
| Finish Line | 3 | Subway | 50 | |
| Firestone Complete Auto Care | 14 | Super 8 | 1 | |
| Foot Locker | 23 | T-Mobile | 81 | |
| Ford | 7 | T.G.I. Driday's | 6 | |
| Forever 21 | 6 | T.J.Maxx | 9 | |
| Fredericks Of Hollywood | 1 | Taco Bell | 38 | |
| GNC | 50 | Talbots | 2 | |
| GameStop | 52 | Target | 9 | |
| Gap | 14 | The Athlete's Foot | 3 | |
| Goodwill | 11 | The Cheesecake Factory | 3 | |
| Gymboree | 6 | The Limited | 3 | |
| H&R Block | 46 | The Room Place | 2 | |
| Haagen-Dazs | 14 | Tire Kingdom | 17 | |
| Hilton | 16 | Toyota | 6 | |
| Holiday Inn | 19 | Toys"R"Us | 17 | |
| Hollister Co. | 5 | Travelodge | 2 | |
| Home Depot | 17 | True Value | 5 | |
| Homestead Studio Suites | 3 | U-Haul | 106 | |
| Honda | 6 | UPS | 287 | |
| Hot Topic | 4 | Urban Outfitters | 3 | |
| Howard Johnson | 2 | Value City Furniture | 1 | |
| Hyatt | 5 | Vans | 25 | |
| Hyundai | 4 | Verizon Wireless | 15 | |
| IHOP | 15 | Victoria's Secret | 17 | |
| IZOD | 1 | Volkswagen | 4 | |
| J.Crew | 3 | Walgreens | 61 | |
| JCPenney | 6 | Walmart | 8 | |
| Jamba Juice | 4 | Wendy's | 9 | |
| JoS. A. Bank | 2 | Westin | 1 | |
| Johnny Rockets | 10 | Wet Seal | 4 | |
| Jones New York | 29 | Whole Foods Market | 4 | |
| Journeys | 4 | YMCA | 6 | |
| Justice | 5 | Z Gallerie | 1 | |
| KFC | 39 | |||
Miami-Dade County on our top lists:
- #2 on the list of "Top 101 counties with the highest ground withdrawal of fresh water for public supply"
- #2 on the list of "Top 101 counties with the highest ground withdrawal of fresh water for public supply (pop. 50,000+)"
- #8 on the list of "Top 101 counties with the most Evangelical Protestant congregations (pop. 50,000+)"
- #8 on the list of "Top 101 counties with the most Evangelical Protestant congregations"
- #9 on the list of "Top 101 counties with the most Black Protestant adherents"
- #9 on the list of "Top 101 counties with the most Black Protestant adherents (pop. 50,000+)"
- #11 on the list of "Top 101 counties with the highest total withdrawal of fresh water for public supply (pop. 50,000+)"
- #12 on the list of "Top 101 counties with the most Evangelical Protestant adherents (pop. 50,000+)"
- #12 on the list of "Top 101 counties with the most Evangelical Protestant adherents"
- #12 on the list of "Top 101 counties with the most Catholic adherents (pop. 50,000+)"
- #12 on the list of "Top 101 counties with the most Catholic adherents"
- #12 on the list of "Top 101 counties with the highest total withdrawal of fresh water for public supply"
- #17 on the list of "Top 101 counties with the largest number of people moving in compared to moving out (pop. 50,000+)"
- #19 on the list of "Top 101 counties with the most Black Protestant congregations"
- #19 on the list of "Top 101 counties with the most Black Protestant congregations (pop. 50,000+)"
- #20 on the list of "Top 101 counties with the lowest percentage of residents that smoked 100+ cigarettes in their lives"
- #22 on the list of "Top 101 counties with the most Other congregations (pop. 50,000+)"
- #22 on the list of "Top 101 counties with the most Other congregations"
- #32 on the list of "Top 101 counties with the lowest percentage of residents that exercised in the past month"
- #33 on the list of "Top 101 counties with the lowest average weight of females"