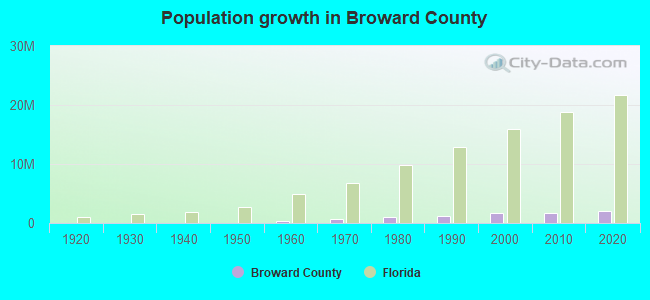
Broward County, Florida (FL)
County owner-occupied free and clear houses and condos in 2010: 123,211
County owner-occupied houses and condos in 2000: 454,625
Renter-occupied apartments: 229,315 (it was 199,820 in 2000)
| % of renters here: | 31% |
| State: | 33% |
Land area: 1205 sq. mi.
Water area: 114.2 sq. mi.
Population density: 1615 people per square mile (very high).
Industries providing employment: Educational, health and social services (20.4%), Professional, scientific, management, administrative, and waste management services (15.6%), Retail trade (12.9%).
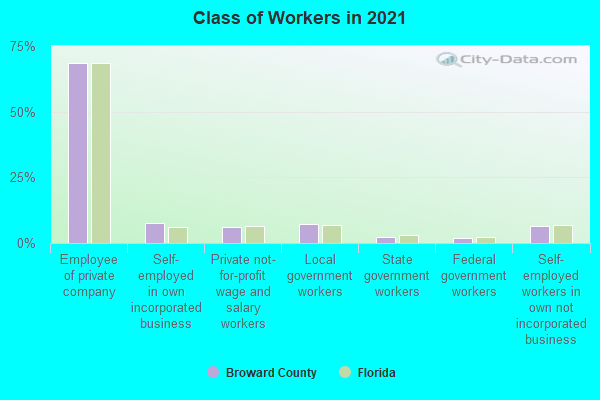
Type of workers:
- Private wage or salary: 83%
- Government: 10%
- Self-employed, not incorporated: 7%
- Unpaid family work: 0%
- OSM Map
- General Map
- Google Map
- MSN Map

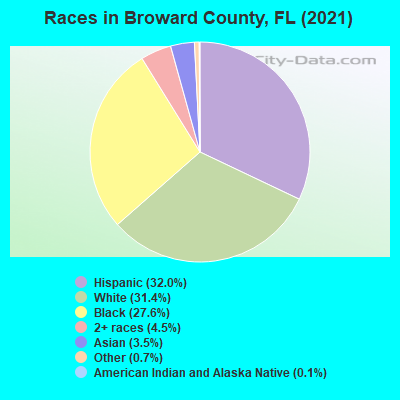
- 633,56732.5%Hispanic or Latino
- 599,25830.8%White Non-Hispanic Alone
- 530,00427.2%Black Non-Hispanic Alone
- 88,9824.6%Two or more races
- 68,6183.5%Asian alone
- 23,2151.2%Some other race alone
- 2,4180.1%American Indian and Alaska Native alone
- 9640.05%Native Hawaiian and Other
Pacific Islander alone
| Median resident age: | 41.6 years |
| Florida median age: | 42.7 years |
| Males: 957,148 | |
| Females: 989,878 |


| Broward County: | 2.0 people |
| Florida: | 2 people |
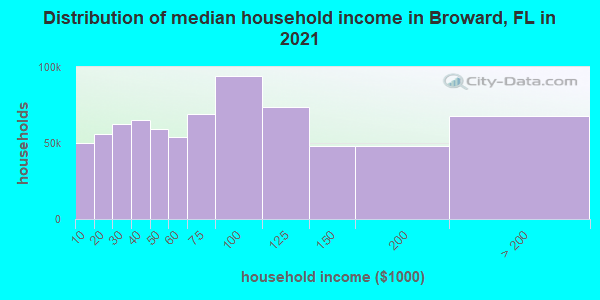
Estimated median household income in 2022: $70,978 ($41,691 in 1999)
| This county: | $70,978 |
| Florida: | $69,303 |
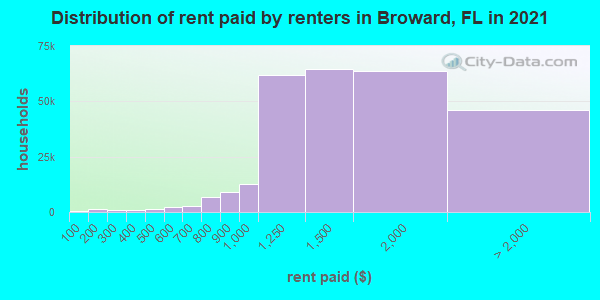
Median contract rent in 2022 for apartments: $1,613 (lower quartile is $1,236, upper quartile is $2,045)
| This county: | $1613 |
| State: | $1367 |
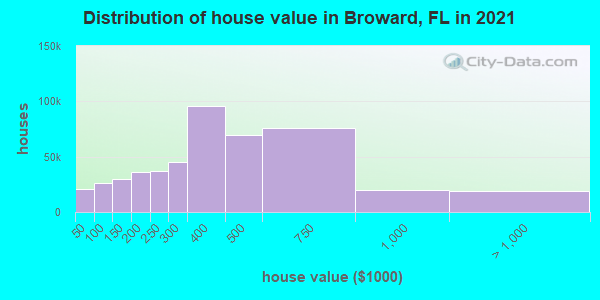
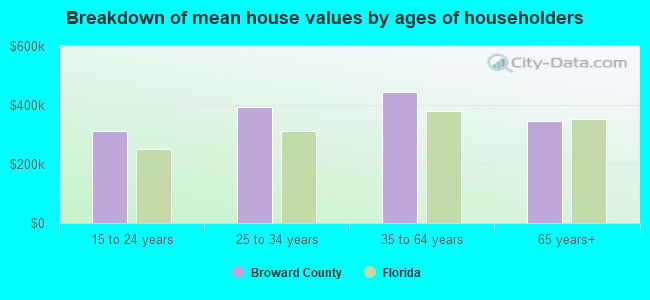
Estimated median house or condo value in 2022: $393,900 (it was $102,800 in 2000)
| Broward: | $393,900 |
| Florida: | $354,100 |
Mean price in 2022:
Median monthly housing costs for homes and condos with a mortgage: $2,174Detached houses: $618,997
Here: $618,997 State: $500,941 Townhouses or other attached units: $394,360
Here: $394,360 State: $370,869 In 2-unit structures: $434,772
Here: $434,772 State: $423,188 In 3-to-4-unit structures: $337,258
Here: $337,258 State: $309,944 In 5-or-more-unit structures: $307,009
Here: $307,009 State: $447,145 Mobile homes: $121,359
Here: $121,359 State: $113,202 Occupied boats, RVs, vans, etc.: $108,860
Here: $108,860 State: $73,933
Median monthly housing costs for units without a mortgage: $742
Institutionalized population: 10,931
Crime in 2020 (reported by the sheriff's office or county police, not the county total):
- Murders: 8
- Rapes: 19
- Robberies: 49
- Assaults: 257
- Burglaries: 66
- Thefts: 396
- Auto thefts: 45
Crime in 2019 (reported by the sheriff's office or county police, not the county total):
- Murders: 2
- Rapes: 26
- Robberies: 93
- Assaults: 228
- Burglaries: 99
- Thefts: 527
- Auto thefts: 68
Health of residents in Broward County based on CDC Behavioral Risk Factor Surveillance System Survey Questionnaires from 2013 to 2021:
General health status score of residents in this county from 1 (poor) to 5 (excellent) is 3.5. This is about average.68.5% of residents exercised in the past month. This is less than average.
40.3% of residents smoked 100+ cigarettes in their lives. This is less than average.
54.9% of adult residents drank alcohol in the past 30 days. This is less than average.
69.0% of residents visited a dentist within the past year. This is about average.
Average weight of males is 188 pounds. This is less than average.
Average weight of females is 154 pounds. This is less than average.
Health of residents in Broward County based on CDC Behavioral Risk Factor Surveillance System Survey Questionnaires from 2003 to 2012:
General health status score of residents in this county from 1 (poor) to 5 (excellent) is 3.6. This is about average.75.2% of residents exercised in the past month. This is about average.
44.8% of residents smoked 100+ cigarettes in their lives. This is about average.
78.4% of adult residents drank alcohol in the past 30 days. This is about average.
69.6% of residents visited a dentist within the past year. This is about average.
Average weight of males is 190 pounds. This is about average.
Average weight of females is 153 pounds. This is less than average.
12.4% of residents keep firearms around their homes. This is less than average.
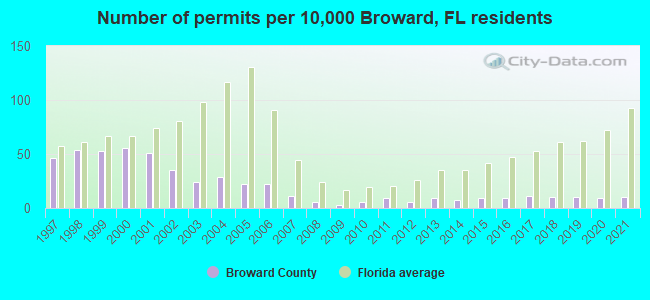
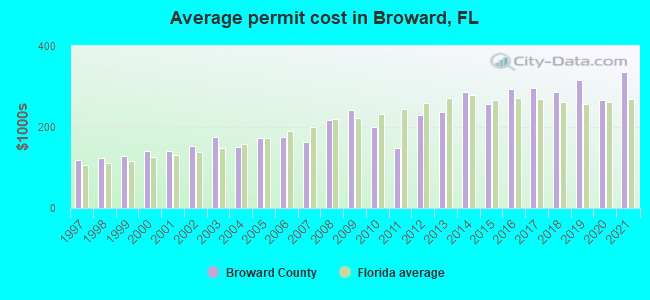
Single-family new house construction building permits:
- 2022: 1090 buildings, average cost: $345,400
- 2021: 1629 buildings, average cost: $337,100
- 2020: 1431 buildings, average cost: $265,900
- 2019: 1635 buildings, average cost: $316,400
- 2018: 1580 buildings, average cost: $285,500
- 2017: 1748 buildings, average cost: $296,300
- 2016: 1535 buildings, average cost: $293,100
- 2015: 1494 buildings, average cost: $255,800
- 2014: 1181 buildings, average cost: $287,000
- 2013: 1434 buildings, average cost: $237,700
- 2012: 1023 buildings, average cost: $228,600
- 2011: 1446 buildings, average cost: $148,600
- 2010: 979 buildings, average cost: $200,300
- 2009: 563 buildings, average cost: $241,800
- 2008: 908 buildings, average cost: $216,700
- 2007: 1754 buildings, average cost: $162,000
- 2006: 3550 buildings, average cost: $175,500
- 2005: 3609 buildings, average cost: $173,800
- 2004: 4784 buildings, average cost: $151,400
- 2003: 3880 buildings, average cost: $175,000
- 2002: 5705 buildings, average cost: $151,500
- 2001: 8275 buildings, average cost: $140,100
- 2000: 9160 buildings, average cost: $139,600
- 1999: 8574 buildings, average cost: $129,200
- 1998: 8753 buildings, average cost: $122,500
- 1997: 7494 buildings, average cost: $119,200
Median real estate property taxes paid for housing units with mortgages in 2022: $4,123 (0.9%)
Median real estate property taxes paid for housing units with no mortgage in 2022: $2,831 (0.9%)
| Broward County: | 13.3% |
| Florida: | 12.7% |
Median age of residents in 2022: 41.6 years old
(Males: 40.6 years old, Females: 42.5 years old)
(Median age for: White residents: 52.6 years old, Black residents: 35.4 years old, American Indian residents: 40.2 years old, Asian residents: 41.3 years old, Hispanic or Latino residents: 39.4 years old, Other race residents: 37.4 years old)
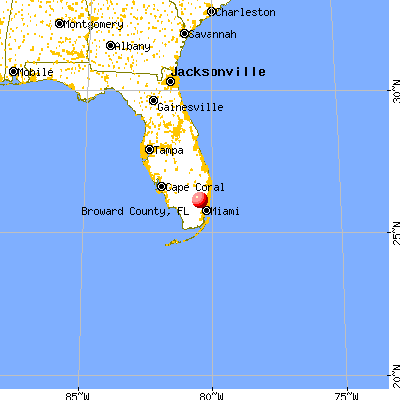
Area name: Miami-Fort Lauderdale-Miami Beach, FL MSA
Fair market rent in 2006 for a 1-bedroom apartment in Broward County is $752 a month.
Fair market rent for a 2-bedroom apartment is $911 a month.
Fair market rent for a 3-bedroom apartment is $1205 a month.
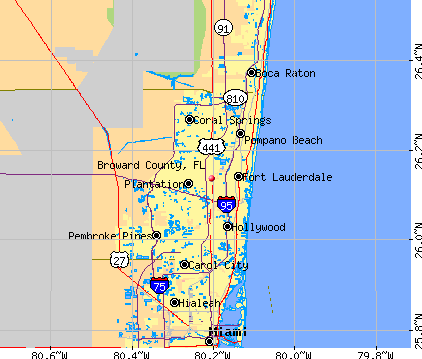
Cities in this county include: Fort Lauderdale, Hollywood, Pembroke Pines, Coral Springs, Sunrise, Plantation, Pompano Beach, Davie, Miramar, Deerfield Beach.
| Zip Code | City | Certified Residential Database | Mandatory Residential Database | Mandatory Non-Residential Database | |||
|---|---|---|---|---|---|---|---|
| Buildings Measured | Above 4 pCi/L (%) | Buildings Measured | Above 4 pCi/L (%) | Buildings Measured | Above 4 pCi/L (%) | ||
| 33004 | Dania | 10 | 30 | 1 | 0 | 1 | 0 |
| 33009 | Hallandale | 6 | 0 | 1 | 0 | 1 | 0 |
| 33019 | Hollywood | 17 | 6 | - | - | - | - |
| 33020 | Hollywood | 14 | 0 | 5 | 0 | 5 | 0 |
| 33021 | Hollywood | 473 | 49 | - | - | - | - |
| 33023 | Hollywood | 34 | 0 | 1 | 0 | 1 | 0 |
| 33024 | Hollywood | 56 | 9 | 4 | 0 | 4 | 0 |
| 33025 | Hollywood | 189 | 32 | 1 | 0 | 1 | 0 |
| 33026 | Hollywood | 108 | 2 | - | - | - | - |
| 33027 | Hollywood | 44 | 27 | - | - | - | - |
| 33028 | Hollywood | 33 | 3 | - | - | - | - |
| 33029 | Hollywood | 62 | 0 | - | - | - | - |
| 33060 | Pompano Beach | 22 | 0 | 7 | 0 | 7 | 0 |
| 33062 | Pompano Beach | 50 | 0 | 3 | 0 | 3 | 0 |
| 33063 | Pompano Beach | 278 | 47 | - | - | - | - |
| 33064 | Pompano Beach | 52 | 0 | - | - | - | - |
| 33065 | Pompano Beach | 184 | 10 | - | - | - | - |
| 33066 | Pompano Beach | 36 | 31 | - | - | - | - |
| 33067 | Pompano Beach | 450 | 31 | - | - | - | - |
| 33068 | Pompano Beach | 253 | 17 | - | - | - | - |
| 33069 | Pompano Beach | 648 | 18 | 1 | 0 | 1 | 0 |
| 33071 | Pompano Beach | 281 | 3 | - | - | - | - |
| 33073 | Pompano Beach | 176 | 49 | - | - | - | - |
| 33076 | Pompano Beach | 181 | 43 | - | - | - | - |
| 33301 | Fort Lauderdale | 36 | 0 | 1 | 0 | 1 | 0 |
| 33304 | Fort Lauderdale | 23 | 0 | 7 | 0 | 7 | 0 |
| 33305 | Fort Lauderdale | 22 | 0 | - | - | - | - |
| 33306 | Fort Lauderdale | 14 | 0 | - | - | - | - |
| 33308 | Fort Lauderdale | 71 | 0 | - | - | - | - |
| 33309 | Fort Lauderdale | 29 | 3 | 1 | 0 | 1 | 0 |
| 33310 | Fort Lauderdale | 1 | 0 | - | - | - | - |
| 33311 | Fort Lauderdale | 13 | 0 | 13 | 0 | 13 | 0 |
| 33312 | Fort Lauderdale | 32 | 0 | 4 | 0 | 4 | 0 |
| 33313 | Fort Lauderdale | 52 | 10 | 5 | 0 | 5 | 0 |
| 33314 | Fort Lauderdale | 8 | 0 | 1 | 0 | 1 | 0 |
| 33315 | Fort Lauderdale | 10 | 0 | 1 | 0 | 1 | 0 |
| 33316 | Fort Lauderdale | 35 | 0 | - | - | - | - |
| 33317 | Fort Lauderdale | 63 | 2 | 1 | 0 | 1 | 0 |
| 33319 | Fort Lauderdale | 205 | 14 | 1 | 0 | 1 | 0 |
| 33321 | Fort Lauderdale | 207 | 60 | 2 | 0 | 2 | 0 |
| 33322 | Fort Lauderdale | 144 | 6 | - | - | - | - |
| 33323 | Fort Lauderdale | 123 | 2 | 1 | 0 | 1 | 0 |
| 33324 | Fort Lauderdale | 810 | 49 | - | - | - | - |
| 33325 | Fort Lauderdale | 57 | 0 | - | - | - | - |
| 33326 | Fort Lauderdale | 238 | 3 | - | - | - | - |
| 33327 | Fort Lauderdale | 41 | 2 | - | - | - | - |
| 33328 | Fort Lauderdale | 127 | 52 | 2 | 0 | 2 | 0 |
| 33330 | Fort Lauderdale | 44 | 0 | - | - | - | - |
| 33331 | Fort Lauderdale | 50 | 0 | - | - | - | - |
| 33332 | Fort Lauderdale | 41 | 0 | - | - | - | - |
| 33334 | Fort Lauderdale | 18 | 0 | 3 | 0 | 3 | 0 |
| 33351 | Fort Lauderdale | 115 | 24 | - | - | - | - |
| 33441 | Deerfield Beach | 40 | 0 | 3 | 0 | 3 | 0 |
| 33442 | Deerfield Beach | 50 | 42 | - | - | - | - |
2023 air pollution in Broward County:
Carbon Monoxide: 0.368 ppm (standard limit: 9 ppm). Above U.S. average.
Nitrogen Dioxide: 0.01 ppm (standard limit: 0.053 ppm). Above U.S. average.
Ozone (1-hour): 0.029 ppm (standard limit: 0.12 ppm). Below U.S. average.
Particulate Matter (PM10) Annual: 17.4 µg/m3. Near U.S. average.
Particulate Matter (PM2.5) Annual: 8.5 µg/m3(standard limit: 15.0 µg/m3). Near U.S. average.
Sulfur Oxides Annual: 0.001 ppm (standard limit: 0.03 ppm). Near U.S. average.
| Here: | 2.8% |
| Florida: | 2.9% |
Current college students: 88,536
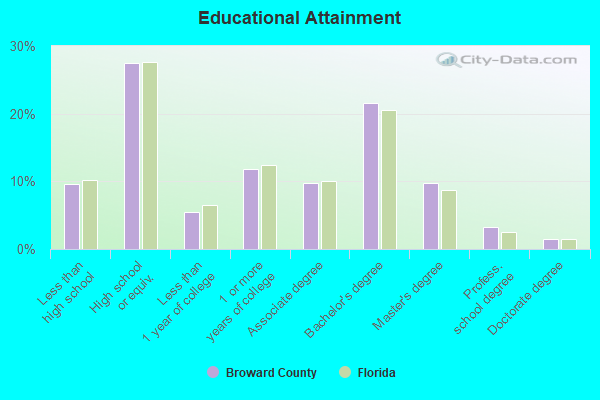
People 25 years of age or older with a high school degree or higher: 89.4%
People 25 years of age or older with a bachelor's degree or higher: 37.1%
Number of foreign born residents: 731,106 (60.5% naturalized citizens)
| Broward County: | 37.5% |
| Whole state: | 21.7% |
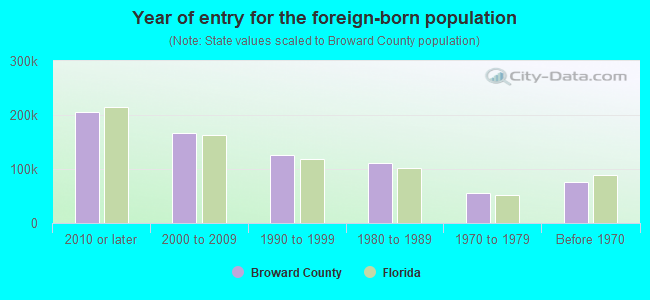
- Year of entry for the foreign-born population
- 253,8342010 or later
- 157,2902000 to 2009
- 127,6571990 to 1999
- 111,2151980 to 1989
- 55,3041970 to 1979
- 76,008Before 1970
Mean travel time to work (commute): minutes
Percentage of county residents living and working in this county: 99.3%
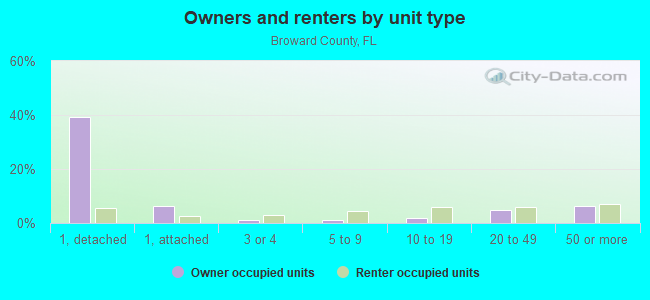
Housing units in structures:
- One, detached: 344,727
- One, attached: 76,438
- Two: 21,986
- 3 or 4: 42,673
- 5 to 9: 48,845
- 10 to 19: 65,049
- 20 to 49: 96,957
- 50 or more: 151,747
- Mobile homes: 18,194
- Boats, RVs, vans, etc.: 579
Housing units in Broward County with a mortgage: 275,335 (24,793 second mortgage, 529 home equity loan, 20,356 both second mortgage and home equity loan)
Houses without a mortgage: 6,486
| Here: | 97.9% with mortgage |
| State: | 97.6% with mortgage |
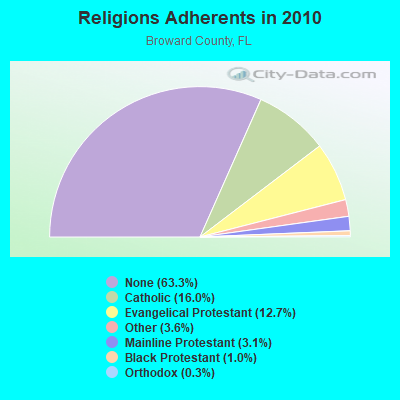
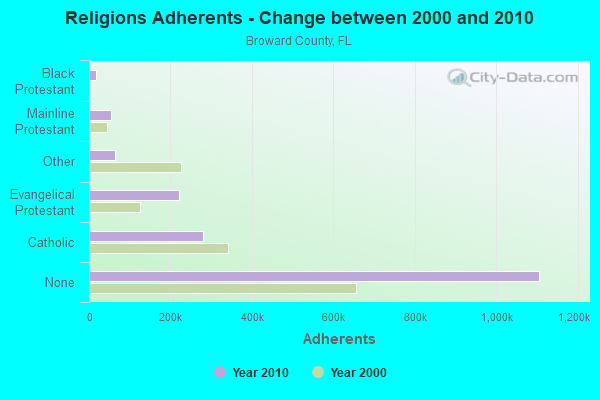
Religion statistics for Broward County
| Religion | Adherents | Congregations |
|---|---|---|
| Catholic | 280,324 | 47 |
| Evangelical Protestant | 221,258 | 701 |
| Other | 63,064 | 143 |
| Mainline Protestant | 53,412 | 88 |
| Black Protestant | 17,866 | 45 |
| Orthodox | 5,648 | 16 |
| None | 1,106,494 | - |
Source: Clifford Grammich, Kirk Hadaway, Richard Houseal, Dale E.Jones, Alexei Krindatch, Richie Stanley and Richard H.Taylor. 2012. 2010 U.S.Religion Census: Religious Congregations & Membership Study. Association of Statisticians of American Religious Bodies. Jones, Dale E., et al. 2002. Congregations and Membership in the United States 2000. Nashville, TN: Glenmary Research Center.
Food Environment Statistics:
| Broward County: | 2.05 / 10,000 pop. |
| State: | 2.04 / 10,000 pop. |
| Here: | 0.09 / 10,000 pop. |
| Florida: | 0.11 / 10,000 pop. |
| This county: | 1.53 / 10,000 pop. |
| Florida: | 1.28 / 10,000 pop. |
| Broward County: | 2.24 / 10,000 pop. |
| Florida: | 3.04 / 10,000 pop. |
| This county: | 8.00 / 10,000 pop. |
| State: | 7.45 / 10,000 pop. |
| Broward County: | 8.4% |
| Florida: | 9.2% |
| Broward County: | 20.6% |
| State: | 23.7% |
| Here: | 14.0% |
| State: | 14.0% |
Agriculture in Broward County:
Average size of farms: 48 acresAverage value of agricultural products sold per farm: $100,455
Average value of crops sold per acre for harvested cropland: $10170.17
The value of nursery, greenhouse, floriculture, and sod as a percentage of the total market value of agricultural products sold: 72.40%
The value of livestock, poultry, and their products as a percentage of the total market value of agricultural products sold: 10.13%
Average total farm production expenses per farm: $91,156
Harvested cropland as a percentage of land in farms: 18.47%
Irrigated harvested cropland as a percentage of land in farms: 80.00%
Average market value of all machinery and equipment per farm: $30,471
The percentage of farms operated by a family or individual: 61.54%
Average age of principal farm operators: 54 years
Average number of cattle and calves per 100 acres of all land in farms: 21.97
Vegetables: 823 harvested acres
Land in orchards: 669 acres
Earthquake activity:
Broward County-area historical earthquake activity is significantly below Florida state average. It is 99% smaller than the overall U.S. average.On 9/10/2006 at 14:56:08, a magnitude 5.9 (5.9 MB, 5.5 MS, 5.8 MW, Class: Moderate, Intensity: VI - VII) earthquake occurred 398.7 miles away from Broward County center
On 2/22/1992 at 04:21:34, a magnitude 3.2 (3.2 MB, Depth: 6.2 mi, Class: Light, Intensity: II - III) earthquake occurred 83.2 miles away from the county center
On 6/23/2016 at 17:20:29, a magnitude 3.8 (3.8 ML) earthquake occurred 271.0 miles away from the county center
On 7/16/2016 at 20:00:10, a magnitude 3.7 (3.7 MB) earthquake occurred 255.5 miles away from the county center
On 9/21/2016 at 16:30:52, a magnitude 3.8 (3.8 ML) earthquake occurred 275.8 miles away from Broward County center
On 9/4/2016 at 18:29:29, a magnitude 3.8 (3.8 ML) earthquake occurred 276.9 miles away from the county center
Magnitude types: body-wave magnitude (MB), local magnitude (ML), surface-wave magnitude (MS), moment magnitude (MW)
Most recent natural disasters:
- Florida Covid-19 Pandemic, Incident Period: January 20, 2020, FEMA Id: 4486, Natural disaster type: Other
- Florida Hurricane Dorian, Incident Period: August 28, 2019 - September 9, 2019, FEMA Id: 4468, Natural disaster type: Hurricane
- Florida Hurricane Irma, Incident Period: September 4, 2017 - October 18, 2017, FEMA Id: 4337, Natural disaster type: Hurricane
- Florida Hurricane Matthew, Incident Period: October 03, 2016 to October 19, 2016, Emergency Declared EM-3377: October 06, 2016, FEMA Id: 3377, Natural disaster type: Hurricane
- Florida Hurricane Matthew, Incident Period: October 03, 2016 to October 19, 2016, Major Disaster (Presidential) Declared DR-4283: October 08, 2016, FEMA Id: 4283, Natural disaster type: Hurricane
- Florida Tropical Storm Fay, Incident Period: August 18, 2008 to September 12, 2008, Emergency Declared EM-3288: August 21, 2008, FEMA Id: 3288, Natural disaster type: Tropical Storm
- Florida Hurricane Wilma, Incident Period: October 23, 2005 to November 18, 2005, Major Disaster (Presidential) Declared DR-1609: October 24, 2005, FEMA Id: 1609, Natural disaster type: Hurricane
- Florida Hurricane Katrina Evacuation, Incident Period: August 29, 2005 to October 01, 2005, Emergency Declared EM-3220: September 05, 2005, FEMA Id: 3220, Natural disaster type: Hurricane
- Florida Hurricane Katrina, Incident Period: August 24, 2005 to September 06, 2005, Major Disaster (Presidential) Declared DR-1602: August 28, 2005, FEMA Id: 1602, Natural disaster type: Hurricane
- Florida Hurricane Jeanne, Incident Period: September 24, 2004 to November 17, 2004, Major Disaster (Presidential) Declared DR-1561: September 26, 2004, FEMA Id: 1561, Natural disaster type: Hurricane
- 17 other natural disasters have been reported since 1953.
The number of natural disasters in Broward County (27) is a lot greater than the US average (15).
Major Disasters (Presidential) Declared: 15
Emergencies Declared: 8
Causes of natural disasters: Hurricanes: 16, Fires: 3, Floods: 3, Tornadoes: 3, Freezes: 2, Tropical Storms: 2, Heavy Rain: 1, Storm: 1, Wind: 1, Other: 2 (Note: some incidents may be assigned to more than one category).
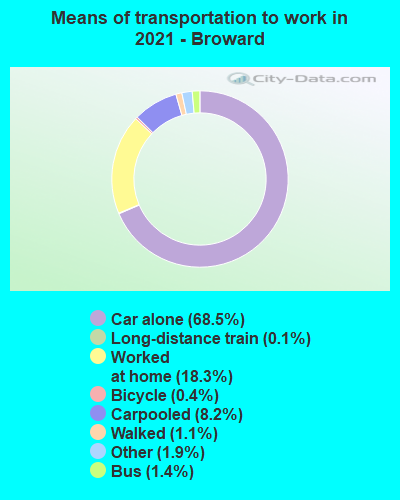
Means of transportation to work:
- Drove a car alone: 622,941 (68.9%)
- Carpooled: 86,135 (9.5%)
- Bus: 15,431 (1.7%)
- Subway or elevated rail: 239 (0.0%)
- Long-distance train or commuter rail: 1,082 (0.1%)
- Taxicab, motorcycle, or other means: 18,555 (2.1%)
- Bicycle: 4,546 (0.5%)
- Walked: 12,911 (1.4%)
- Worked at home: 141,983 (15.7%)
- Health care and social assistance (20%)
- Retail trade (11%)
- Educational services (8%)
- Professional, scientific, and technical services (7%)
- Accommodation and food services (7%)
- Administrative and support and waste management services (6%)
- Other services, except public administration (5%)
- Health care and social assistance (22%)
- Retail trade (12%)
- Educational services (9%)
- Professional, scientific, and technical services (8%)
- Accommodation and food services (7%)
- Administrative and support and waste management services (7%)
- Other services, except public administration (6%)
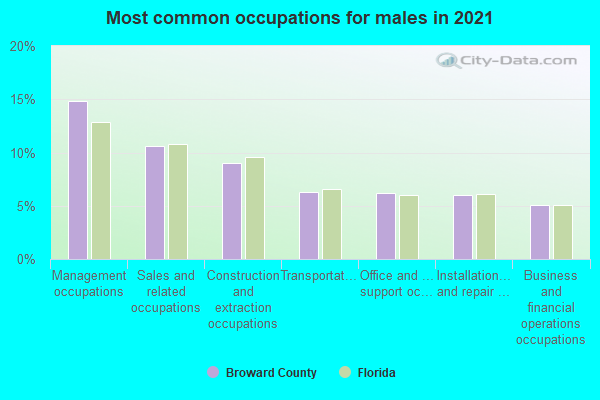
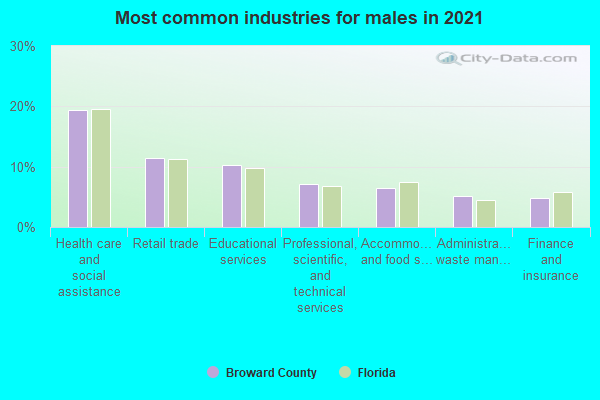
- Management occupations (14%)
- Sales and related occupations (12%)
- Construction and extraction occupations (9%)
- Office and administrative support occupations (7%)
- Transportation occupations (6%)
- Installation, maintenance, and repair occupations (6%)
- Business and financial operations occupations (5%)
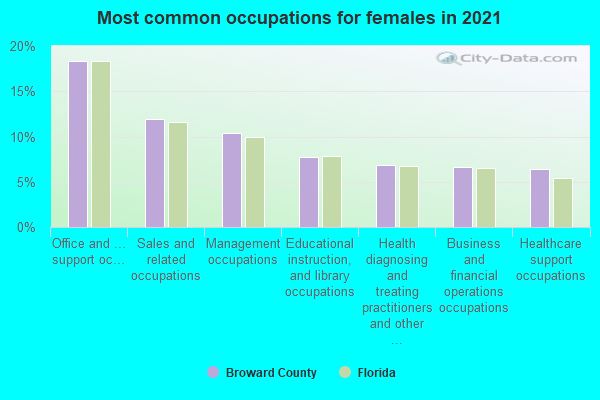
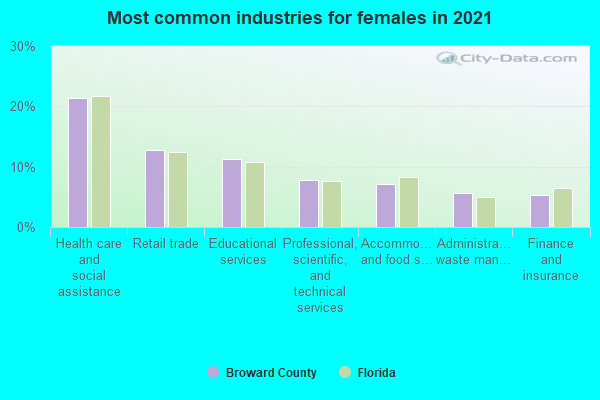
- Office and administrative support occupations (16%)
- Management occupations (12%)
- Sales and related occupations (11%)
- Health diagnosing and treating practitioners and other technical occupations (8%)
- Business and financial operations occupations (7%)
- Educational instruction, and library occupations (7%)
- Healthcare support occupations (6%)
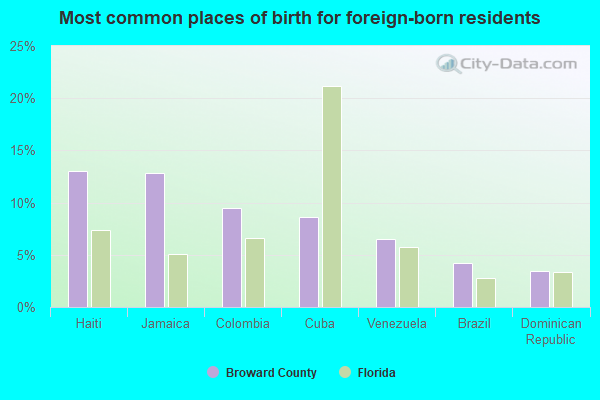
- Haiti (12%)
- Jamaica (12%)
- Colombia (10%)
- Cuba (9%)
- Venezuela (8%)
- Brazil (4%)
- Peru (4%)
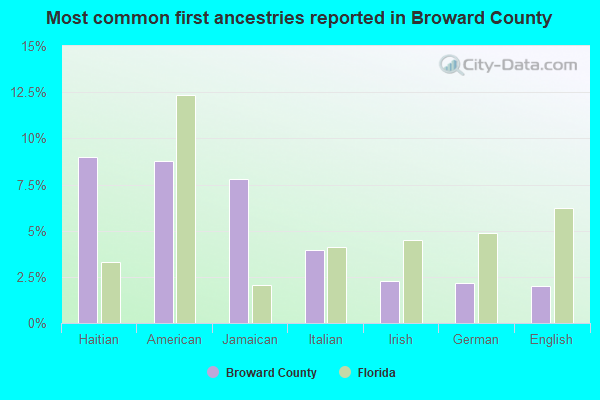
- Haitian (9%)
- American (7%)
- Jamaican (7%)
- Italian (4%)
- English (2%)
- German (2%)
- Irish (2%)
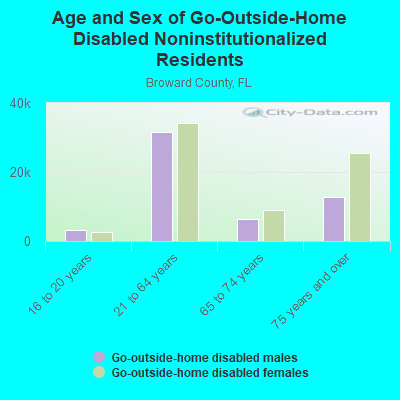
People in group quarters in Broward County, Florida in 2010:
- 4,261 people in local jails and other municipal confinement facilities
- 3,895 people in nursing facilities/skilled-nursing facilities
- 1,267 people in emergency and transitional shelters (with sleeping facilities) for people experiencing homelessness
- 1,239 people in group homes intended for adults
- 1,174 people in state prisons
- 1,152 people in college/university student housing
- 934 people in residential treatment centers for adults
- 772 people in other noninstitutional facilities
- 695 people in federal prisons
- 563 people in workers' group living quarters and job corps centers
- 260 people in correctional residential facilities
- 189 people in group homes for juveniles (non-correctional)
- 148 people in correctional facilities intended for juveniles
- 138 people in in-patient hospice facilities
- 100 people in residential treatment centers for juveniles (non-correctional)
- 60 people in mental (psychiatric) hospitals and psychiatric units in other hospitals
- 34 people in maritime/merchant vessels
- 11 people in hospitals with patients who have no usual home elsewhere
People in group quarters in Broward County, Florida in 2000:
- 5,644 people in nursing homes
- 5,131 people in local jails and other confinement facilities (including police lockups)
- 4,874 people in other noninstitutional group quarters
- 906 people in state prisons
- 524 people in other group homes
- 471 people in mental (psychiatric) hospitals or wards
- 309 people in homes or halfway houses for drug/alcohol abuse
- 279 people in college dormitories (includes college quarters off campus)
- 274 people in halfway houses
- 253 people in homes for the mentally ill
- 250 people in other nonhousehold living situations
- 181 people in other types of correctional institutions
- 139 people in homes for the mentally retarded
- 122 people in short-term care, detention or diagnostic centers for delinquent children
- 83 people in homes for the physically handicapped
- 79 people in training schools for juvenile delinquents
- 67 people in religious group quarters
- 61 people in homes for abused, dependent, and neglected children
- 54 people in hospitals/wards and hospices for chronically ill
- 51 people in hospices or homes for chronically ill
- 49 people in unknown juvenile institutions
- 47 people in agriculture workers' dormitories on farms
- 39 people in schools, hospitals, or wards for the intellectually disabled
- 29 people in crews of maritime vessels
- 24 people in wards in general hospitals for patients who have no usual home elsewhere
- 18 people in federal prisons and detention centers
- 10 people in hospitals or wards for drug/alcohol abuse
- 4 people in military barracks, etc.
- 3 people in military hospitals or wards for chronically ill
- 3 people in military ships
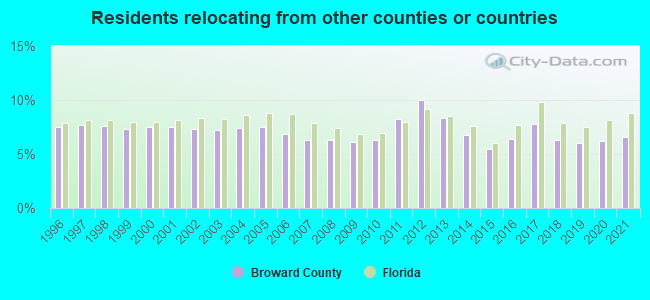
6.62% of this county's 2021 resident taxpayers lived in other counties in 2020 ($102,632 average adjusted gross income)
| Here: | 6.62% |
| Florida average: | 8.80% |
0.03% of residents moved from foreign countries ($231 average AGI)
Broward County: 0.03% Florida average: 0.05%
3.81% relocated from other counties in Florida ($37,804 average AGI)
2.78% relocated from other states ($64,597 average AGI)
Broward County: 2.78% Florida average: 4.38%
Top counties from which taxpayers relocated into this county between 2020 and 2021:
| from Miami-Dade County, FL | |
| from Palm Beach County, FL | |
| from Orange County, FL | |
| from Kings County, NY | |
| from New York County, NY | |
| from Queens County, NY | |
| from Hillsborough County, FL |
6.99% of this county's 2020 resident taxpayers moved to other counties in 2021 ($73,182 average adjusted gross income)
| Here: | 6.99% |
| Florida average: | 7.45% |
0.03% of residents moved to foreign countries ($336 average AGI)
Broward County: 0.03% Florida average: 0.04%
4.39% relocated to other counties in Florida ($42,051 average AGI)
2.57% relocated to other states ($30,795 average AGI)
Broward County: 2.57% Florida average: 2.97%

Top counties to which taxpayers relocated from this county between 2020 and 2021:
| to Miami-Dade County, FL | |
| to Palm Beach County, FL | |
| to St. Lucie County, FL | |
| to Orange County, FL | |
| to Hillsborough County, FL | |
| to Lee County, FL | |
| to Duval County, FL |
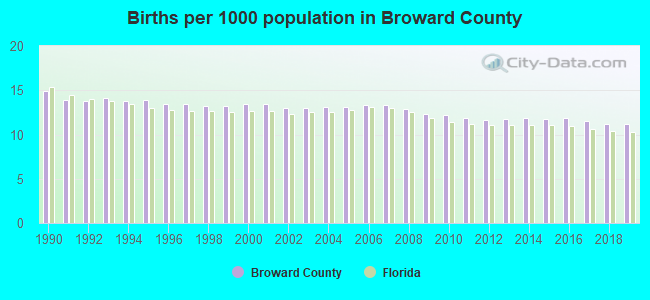
Births per 1000 population from 1990 to 1999: 13.8
Births per 1000 population from 2000 to 2009: 13.1
Births per 1000 population from 2010 to 2022: 9.8
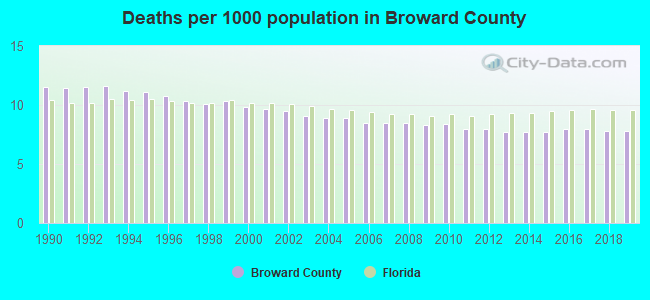
Deaths per 1000 population from 1990 to 1999: 11.0
Deaths per 1000 population from 2000 to 2009: 9.0
Deaths per 1000 population from 2010 to 2020: 8.0
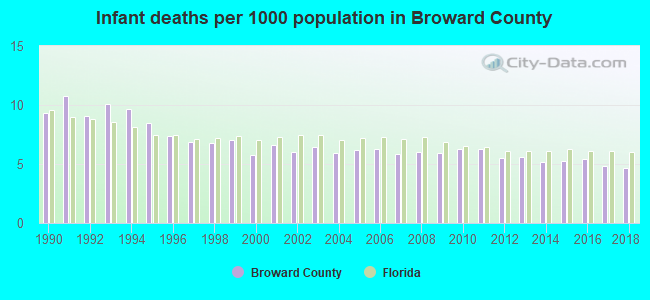
Infant deaths per 1000 live births from 1990 to 1999: 8.6
Infant deaths per 1000 live births from 2000 to 2009: 6.1
Infant deaths per 1000 live births from 2010 to 2021: 5.4
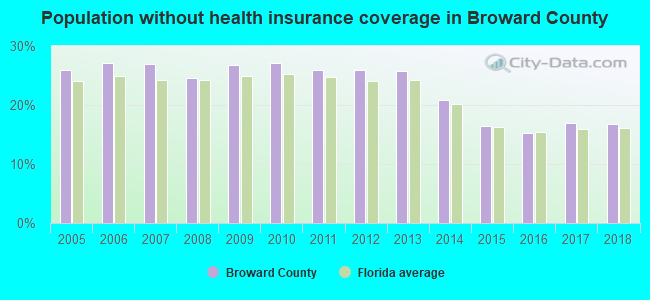
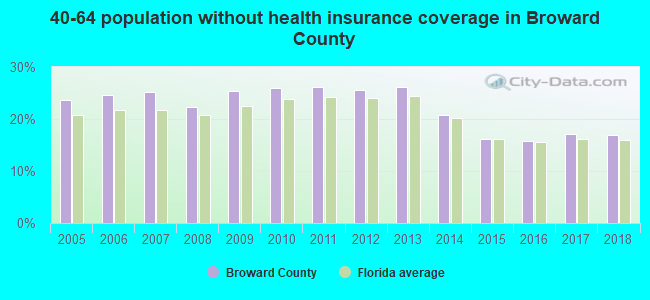
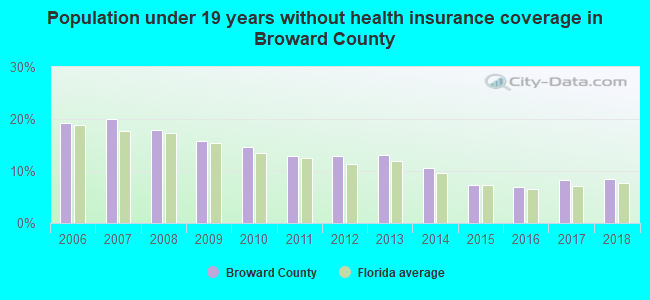
Persons under 19 years old without health insurance coverage in 2018: 8.4%
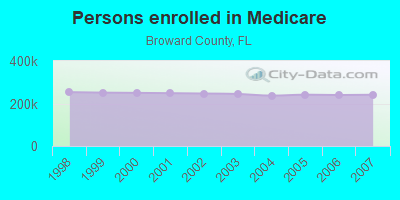
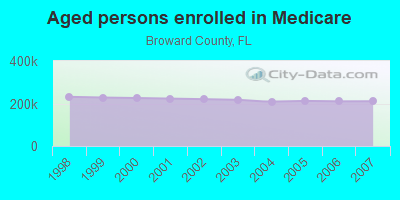
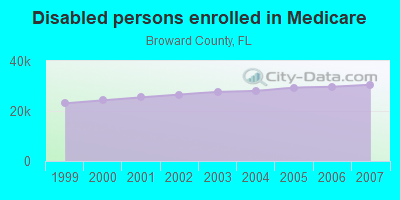
Persons enrolled in hospital insurance and/or supplemental medical insurance (Medicare) in July 1, 2007: 241,142 (210,632 aged, 30,510 disabled)
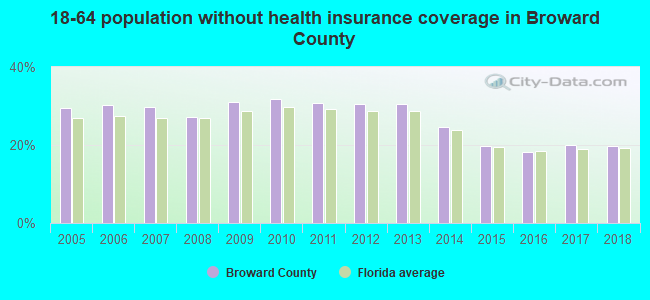
Children under 18 without health insurance coverage in 2007: 80,561 (19%)
Most common underlying causes of death in Broward County, Florida in 1999 - 2019:
- Atherosclerotic heart disease (31,196)
- Acute myocardial infarction, unspecified (18,141)
- Bronchus or lung, unspecified - Malignant neoplasms (18,112)
- Chronic obstructive pulmonary disease, unspecified (12,400)
- Atherosclerotic cardiovascular disease, so described (8,951)
- Stroke, not specified as haemorrhage or infarction (7,789)
- Alzheimer disease, unspecified (6,664)
- Colon, unspecified - Malignant neoplasms (6,072)
- Degenerative disease of nervous system, unspecified (5,986)
- Breast, unspecified - Malignant neoplasms (5,606)
Population without health insurance coverage in 2000: 16%
Children under 18 without health insurance coverage in 2000: 16%
Short term general hospital admissions per 100,000 population in 2004: 12,941
Short term general hospital beds per 100,000 population in 2004: 280
Emergency room visits per 100,000 population in 2004: 40,514
General practice office based MDs per 100,000 population in 2005: 1,382
Medical specialist MDs per 100,000 population in 2005: 882
Dentists per 100,000 population in 1998: 6
Total births per 100,000 population, July 2005 - July 2006 : 48
Total deaths per 100,000 population, July 2005 - July 2006: 80
Limited-service eating places per 100,000 population in 2005 : 12
Fitness & recreation sports centers per 100,000 population in 2005: 11,238
EPA green book nonattainment status in 2004-2006: 1
Homicides per 1,000,000 population from 2000 to 2006: 49.1. This is less than state average.
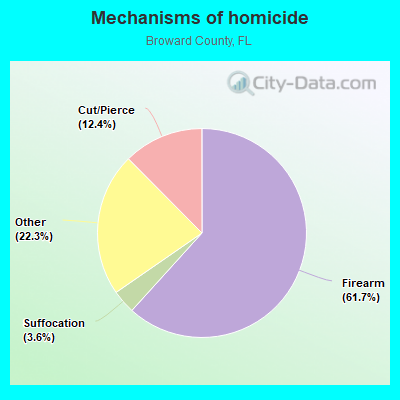
- Firearm - 30.3
- Cut/Pierce - 6.1
- Suffocation - 1.8
- Other - 10.9
Suicides per 1,000,000 population from 2000 to 2006: 125.1. This is less than state average.
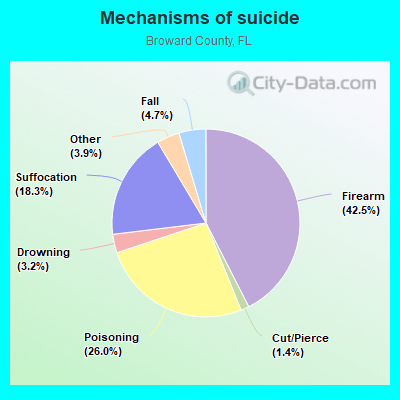
- Firearm - 53.2
- Poisoning - 32.5
- Suffocation - 23.0
- Fall - 5.8
- Drowning - 4.0
- Cut/Pierce - 1.8
- Other - 4.9
Household type by relationship:
Households: 1,947,026- Male householders: 357,449 (100,952 living alone), Female householders: 395,635 (115,864 living alone)
325,534 spouses (318,181 opposite-sex spouses), 54,100 unmarried partners, (50,902 opposite-sex unmarried partners), 566,067 children (536,275 natural, 9,741 adopted, 20,051 stepchildren), 36,561 grandchildren, 30,565 brothers or sisters, 51,966 parents, 769 foster children, 52,000 other relatives, 57,570 non-relatives
- In group quarters: 18,810
Size of family households: 201,430 2-persons, 123,987 3-persons, 99,232 4-persons, 35,550 5-persons, 15,587 6-persons, 10,567 7-or-more-persons.
Size of nonfamily households: 216,816 1-person, 43,701 2-persons, 3,839 3-persons, 1,865 4-persons, 342 5-persons, 168 6-persons.
225,791 married couples with children.
128,850 single-parent households (29,153 men, 99,697 women).
56.0% of residents of Broward speak English at home.
28.5% of residents speak Spanish at home (59% speak English very well, 19% speak English well, 14% speak English not well, 8% don't speak English at all).
11.9% of residents speak other Indo-European language at home (62% speak English very well, 21% speak English well, 13% speak English not well, 4% don't speak English at all).
1.8% of residents speak Asian or Pacific Island language at home (56% speak English very well, 27% speak English well, 12% speak English not well, 4% don't speak English at all).
1.8% of residents speak other language at home (82% speak English very well, 12% speak English well, 6% speak English not well).
In fiscal year 2004:
Federal Government expenditure: $8,767,967,000 ($4,996 per capita)
Department of Defense expenditure: $469,063,000
Federal direct payments to individuals for retirement and disability: $3,580,118,000
Federal other direct payments to individuals: $3,224,584,000
Federal direct payments not to individuals: $10,723,000
Federal grants: $913,174,000
Federal procurement contracts: $489,453,000 ($330,511,000 Department of Defense)
Federal salaries and wages: $549,916,000 ($34,472,000 Department of Defense)
Federal Government direct loans: $11,222,000
Federal guaranteed/insured loans: $717,230,000
Federal Government insurance: $69,970,130,000
Population change from April 1, 2000 to July 1, 2005:
Births: 120,738| Here: | 68 per 1000 residents |
| State: | 63 per 1000 residents |
Deaths: 82,427
| Here: | 46 per 1000 residents |
| State: | 49 per 1000 residents |
Net international migration: +82,027
| Here: | +46 per 1000 residents |
| State: | +30 per 1000 residents |
Net internal migration: +36,632
| Here: | +21 per 1000 residents |
| State: | +59 per 1000 residents |
Total withdrawal of fresh water for public supply: 258.06 millions of gallons per day (all from ground)
| Here: | 5.3 |
| State: | 5.9 |
| Here: | 3.8 |
| State: | 4.2 |
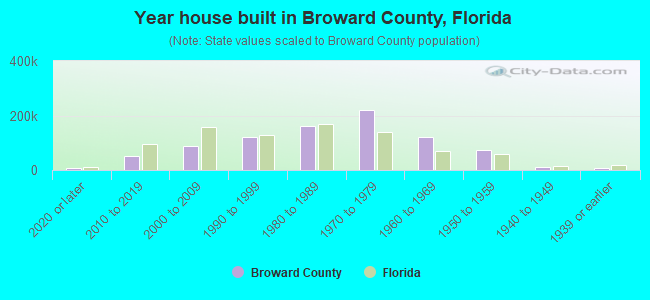
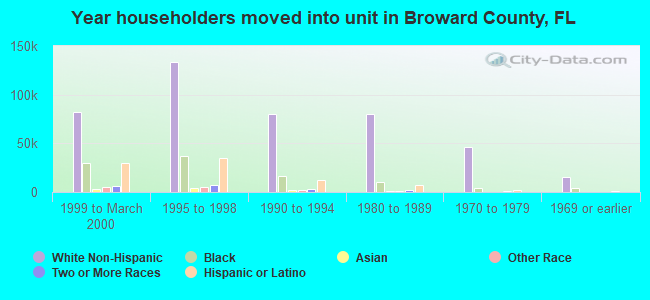
- Year house built in Broward County, Florida
- 11,1822020 or later
- 54,6812010 to 2019
- 97,4372000 to 2009
- 116,6351990 to 1999
- 152,2951980 to 1989
- 226,4651970 to 1979
- 115,1281960 to 1969
- 79,4361950 to 1959
- 8,8901940 to 1949
- 5,0461939 or earlier
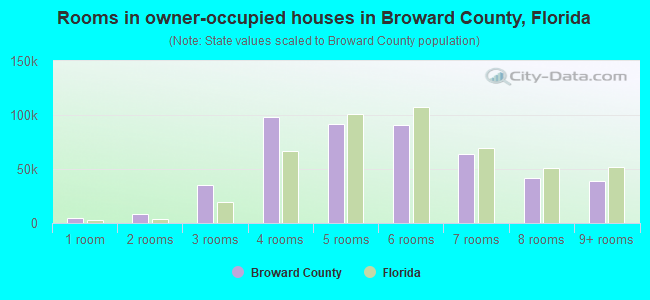
- Rooms in owner-occupied houses in Broward County, Florida
- 4,8161 room
- 5,6372 rooms
- 36,9183 rooms
- 105,9674 rooms
- 98,1095 rooms
- 86,0056 rooms
- 54,1927 rooms
- 43,7098 rooms
- 36,3849+ rooms

- Rooms in renter-occupied apartments in Broward County, Florida
- 14,9241 room
- 23,1212 rooms
- 71,0673 rooms
- 91,0824 rooms
- 43,7355 rooms
- 23,8086 rooms
- 8,2977 rooms
- 3,6308 rooms
- 1,6839+ rooms
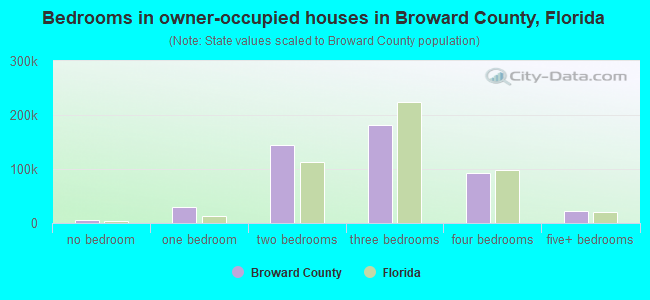
- Bedrooms in owner-occupied houses in Broward County, Florida
- 5,360no bedroom
- 25,9221 bedroom
- 152,5932 bedrooms
- 177,6183 bedrooms
- 84,6854 bedrooms
- 25,5595+ bedrooms
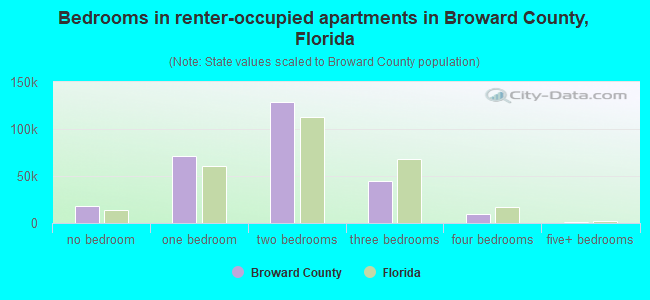
- Bedrooms in renter-occupied apartments in Broward County, Florida
- 16,043no bedroom
- 76,9821 bedroom
- 122,8052 bedrooms
- 51,7223 bedrooms
- 12,5514 bedrooms
- 1,2445+ bedrooms
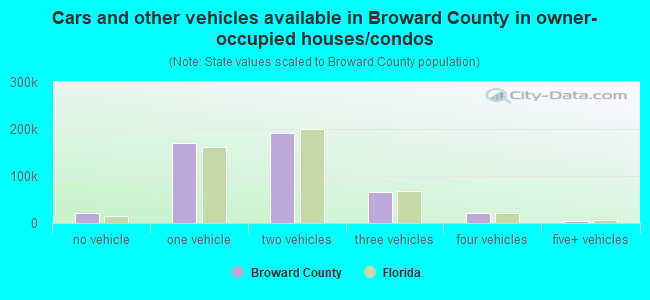
- Cars and other vehicles available in Broward County in owner-occupied houses/condos
- 20,145no vehicle
- 169,9231 vehicle
- 190,2212 vehicles
- 65,4433 vehicles
- 19,9924 vehicles
- 6,0135+ vehicles
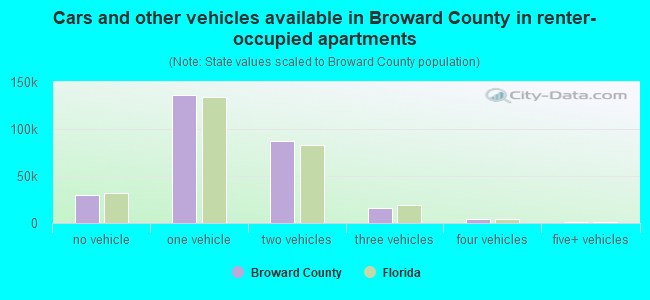
- Cars and other vehicles available in Broward County in renter-occupied apartments
- 34,491no vehicle
- 134,9531 vehicle
- 88,0462 vehicles
- 18,5593 vehicles
- 3,5974 vehicles
- 1,7015+ vehicles
87.5% of Broward County residents lived in the same house 1 years ago.
Out of people who lived in different houses, 38% lived in this county.
Out of people who lived in different counties, 55% lived in Florida.
| Broward County: | 87.5% |
| State average: | 86.3% |
Place of birth for U.S.-born residents:
- This state: 675,432
- Other state: 478,890
- Northeast: 276,088
- Midwest: 86,545
- South: 89,991
- West: 26,266
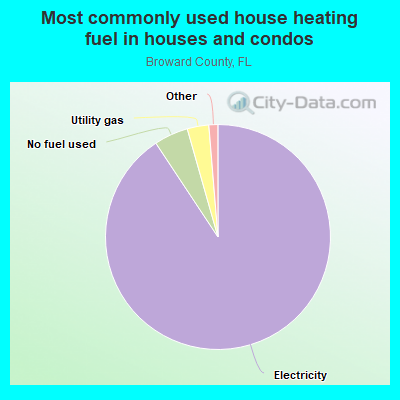
- 90.7%Electricity
- 5.3%No fuel used
- 3.0%Utility gas
- 0.7%Bottled, tank, or LP gas
- 0.3%Solar energy
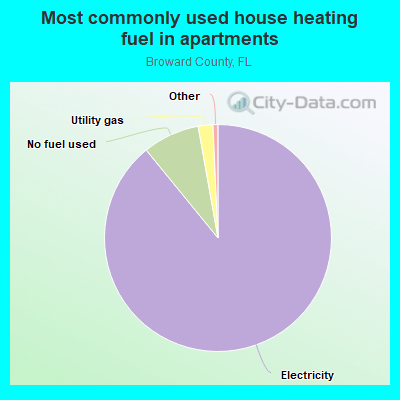
- 91.7%Electricity
- 5.3%No fuel used
- 2.4%Utility gas
- 0.6%Bottled, tank, or LP gas
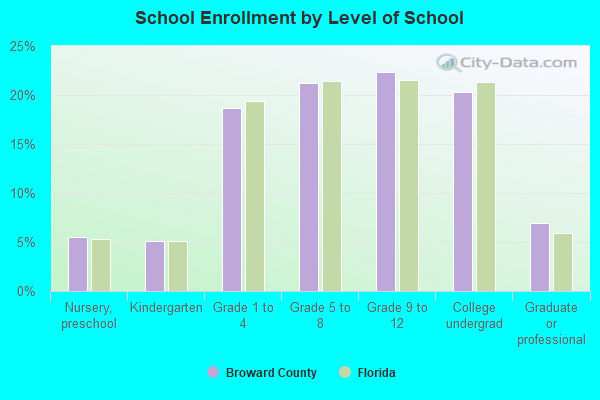
Private vs. public school enrollment:
| Here: | 16.6% |
| Florida: | 15.8% |
| Here: | 15.9% |
| Florida: | 12.9% |
| Here: | 25.6% |
| Florida: | 23.6% |
Broward County government finances - Expenditure in 2018:
- Bond Funds - Cash and Securities: $647,625,000
Cash and Securities: $638,544,000
- Charges - Other: $456,579,000
Other: $422,647,000
Air Transportation: $306,141,000
Air Transportation: $245,835,000
Sea and Inland Port Facilities: $170,744,000
Sea and Inland Port Facilities: $161,733,000
Sewerage: $83,942,000
Sewerage: $79,411,000
Parks and Recreation: $15,607,000
Parks and Recreation: $15,589,000
Solid Waste Management: $14,439,000
Solid Waste Management: $11,484,000
Regular Highways: $4,563,000
Natural Resources - Other: $3,939,000
Housing and Community Development: $3,076,000
Housing and Community Development: $2,449,000
Natural Resources - Other: $2,304,000
Regular Highways: $2,298,000
Parking Facilities: $1,772,000
Parking Facilities: $1,695,000
- Construction - Air Transportation: $343,127,000
Air Transportation: $222,681,000
General - Other: $84,765,000
Regular Highways: $51,121,000
Parks and Recreation: $43,161,000
Regular Highways: $42,394,000
General - Other: $40,150,000
Parks and Recreation: $36,651,000
Health - Other: $17,031,000
Transit Utilities: $16,843,000
Transit Utilities: $15,707,000
Financial Administration: $15,612,000
Natural Resources - Other: $11,044,000
Libraries: $10,055,000
Libraries: $8,810,000
Financial Administration: $4,903,000
General Public Buildings: $4,547,000
Natural Resources - Other: $3,561,000
Health - Other: $1,098,000
General Public Buildings: $461,000
- Current Operations - Police Protection: $516,339,000
Police Protection: $474,491,000
Correctional Institutions: $241,999,000
Correctional Institutions: $222,521,000
General - Other: $214,630,000
Air Transportation: $196,692,000
Air Transportation: $162,031,000
Transit Utilities: $150,821,000
Local Fire Protection: $140,894,000
Transit Utilities: $136,715,000
Local Fire Protection: $123,436,000
Sea and Inland Port Facilities: $105,754,000
Parks and Recreation: $98,944,000
Financial Administration: $98,467,000
Sea and Inland Port Facilities: $88,572,000
Public Welfare - Other: $85,713,000
Financial Administration: $85,518,000
Parks and Recreation: $83,090,000
Public Welfare - Other: $77,739,000
Health - Other: $69,326,000
Libraries: $64,578,000
Judicial and Legal Services: $62,549,000
Judicial and Legal Services: $58,797,000
Health - Other: $58,095,000
General - Other: $55,861,000
Libraries: $55,183,000
Sewerage: $50,903,000
Sewerage: $46,592,000
Regular Highways: $30,267,000
Water Utilities: $28,712,000
Water Utilities: $26,281,000
Regular Highways: $26,048,000
Central Staff Services: $24,481,000
Central Staff Services: $20,632,000
Natural Resources - Other: $18,571,000
Natural Resources - Other: $18,231,000
Solid Waste Management: $16,786,000
Solid Waste Management: $15,387,000
Housing and Community Development: $12,713,000
Housing and Community Development: $9,816,000
- Federal Intergovernmental - Other: $123,472,000
Other: $58,813,000
Health and Hospitals: $26,856,000
Air Transportation: $22,274,000
Public Welfare: $18,462,000
Air Transportation: $15,984,000
Health and Hospitals: $15,293,000
Transit Utilities: $14,725,000
Transit Utilities: $13,315,000
Public Welfare: $8,141,000
Highways: $635,000
Highways: $76,000
- General - Interest on Debt: $122,443,000
Interest on Debt: $97,125,000
- Local Intergovernmental - Other: $9,664,000
Other: $9,125,000
Public Welfare: $1,065,000
Public Welfare: $278,000
- Long Term Debt - Outstanding Unspecified Public Purpose: $3,464,525,000
Beginning Outstanding - Unspecified Public Purpose: $3,194,670,000
Beginning Outstanding - Unspecified Public Purpose: $3,146,705,000
Outstanding Unspecified Public Purpose: $3,020,660,000
Issue, Unspecified Public Purpose: $530,670,000
Outstanding Nonguaranteed - Industrial Revenue: $288,007,000
Retired Unspecified Public Purpose: $260,815,000
Beginning Outstanding - Public Debt for Private Purpose: $259,769,000
Beginning Outstanding - Public Debt for Private Purpose: $253,715,000
Retired Unspecified Public Purpose: $198,035,000
Outstanding Nonguaranteed - Industrial Revenue: $197,647,000
Issue, Unspecified Public Purpose: $71,990,000
Retired Nonguaranteed - Public Debt for Private Purpose: $56,068,000
Retired Nonguaranteed - Public Debt for Private Purpose: $28,238,000
- Miscellaneous - General Revenue - Other: $130,389,000
General Revenue - Other: $106,832,000
Interest Earnings: $85,358,000
Fines and Forfeits: $24,709,000
Fines and Forfeits: $21,767,000
Interest Earnings: $17,168,000
Special Assessments: $12,225,000
Special Assessments: $11,142,000
Sale of Property: $2,835,000
Sale of Property: $2,738,000
Rents: $2,660,000
Rents: $2,501,000
- Other Capital Outlay - Police Protection: $26,693,000
Police Protection: $17,188,000
Judicial and Legal Services: $8,885,000
Correctional Institutions: $5,740,000
Judicial and Legal Services: $4,315,000
Local Fire Protection: $4,067,000
Correctional Institutions: $3,980,000
Local Fire Protection: $2,213,000
Housing and Community Development: $2,167,000
Housing and Community Development: $1,621,000
Public Welfare - Other: $669,000
Central Staff Services: $482,000
Public Welfare - Other: $475,000
Central Staff Services: $39,000
Parking Facilities: $18,000
- Other Funds - Cash and Securities: $2,741,484,000
Cash and Securities: $2,041,125,000
- Revenue - Water Utilities: $54,856,000
Water Utilities: $50,620,000
Transit Utilities: $29,752,000
Transit Utilities: $26,425,000
- Sinking Funds - Cash and Securities: $308,537,000
Cash and Securities: $214,915,000
- State Intergovernmental - General Local Government Support: $120,293,000
General Local Government Support: $112,617,000
Other: $53,254,000
Other: $39,346,000
Highways: $27,818,000
Highways: $27,795,000
Transit Utilities: $18,918,000
Transit Utilities: $16,789,000
Public Welfare: $11,075,000
Public Welfare: $7,702,000
Health and Hospitals: $4,387,000
Housing and Community Development: $1,999,000
Housing and Community Development: $1,569,000
Health and Hospitals: $1,474,000
- Tax - Property: $1,032,202,000
Property: $891,984,000
General Sales and Gross Receipts: $282,631,000
Other Selective Sales: $88,375,000
Motor Fuels Sales: $67,825,000
Motor Fuels Sales: $66,795,000
Other Selective Sales: $62,940,000
Other License: $13,665,000
Other License: $12,185,000
Documentary and Stock Transfer: $10,173,000
Documentary and Stock Transfer: $9,978,000
Public Utilities Sales: $4,234,000
Public Utilities Sales: $4,109,000
Occupation and Business License - Other: $1,893,000
Occupation and Business License - Other: $1,703,000
- Total Salaries and Wages: $499,000
: $440,000
- Water Utilities - Interest on Debt: $19,293,000
Interest on Debt: $15,699,000
Broward County government finances - Revenue in 2018:
- Bond Funds - Cash and Securities: $647,625,000
Cash and Securities: $638,544,000
- Charges - Other: $456,579,000
Other: $422,647,000
Air Transportation: $306,141,000
Air Transportation: $245,835,000
Sea and Inland Port Facilities: $170,744,000
Sea and Inland Port Facilities: $161,733,000
Sewerage: $83,942,000
Sewerage: $79,411,000
Parks and Recreation: $15,607,000
Parks and Recreation: $15,589,000
Solid Waste Management: $14,439,000
Solid Waste Management: $11,484,000
Regular Highways: $4,563,000
Natural Resources - Other: $3,939,000
Housing and Community Development: $3,076,000
Housing and Community Development: $2,449,000
Natural Resources - Other: $2,304,000
Regular Highways: $2,298,000
Parking Facilities: $1,772,000
Parking Facilities: $1,695,000
- Construction - Air Transportation: $343,127,000
Air Transportation: $222,681,000
General - Other: $84,765,000
Regular Highways: $51,121,000
Parks and Recreation: $43,161,000
Regular Highways: $42,394,000
General - Other: $40,150,000
Parks and Recreation: $36,651,000
Health - Other: $17,031,000
Transit Utilities: $16,843,000
Transit Utilities: $15,707,000
Financial Administration: $15,612,000
Natural Resources - Other: $11,044,000
Libraries: $10,055,000
Libraries: $8,810,000
Financial Administration: $4,903,000
General Public Buildings: $4,547,000
Natural Resources - Other: $3,561,000
Health - Other: $1,098,000
General Public Buildings: $461,000
- Current Operations - Police Protection: $516,339,000
Police Protection: $474,491,000
Correctional Institutions: $241,999,000
Correctional Institutions: $222,521,000
General - Other: $214,630,000
Air Transportation: $196,692,000
Air Transportation: $162,031,000
Transit Utilities: $150,821,000
Local Fire Protection: $140,894,000
Transit Utilities: $136,715,000
Local Fire Protection: $123,436,000
Sea and Inland Port Facilities: $105,754,000
Parks and Recreation: $98,944,000
Financial Administration: $98,467,000
Sea and Inland Port Facilities: $88,572,000
Public Welfare - Other: $85,713,000
Financial Administration: $85,518,000
Parks and Recreation: $83,090,000
Public Welfare - Other: $77,739,000
Health - Other: $69,326,000
Libraries: $64,578,000
Judicial and Legal Services: $62,549,000
Judicial and Legal Services: $58,797,000
Health - Other: $58,095,000
General - Other: $55,861,000
Libraries: $55,183,000
Sewerage: $50,903,000
Sewerage: $46,592,000
Regular Highways: $30,267,000
Water Utilities: $28,712,000
Water Utilities: $26,281,000
Regular Highways: $26,048,000
Central Staff Services: $24,481,000
Central Staff Services: $20,632,000
Natural Resources - Other: $18,571,000
Natural Resources - Other: $18,231,000
Solid Waste Management: $16,786,000
Solid Waste Management: $15,387,000
Housing and Community Development: $12,713,000
Housing and Community Development: $9,816,000
- Federal Intergovernmental - Other: $123,472,000
Other: $58,813,000
Health and Hospitals: $26,856,000
Air Transportation: $22,274,000
Public Welfare: $18,462,000
Air Transportation: $15,984,000
Health and Hospitals: $15,293,000
Transit Utilities: $14,725,000
Transit Utilities: $13,315,000
Public Welfare: $8,141,000
Highways: $635,000
Highways: $76,000
- General - Interest on Debt: $122,443,000
Interest on Debt: $97,125,000
- Local Intergovernmental - Other: $9,664,000
Other: $9,125,000
Public Welfare: $1,065,000
Public Welfare: $278,000
- Long Term Debt - Outstanding Unspecified Public Purpose: $3,464,525,000
Beginning Outstanding - Unspecified Public Purpose: $3,194,670,000
Beginning Outstanding - Unspecified Public Purpose: $3,146,705,000
Outstanding Unspecified Public Purpose: $3,020,660,000
Issue, Unspecified Public Purpose: $530,670,000
Outstanding Nonguaranteed - Industrial Revenue: $288,007,000
Retired Unspecified Public Purpose: $260,815,000
Beginning Outstanding - Public Debt for Private Purpose: $259,769,000
Beginning Outstanding - Public Debt for Private Purpose: $253,715,000
Retired Unspecified Public Purpose: $198,035,000
Outstanding Nonguaranteed - Industrial Revenue: $197,647,000
Issue, Unspecified Public Purpose: $71,990,000
Retired Nonguaranteed - Public Debt for Private Purpose: $56,068,000
Retired Nonguaranteed - Public Debt for Private Purpose: $28,238,000
- Miscellaneous - General Revenue - Other: $130,389,000
General Revenue - Other: $106,832,000
Interest Earnings: $85,358,000
Fines and Forfeits: $24,709,000
Fines and Forfeits: $21,767,000
Interest Earnings: $17,168,000
Special Assessments: $12,225,000
Special Assessments: $11,142,000
Sale of Property: $2,835,000
Sale of Property: $2,738,000
Rents: $2,660,000
Rents: $2,501,000
- Other Capital Outlay - Police Protection: $26,693,000
Police Protection: $17,188,000
Judicial and Legal Services: $8,885,000
Correctional Institutions: $5,740,000
Judicial and Legal Services: $4,315,000
Local Fire Protection: $4,067,000
Correctional Institutions: $3,980,000
Local Fire Protection: $2,213,000
Housing and Community Development: $2,167,000
Housing and Community Development: $1,621,000
Public Welfare - Other: $669,000
Central Staff Services: $482,000
Public Welfare - Other: $475,000
Central Staff Services: $39,000
Parking Facilities: $18,000
- Other Funds - Cash and Securities: $2,741,484,000
Cash and Securities: $2,041,125,000
- Revenue - Water Utilities: $54,856,000
Water Utilities: $50,620,000
Transit Utilities: $29,752,000
Transit Utilities: $26,425,000
- Sinking Funds - Cash and Securities: $308,537,000
Cash and Securities: $214,915,000
- State Intergovernmental - General Local Government Support: $120,293,000
General Local Government Support: $112,617,000
Other: $53,254,000
Other: $39,346,000
Highways: $27,818,000
Highways: $27,795,000
Transit Utilities: $18,918,000
Transit Utilities: $16,789,000
Public Welfare: $11,075,000
Public Welfare: $7,702,000
Health and Hospitals: $4,387,000
Housing and Community Development: $1,999,000
Housing and Community Development: $1,569,000
Health and Hospitals: $1,474,000
- Tax - Property: $1,032,202,000
Property: $891,984,000
General Sales and Gross Receipts: $282,631,000
Other Selective Sales: $88,375,000
Motor Fuels Sales: $67,825,000
Motor Fuels Sales: $66,795,000
Other Selective Sales: $62,940,000
Other License: $13,665,000
Other License: $12,185,000
Documentary and Stock Transfer: $10,173,000
Documentary and Stock Transfer: $9,978,000
Public Utilities Sales: $4,234,000
Public Utilities Sales: $4,109,000
Occupation and Business License - Other: $1,893,000
Occupation and Business License - Other: $1,703,000
- Total Salaries and Wages: $499,000
: $440,000
- Water Utilities - Interest on Debt: $19,293,000
Interest on Debt: $15,699,000
Broward County government finances - Debt in 2018:
- Bond Funds - Cash and Securities: $647,625,000
Cash and Securities: $638,544,000
- Charges - Other: $456,579,000
Other: $422,647,000
Air Transportation: $306,141,000
Air Transportation: $245,835,000
Sea and Inland Port Facilities: $170,744,000
Sea and Inland Port Facilities: $161,733,000
Sewerage: $83,942,000
Sewerage: $79,411,000
Parks and Recreation: $15,607,000
Parks and Recreation: $15,589,000
Solid Waste Management: $14,439,000
Solid Waste Management: $11,484,000
Regular Highways: $4,563,000
Natural Resources - Other: $3,939,000
Housing and Community Development: $3,076,000
Housing and Community Development: $2,449,000
Natural Resources - Other: $2,304,000
Regular Highways: $2,298,000
Parking Facilities: $1,772,000
Parking Facilities: $1,695,000
- Construction - Air Transportation: $343,127,000
Air Transportation: $222,681,000
General - Other: $84,765,000
Regular Highways: $51,121,000
Parks and Recreation: $43,161,000
Regular Highways: $42,394,000
General - Other: $40,150,000
Parks and Recreation: $36,651,000
Health - Other: $17,031,000
Transit Utilities: $16,843,000
Transit Utilities: $15,707,000
Financial Administration: $15,612,000
Natural Resources - Other: $11,044,000
Libraries: $10,055,000
Libraries: $8,810,000
Financial Administration: $4,903,000
General Public Buildings: $4,547,000
Natural Resources - Other: $3,561,000
Health - Other: $1,098,000
General Public Buildings: $461,000
- Current Operations - Police Protection: $516,339,000
Police Protection: $474,491,000
Correctional Institutions: $241,999,000
Correctional Institutions: $222,521,000
General - Other: $214,630,000
Air Transportation: $196,692,000
Air Transportation: $162,031,000
Transit Utilities: $150,821,000
Local Fire Protection: $140,894,000
Transit Utilities: $136,715,000
Local Fire Protection: $123,436,000
Sea and Inland Port Facilities: $105,754,000
Parks and Recreation: $98,944,000
Financial Administration: $98,467,000
Sea and Inland Port Facilities: $88,572,000
Public Welfare - Other: $85,713,000
Financial Administration: $85,518,000
Parks and Recreation: $83,090,000
Public Welfare - Other: $77,739,000
Health - Other: $69,326,000
Libraries: $64,578,000
Judicial and Legal Services: $62,549,000
Judicial and Legal Services: $58,797,000
Health - Other: $58,095,000
General - Other: $55,861,000
Libraries: $55,183,000
Sewerage: $50,903,000
Sewerage: $46,592,000
Regular Highways: $30,267,000
Water Utilities: $28,712,000
Water Utilities: $26,281,000
Regular Highways: $26,048,000
Central Staff Services: $24,481,000
Central Staff Services: $20,632,000
Natural Resources - Other: $18,571,000
Natural Resources - Other: $18,231,000
Solid Waste Management: $16,786,000
Solid Waste Management: $15,387,000
Housing and Community Development: $12,713,000
Housing and Community Development: $9,816,000
- Federal Intergovernmental - Other: $123,472,000
Other: $58,813,000
Health and Hospitals: $26,856,000
Air Transportation: $22,274,000
Public Welfare: $18,462,000
Air Transportation: $15,984,000
Health and Hospitals: $15,293,000
Transit Utilities: $14,725,000
Transit Utilities: $13,315,000
Public Welfare: $8,141,000
Highways: $635,000
Highways: $76,000
- General - Interest on Debt: $122,443,000
Interest on Debt: $97,125,000
- Local Intergovernmental - Other: $9,664,000
Other: $9,125,000
Public Welfare: $1,065,000
Public Welfare: $278,000
- Long Term Debt - Outstanding Unspecified Public Purpose: $3,464,525,000
Beginning Outstanding - Unspecified Public Purpose: $3,194,670,000
Beginning Outstanding - Unspecified Public Purpose: $3,146,705,000
Outstanding Unspecified Public Purpose: $3,020,660,000
Issue, Unspecified Public Purpose: $530,670,000
Outstanding Nonguaranteed - Industrial Revenue: $288,007,000
Retired Unspecified Public Purpose: $260,815,000
Beginning Outstanding - Public Debt for Private Purpose: $259,769,000
Beginning Outstanding - Public Debt for Private Purpose: $253,715,000
Retired Unspecified Public Purpose: $198,035,000
Outstanding Nonguaranteed - Industrial Revenue: $197,647,000
Issue, Unspecified Public Purpose: $71,990,000
Retired Nonguaranteed - Public Debt for Private Purpose: $56,068,000
Retired Nonguaranteed - Public Debt for Private Purpose: $28,238,000
- Miscellaneous - General Revenue - Other: $130,389,000
General Revenue - Other: $106,832,000
Interest Earnings: $85,358,000
Fines and Forfeits: $24,709,000
Fines and Forfeits: $21,767,000
Interest Earnings: $17,168,000
Special Assessments: $12,225,000
Special Assessments: $11,142,000
Sale of Property: $2,835,000
Sale of Property: $2,738,000
Rents: $2,660,000
Rents: $2,501,000
- Other Capital Outlay - Police Protection: $26,693,000
Police Protection: $17,188,000
Judicial and Legal Services: $8,885,000
Correctional Institutions: $5,740,000
Judicial and Legal Services: $4,315,000
Local Fire Protection: $4,067,000
Correctional Institutions: $3,980,000
Local Fire Protection: $2,213,000
Housing and Community Development: $2,167,000
Housing and Community Development: $1,621,000
Public Welfare - Other: $669,000
Central Staff Services: $482,000
Public Welfare - Other: $475,000
Central Staff Services: $39,000
Parking Facilities: $18,000
- Other Funds - Cash and Securities: $2,741,484,000
Cash and Securities: $2,041,125,000
- Revenue - Water Utilities: $54,856,000
Water Utilities: $50,620,000
Transit Utilities: $29,752,000
Transit Utilities: $26,425,000
- Sinking Funds - Cash and Securities: $308,537,000
Cash and Securities: $214,915,000
- State Intergovernmental - General Local Government Support: $120,293,000
General Local Government Support: $112,617,000
Other: $53,254,000
Other: $39,346,000
Highways: $27,818,000
Highways: $27,795,000
Transit Utilities: $18,918,000
Transit Utilities: $16,789,000
Public Welfare: $11,075,000
Public Welfare: $7,702,000
Health and Hospitals: $4,387,000
Housing and Community Development: $1,999,000
Housing and Community Development: $1,569,000
Health and Hospitals: $1,474,000
- Tax - Property: $1,032,202,000
Property: $891,984,000
General Sales and Gross Receipts: $282,631,000
Other Selective Sales: $88,375,000
Motor Fuels Sales: $67,825,000
Motor Fuels Sales: $66,795,000
Other Selective Sales: $62,940,000
Other License: $13,665,000
Other License: $12,185,000
Documentary and Stock Transfer: $10,173,000
Documentary and Stock Transfer: $9,978,000
Public Utilities Sales: $4,234,000
Public Utilities Sales: $4,109,000
Occupation and Business License - Other: $1,893,000
Occupation and Business License - Other: $1,703,000
- Total Salaries and Wages: $499,000
: $440,000
- Water Utilities - Interest on Debt: $19,293,000
Interest on Debt: $15,699,000
Broward County government finances - Cash and Securities in 2018:
- Bond Funds - Cash and Securities: $647,625,000
Cash and Securities: $638,544,000
- Charges - Other: $456,579,000
Other: $422,647,000
Air Transportation: $306,141,000
Air Transportation: $245,835,000
Sea and Inland Port Facilities: $170,744,000
Sea and Inland Port Facilities: $161,733,000
Sewerage: $83,942,000
Sewerage: $79,411,000
Parks and Recreation: $15,607,000
Parks and Recreation: $15,589,000
Solid Waste Management: $14,439,000
Solid Waste Management: $11,484,000
Regular Highways: $4,563,000
Natural Resources - Other: $3,939,000
Housing and Community Development: $3,076,000
Housing and Community Development: $2,449,000
Natural Resources - Other: $2,304,000
Regular Highways: $2,298,000
Parking Facilities: $1,772,000
Parking Facilities: $1,695,000
- Construction - Air Transportation: $343,127,000
Air Transportation: $222,681,000
General - Other: $84,765,000
Regular Highways: $51,121,000
Parks and Recreation: $43,161,000
Regular Highways: $42,394,000
General - Other: $40,150,000
Parks and Recreation: $36,651,000
Health - Other: $17,031,000
Transit Utilities: $16,843,000
Transit Utilities: $15,707,000
Financial Administration: $15,612,000
Natural Resources - Other: $11,044,000
Libraries: $10,055,000
Libraries: $8,810,000
Financial Administration: $4,903,000
General Public Buildings: $4,547,000
Natural Resources - Other: $3,561,000
Health - Other: $1,098,000
General Public Buildings: $461,000
- Current Operations - Police Protection: $516,339,000
Police Protection: $474,491,000
Correctional Institutions: $241,999,000
Correctional Institutions: $222,521,000
General - Other: $214,630,000
Air Transportation: $196,692,000
Air Transportation: $162,031,000
Transit Utilities: $150,821,000
Local Fire Protection: $140,894,000
Transit Utilities: $136,715,000
Local Fire Protection: $123,436,000
Sea and Inland Port Facilities: $105,754,000
Parks and Recreation: $98,944,000
Financial Administration: $98,467,000
Sea and Inland Port Facilities: $88,572,000
Public Welfare - Other: $85,713,000
Financial Administration: $85,518,000
Parks and Recreation: $83,090,000
Public Welfare - Other: $77,739,000
Health - Other: $69,326,000
Libraries: $64,578,000
Judicial and Legal Services: $62,549,000
Judicial and Legal Services: $58,797,000
Health - Other: $58,095,000
General - Other: $55,861,000
Libraries: $55,183,000
Sewerage: $50,903,000
Sewerage: $46,592,000
Regular Highways: $30,267,000
Water Utilities: $28,712,000
Water Utilities: $26,281,000
Regular Highways: $26,048,000
Central Staff Services: $24,481,000
Central Staff Services: $20,632,000
Natural Resources - Other: $18,571,000
Natural Resources - Other: $18,231,000
Solid Waste Management: $16,786,000
Solid Waste Management: $15,387,000
Housing and Community Development: $12,713,000
Housing and Community Development: $9,816,000
- Federal Intergovernmental - Other: $123,472,000
Other: $58,813,000
Health and Hospitals: $26,856,000
Air Transportation: $22,274,000
Public Welfare: $18,462,000
Air Transportation: $15,984,000
Health and Hospitals: $15,293,000
Transit Utilities: $14,725,000
Transit Utilities: $13,315,000
Public Welfare: $8,141,000
Highways: $635,000
Highways: $76,000
- General - Interest on Debt: $122,443,000
Interest on Debt: $97,125,000
- Local Intergovernmental - Other: $9,664,000
Other: $9,125,000
Public Welfare: $1,065,000
Public Welfare: $278,000
- Long Term Debt - Outstanding Unspecified Public Purpose: $3,464,525,000
Beginning Outstanding - Unspecified Public Purpose: $3,194,670,000
Beginning Outstanding - Unspecified Public Purpose: $3,146,705,000
Outstanding Unspecified Public Purpose: $3,020,660,000
Issue, Unspecified Public Purpose: $530,670,000
Outstanding Nonguaranteed - Industrial Revenue: $288,007,000
Retired Unspecified Public Purpose: $260,815,000
Beginning Outstanding - Public Debt for Private Purpose: $259,769,000
Beginning Outstanding - Public Debt for Private Purpose: $253,715,000
Retired Unspecified Public Purpose: $198,035,000
Outstanding Nonguaranteed - Industrial Revenue: $197,647,000
Issue, Unspecified Public Purpose: $71,990,000
Retired Nonguaranteed - Public Debt for Private Purpose: $56,068,000
Retired Nonguaranteed - Public Debt for Private Purpose: $28,238,000
- Miscellaneous - General Revenue - Other: $130,389,000
General Revenue - Other: $106,832,000
Interest Earnings: $85,358,000
Fines and Forfeits: $24,709,000
Fines and Forfeits: $21,767,000
Interest Earnings: $17,168,000
Special Assessments: $12,225,000
Special Assessments: $11,142,000
Sale of Property: $2,835,000
Sale of Property: $2,738,000
Rents: $2,660,000
Rents: $2,501,000
- Other Capital Outlay - Police Protection: $26,693,000
Police Protection: $17,188,000
Judicial and Legal Services: $8,885,000
Correctional Institutions: $5,740,000
Judicial and Legal Services: $4,315,000
Local Fire Protection: $4,067,000
Correctional Institutions: $3,980,000
Local Fire Protection: $2,213,000
Housing and Community Development: $2,167,000
Housing and Community Development: $1,621,000
Public Welfare - Other: $669,000
Central Staff Services: $482,000
Public Welfare - Other: $475,000
Central Staff Services: $39,000
Parking Facilities: $18,000
- Other Funds - Cash and Securities: $2,741,484,000
Cash and Securities: $2,041,125,000
- Revenue - Water Utilities: $54,856,000
Water Utilities: $50,620,000
Transit Utilities: $29,752,000
Transit Utilities: $26,425,000
- Sinking Funds - Cash and Securities: $308,537,000
Cash and Securities: $214,915,000
- State Intergovernmental - General Local Government Support: $120,293,000
General Local Government Support: $112,617,000
Other: $53,254,000
Other: $39,346,000
Highways: $27,818,000
Highways: $27,795,000
Transit Utilities: $18,918,000
Transit Utilities: $16,789,000
Public Welfare: $11,075,000
Public Welfare: $7,702,000
Health and Hospitals: $4,387,000
Housing and Community Development: $1,999,000
Housing and Community Development: $1,569,000
Health and Hospitals: $1,474,000
- Tax - Property: $1,032,202,000
Property: $891,984,000
General Sales and Gross Receipts: $282,631,000
Other Selective Sales: $88,375,000
Motor Fuels Sales: $67,825,000
Motor Fuels Sales: $66,795,000
Other Selective Sales: $62,940,000
Other License: $13,665,000
Other License: $12,185,000
Documentary and Stock Transfer: $10,173,000
Documentary and Stock Transfer: $9,978,000
Public Utilities Sales: $4,234,000
Public Utilities Sales: $4,109,000
Occupation and Business License - Other: $1,893,000
Occupation and Business License - Other: $1,703,000
- Total Salaries and Wages: $499,000
: $440,000
- Water Utilities - Interest on Debt: $19,293,000
Interest on Debt: $15,699,000
Supplemental Security Income (SSI) in 2006:
- Total number of recipients: 32,609
- Number of aged recipients: 8,976
- Number of blind and disabled recipients: 23,633
- Number of recipients under 18: 5,902
- Number of recipients between 18 and 64: 14,703
- Number of recipients older than 64: 12,004
- Number of recipients also receiving OASDI: 10,330
- Amount of payments (thousands of dollars): 14,202
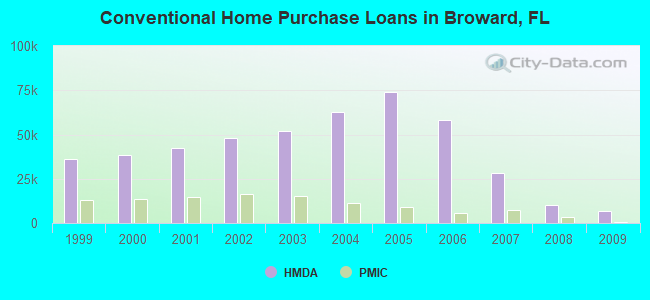
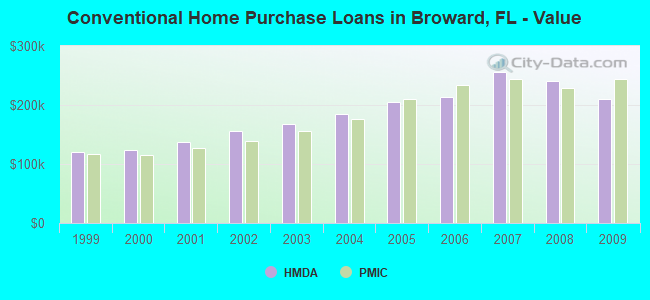
| Home Mortgage Disclosure Act Aggregated Statistics For Year 2009 (Based on 279 full tracts) | ||||||||||||||
| A) FHA, FSA/RHS & VA Home Purchase Loans | B) Conventional Home Purchase Loans | C) Refinancings | D) Home Improvement Loans | E) Loans on Dwellings For 5+ Families | F) Non-occupant Loans on < 5 Family Dwellings (A B C & D) | G) Loans On Manufactured Home Dwelling (A B C & D) | ||||||||
|---|---|---|---|---|---|---|---|---|---|---|---|---|---|---|
| Number | Average Value | Number | Average Value | Number | Average Value | Number | Average Value | Number | Average Value | Number | Average Value | Number | Average Value | |
| LOANS ORIGINATED | 6,772 | $181,901 | 6,654 | $209,641 | 10,898 | $209,955 | 468 | $119,684 | 46 | $2,969,065 | 2,313 | $182,661 | 56 | $88,982 |
| APPLICATIONS APPROVED, NOT ACCEPTED | 515 | $174,781 | 865 | $234,022 | 1,858 | $202,075 | 191 | $70,555 | 6 | $1,757,000 | 325 | $167,418 | 34 | $56,029 |
| APPLICATIONS DENIED | 2,379 | $163,568 | 2,802 | $179,034 | 10,204 | $217,264 | 877 | $69,064 | 12 | $9,375,417 | 1,984 | $162,214 | 113 | $66,796 |
| APPLICATIONS WITHDRAWN | 1,177 | $169,041 | 1,315 | $213,739 | 4,013 | $215,754 | 185 | $145,589 | 10 | $2,513,300 | 639 | $174,169 | 20 | $108,050 |
| FILES CLOSED FOR INCOMPLETENESS | 542 | $161,050 | 466 | $199,373 | 1,481 | $222,955 | 57 | $131,193 | 2 | $280,500 | 190 | $189,942 | 13 | $74,154 |
| Private Mortgage Insurance Companies Aggregated Statistics For Year 2009 (Based on 248 full tracts) | ||||||
| A) Conventional Home Purchase Loans | B) Refinancings | C) Non-occupant Loans on < 5 Family Dwellings (A & B) | ||||
|---|---|---|---|---|---|---|
| Number | Average Value | Number | Average Value | Number | Average Value | |
| LOANS ORIGINATED | 487 | $243,955 | 60 | $246,917 | 3 | $230,667 |
| APPLICATIONS APPROVED, NOT ACCEPTED | 342 | $241,418 | 87 | $255,023 | 15 | $257,133 |
| APPLICATIONS DENIED | 173 | $225,197 | 68 | $241,882 | 7 | $140,429 |
| APPLICATIONS WITHDRAWN | 64 | $208,703 | 21 | $216,619 | 3 | $282,333 |
| FILES CLOSED FOR INCOMPLETENESS | 97 | $222,784 | 20 | $210,350 | 11 | $215,182 |
| Most common first names in Broward County, FL among deceased individuals | ||
| Name | Count | Lived (average) |
|---|---|---|
| John | 9,823 | 74.5 years |
| William | 8,411 | 75.3 years |
| Joseph | 7,509 | 76.7 years |
| Mary | 7,435 | 80.0 years |
| Robert | 6,131 | 70.8 years |
| James | 5,543 | 71.2 years |
| Charles | 5,152 | 75.6 years |
| George | 5,105 | 76.5 years |
| Helen | 4,874 | 80.5 years |
| Harry | 3,949 | 79.7 years |
| Most common last names in Broward County, FL among deceased individuals | ||
| Last name | Count | Lived (average) |
|---|---|---|
| Smith | 2,738 | 74.5 years |
| Miller | 1,896 | 77.0 years |
| Brown | 1,833 | 73.6 years |
| Johnson | 1,727 | 72.8 years |
| Cohen | 1,688 | 80.2 years |
| Williams | 1,593 | 70.4 years |
| Davis | 1,309 | 74.2 years |
| Jones | 1,209 | 72.6 years |
| Schwartz | 1,015 | 80.5 years |
| Levine | 838 | 79.9 years |
| Businesses in Broward County, FL | ||||
| Name | Count | Name | Count | |
|---|---|---|---|---|
| 24 Hour Fitness | 5 | Jimmy John's | 10 | |
| 7-Eleven | 54 | JoS. A. Bank | 4 | |
| ALDI | 2 | Johnny Rockets | 2 | |
| ALDO | 4 | Jones New York | 33 | |
| AMF Bowling | 2 | Journeys | 4 | |
| AT&T | 36 | Justice | 6 | |
| Abercrombie & Fitch | 1 | KFC | 30 | |
| Abercrombie Kids | 1 | Kincaid | 1 | |
| Ace Hardware | 8 | Kmart | 6 | |
| Advance Auto Parts | 32 | Kohl's | 4 | |
| Aeropostale | 3 | LA Fitness | 16 | |
| Albertsons | 1 | La Quinta | 13 | |
| American Eagle Outfitters | 3 | La-Z-Boy | 3 | |
| Ann Taylor | 4 | Lane Bryant | 5 | |
| Apple Store | 1 | Lane Furniture | 11 | |
| Applebee's | 7 | LensCrafters | 9 | |
| Arby's | 9 | Levi Strauss & Co. | 1 | |
| Ashley Furniture | 2 | Little Caesars Pizza | 18 | |
| Audi | 3 | Long John Silver's | 3 | |
| AutoZone | 10 | Lowe's | 6 | |
| Avenue | 6 | Macy's | 6 | |
| BMW | 3 | MainStay | 1 | |
| Baja Fresh Mexican Grill | 1 | Marriott | 15 | |
| Bakers | 2 | Marshalls | 9 | |
| Bally Total Fitness | 4 | MasterBrand Cabinets | 64 | |
| Banana Republic | 4 | Mazda | 3 | |
| Barnes & Noble | 5 | McDonald's | 73 | |
| Baskin-Robbins | 19 | Men's Wearhouse | 7 | |
| Bath & Body Works | 10 | Motel 6 | 2 | |
| Bebe | 2 | Motherhood Maternity | 9 | |
| Bed Bath & Beyond | 7 | New Balance | 28 | |
| Ben & Jerry's | 4 | New York & Co | 4 | |
| Bentleymotors.Com | 1 | Nike | 103 | |
| Best Western | 4 | Nissan | 4 | |
| Blockbuster | 26 | Nordstrom | 1 | |
| Brooks Brothers | 1 | Office Depot | 21 | |
| Brookstone | 2 | OfficeMax | 9 | |
| Brunswick Bowling & Billiards | 1 | Old Navy | 5 | |
| Budget Car Rental | 9 | Olive Garden | 4 | |
| Burger King | 41 | Outback | 5 | |
| Buybuy BABY | 2 | Outback Steakhouse | 5 | |
| CVS | 56 | Pac Sun | 4 | |
| Cache | 4 | Panda Express | 5 | |
| CarMax | 2 | Panera Bread | 9 | |
| Casual Male XL | 3 | Papa John's Pizza | 10 | |
| Charlotte Russe | 4 | Payless | 31 | |
| Chevrolet | 6 | Penske | 12 | |
| Chick-Fil-A | 7 | PetSmart | 5 | |
| Chico's | 5 | Pier 1 Imports | 6 | |
| Chipotle | 6 | Pizza Hut | 19 | |
| Chuck E. Cheese's | 2 | Plato's Closet | 3 | |
| Church's Chicken | 3 | Popeyes | 6 | |
| Cinnabon | 3 | Pottery Barn | 2 | |
| Circle K | 1 | Publix Super Markets | 78 | |
| Clarks | 1 | Quality | 2 | |
| Cold Stone Creamery | 11 | Quiznos | 20 | |
| Coldwater Creek | 3 | RadioShack | 30 | |
| Comfort Inn | 3 | Ramada | 2 | |
| Comfort Suites | 3 | Red Lobster | 5 | |
| Costco | 3 | Red Roof Inn | 1 | |
| Cracker Barrel | 2 | Rooms To Go | 8 | |
| Crate & Barrel | 1 | Ruby Tuesday | 6 | |
| Crossland Economy Studios | 1 | Ryder Rental & Truck Leasing | 2 | |
| Curves | 5 | SAS Shoes | 2 | |
| DHL | 53 | Sam's Club | 3 | |
| Dairy Queen | 19 | Sears | 15 | |
| Days Inn | 2 | Sephora | 3 | |
| Decora Cabinetry | 12 | Sheraton | 3 | |
| Dennys | 16 | Skechers USA | 2 | |
| Domino's Pizza | 20 | Sleep Inn | 1 | |
| DressBarn | 3 | Soma Intimates | 3 | |
| Dressbarn | 3 | Spencer Gifts | 3 | |
| Dunkin Donuts | 76 | Sprint Nextel | 21 | |
| Econo Lodge | 1 | Staples | 10 | |
| Ethan Allen | 2 | Starbucks | 51 | |
| Express | 4 | Steak 'n Shake | 4 | |
| Extended Stay America | 3 | Studio 6 | 1 | |
| Extended Stay Deluxe | 2 | Subaru | 3 | |
| Famous Footwear | 4 | Subway | 79 | |
| Fashion Bug | 2 | Super 8 | 2 | |
| FedEx | 266 | T-Mobile | 52 | |
| Finish Line | 5 | T.G.I. Driday's | 7 | |
| Firestone Complete Auto Care | 13 | T.J.Maxx | 7 | |
| Foot Locker | 10 | Taco Bell | 24 | |
| Ford | 6 | Talbots | 3 | |
| Forever 21 | 3 | Target | 12 | |
| Fredericks Of Hollywood | 1 | The Athlete's Foot | 2 | |
| GNC | 31 | The Cheesecake Factory | 3 | |
| GameStop | 32 | The Limited | 1 | |
| Gap | 4 | The Room Place | 2 | |
| Goodwill | 6 | Tire Kingdom | 18 | |
| Gymboree | 3 | Toyota | 5 | |
| H&R Block | 40 | Toys"R"Us | 8 | |
| Haagen-Dazs | 3 | Travelodge | 2 | |
| Havertys Furniture | 1 | True Value | 2 | |
| Haworth | 1 | U-Haul | 83 | |
| Hawthorn | 1 | UPS | 255 | |
| Hilton | 16 | Value City Furniture | 1 | |
| Holiday Inn | 8 | Vans | 18 | |
| Hollister Co. | 2 | Verizon Wireless | 13 | |
| Home Depot | 17 | Victoria's Secret | 5 | |
| HomeTown Buffet | 2 | Volkswagen | 4 | |
| Homestead Studio Suites | 2 | Waffle House | 3 | |
| Honda | 5 | Walgreens | 53 | |
| Hot Topic | 4 | Walmart | 18 | |
| Hyatt | 3 | Westin | 3 | |
| Hyundai | 4 | Wet Seal | 2 | |
| IHOP | 20 | Whole Foods Market | 3 | |
| IZOD | 1 | Wingate | 1 | |
| InTown Suites | 1 | World Gym | 1 | |
| J.Crew | 2 | YMCA | 6 | |
| JCPenney | 5 | Z Gallerie | 2 | |
| Jamba Juice | 6 | |||
Broward County on our top lists:
- #7 on the list of "Top 101 counties with the highest ground withdrawal of fresh water for public supply"
- #7 on the list of "Top 101 counties with the highest ground withdrawal of fresh water for public supply (pop. 50,000+)"
- #15 on the list of "Top 101 counties with the most Evangelical Protestant congregations (pop. 50,000+)"
- #15 on the list of "Top 101 counties with the most Evangelical Protestant congregations"
- #18 on the list of "Top 101 counties with the most Evangelical Protestant adherents (pop. 50,000+)"
- #18 on the list of "Top 101 counties with the most Evangelical Protestant adherents"
- #20 on the list of "Top 101 counties with the lowest average weight of females"
- #24 on the list of "Top 101 counties with the highest total withdrawal of fresh water for public supply (pop. 50,000+)"
- #25 on the list of "Top 101 counties with the most Orthodox congregations (pop. 50,000+)"
- #25 on the list of "Top 101 counties with the highest total withdrawal of fresh water for public supply"
- #28 on the list of "Top 101 counties with the most Orthodox congregations"
- #31 on the list of "Top 101 counties with the most Other congregations (pop. 50,000+)"
- #32 on the list of "Top 101 counties with the lowest percentage of residents that keep firearms around their homes"
- #33 on the list of "Top 101 counties with the most Other congregations"
- #37 on the list of "Top 101 counties with the most Other adherents"
- #37 on the list of "Top 101 counties with the most Other adherents (pop. 50,000+)"
- #38 on the list of "Top 101 counties with the largest decrease in the number of deaths per 1000 residents 2000-2006 to 2007-2013 (pop. 50,000+)"
- #43 on the list of "Top 101 counties with the most Catholic adherents (pop. 50,000+)"
- #43 on the list of "Top 101 counties with the most Catholic adherents"
- #50 on the list of "Top 101 counties with the most Orthodox adherents"