Nashville-Davidson, TN vs Augusta-Richmond County, GA
Both Nashville-Davidson, TN and Augusta-Richmond, GA have their unique strengths and opportunities, offering a distinctive blend of Southern lifestyle, hospitality, and livability. Nashville, the vibrant music city, is known for its flourishing healthcare industry, diverse economy, rich culture, and desirable neighborhoods, while Augusta is renowned for its affordable lifestyle, golf scenery, accessible healthcare, and more tranquil pace. This comparison will spotlight these two cities' key aspects, helping those considering relocation or just visiting to make an informed decision.
Nashville-Davidson's population is larger by 237%. Its population has grown by 133,327 people (24.4%) since 2000. The population of Augusta-Richmond County has grown by 6,014 people (3.1%) during that time.
In terms of crime and safety, both cities demonstrate areas for improvement. Nashville’s crime rate, particularly property crimes, tend to be higher than the national average, with violent crime also a concern. Similarly, Augusta's crime rates also run above the national average. However, crime distribution is uneven in both cities, with safer neighborhoods existing in both. It would be advisable for individuals to research specific areas before moving.
Cost of Living
Augusta-Richmond County boasts a lower cost of living compared to Nashville-Davidson, especially in housing costs. While both cities are more affordable than many other U.S cities, everyday expenses like food, transportation, healthcare, and utilities are also comparatively lower in Augusta.
Income Tax
A significant financial advantage for Nashville residents is Tennessee's lack of state income tax, which can yield substantial savings. Conversely, Augusta residents are subject to Georgia's state income tax.
Property Tax
State property taxes are higher in Georgia than in Tennessee, meaning Augusta homeowners typically pay more in property taxes than their counterparts in Nashville.
Sales Tax
Tennessee has a higher state sales tax rate compared to Georgia. Nashville's combined state and local sales tax rate is notably higher than Augusta's, potentially affecting residents' cost of living.
Income
Type
Nashville-Davidson
Augusta-Richmond County
Estimated median household income
$64,857
$47,921
Estimated per capita income
$42,268
$27,864
Cost of living index (U.S. average is 100)
90.9
89.2
If you make $50,000 in Augusta-Richmond County, you will have to make $50,953 in Nashville-Davidson to maintain the same standard of living.
Geographical Conditions
Nashville, located in the heart of Tennessee, is characterized by rolling hills and rich farmland. Augusta sits along the Savannah River, offering a more verdant landscape replete with rivers, trails, and the iconic Augusta National Golf Club.
Nashville is home to high-quality educational institutions, including Vanderbilt University, and maintains a good variety of public and private schools. Conversely, Augusta boasts the well-regarded Medical College of Georgia and excels in medical research and healthcare education. However, Nashville tends to rank higher overall in education quality.
Nashville's economy is diverse, with key sectors including healthcare, education, music and entertainment, and automotive manufacturing. Meanwhile, Augusta's economy primarily centers on healthcare, military, and education sectors. Both cities boast robust job markets, though Nashville has a lower unemployment rate.
Biggest Employers
In Nashville, the biggest employers include Vanderbilt University Medical Center, Nissan North America, and HCA Healthcare. Augusta's job market is anchored by the U.S Department of Defense, University Hospital, and Augusta University.
There were 3,932 building permits issued in Nashville-Davidson in 2012 (2854 more than in 2011) compared to 776 building permits issued in Augusta-Richmond County in 2012 (776 more than in 2011).
In Nashville-Davidson (Davidson County), 58.5% voted for Democrats and 39.9% for Republicans in 2012 Presidential Election. In Augusta-Richmond County (Richmond County), 66.5% voted for Democrats and 32.7% for Republicans.
Elections
Type
Democrats
Republicans
Other
Year
Nashville-Davidson
Augusta-Richmond County
Nashville-Davidson
Augusta-Richmond County
Nashville-Davidson
Augusta-Richmond County
2020
65.0%
67.9%
32.6%
30.8%
2.3%
1.3%
2016
60.1%
64.4%
34.1%
32.3%
5.7%
3.4%
2012
58.5%
66.5%
39.9%
32.7%
1.6%
0.7%
2008
60.0%
65.7%
39.0%
33.9%
1.0%
0.4%
2004
54.9%
56.7%
44.6%
43.0%
0.4%
0.4%
2000
57.9%
54.6%
40.4%
44.3%
1.7%
1.1%
1996
79.3%
54.1%
18.1%
41.6%
2.6%
4.3%
Breakdown of population affiliated with a religious congregation
Type
Adherents
Congregations
Religion
Nashville-Davidson
Augusta-Richmond County
Nashville-Davidson
Augusta-Richmond County
SOUTHERN BAPTIST CONVENTION
14.1%
15.8%
19.6%
16.9%
CATHOLIC CHURCH
4.9%
7.9%
2.3%
1.6%
EPISCOPAL CHURCH
1.5%
1.6%
1.8%
2.8%
SEVENTH DAY ADVENTIST CHURCH
1.1%
0.2%
1.7%
0.4%
COPTIC ORTHODOX CHURCH
1.0%
0.0%
0.5%
0.0%
MUSLIM ESTIMATE
0.8%
1.0%
1.4%
1.2%
PRESBYTERIAN CHURCH IN AMERICA
0.8%
1.2%
0.9%
1.2%
CUMBERLAND PRESBYTERIAN CHURCH
0.4%
0.0%
1.3%
0.0%
EVANGELICAL LUTHERAN CHURCH IN AMERICA
0.2%
0.9%
0.8%
0.8%
AMERICAN BAPTIST CHURCHES IN THE USA
0.1%
0.6%
0.3%
1.2%
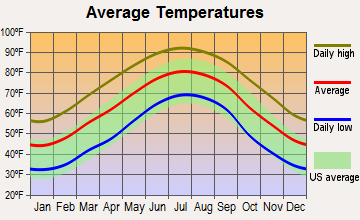
Weather
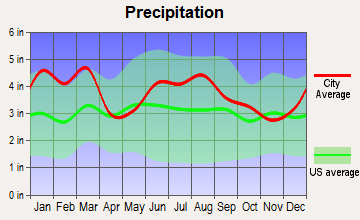
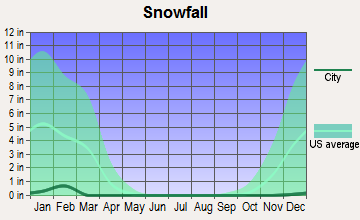
The weather in both cities is characterized by hot summers and mild winters. Nashville experiences slightly colder winters, more annual rainfall, and occasional snow. On the other hand, Augusta benefits from a slightly warmer year-round climate, with less rainfall and rarely, if ever, experiences snow.
Weather and climate
Type
Nashville-Davidson
Augusta-Richmond County
Temperature - Average
58.5°F
63°F
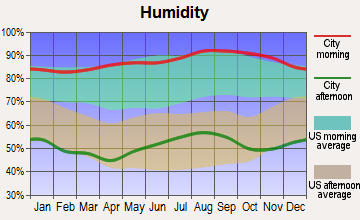
Humidity - Average morning or afternoon humidity
75.9%
74.3%
Humidity - Differences between morning and afternoon humidity
38%
44%
Humidity - Maximum monthly morning or afternoon humidity
89%
90%
Humidity - Minimum monthly morning or afternoon humidity
51%
46%
Precipitation - Yearly average
49 in
45 in
Snowfall - Yearly average
17.8 in
2 in
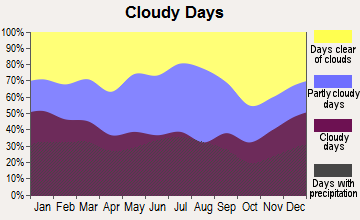
Clouds - Number of days clear of clouds
17.1%
18.7%
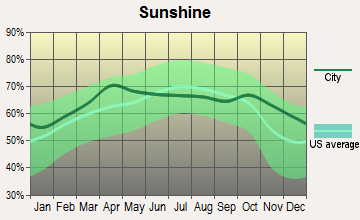
Sunshine amount - Average
59.7%
69%
Sunshine amount - Differences during a year
23%
14.6%
Sunshine amount - Maximum monthly
65%
69.3%
Sunshine amount - Minimum monthly
42%
54.7%
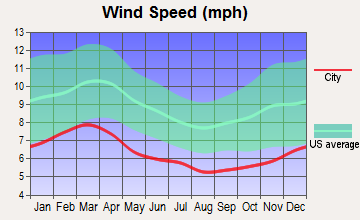
Wind speed - Average
7.7 mph
6 mph
Average climate in Nashville-Davidson, Tennessee
Average climate in Augusta-Richmond County, Georgia
Air pollution
Type
AQI
CO
NO2
OZONE
PB
PM10
PM25
SO2
Year
Nashville-Davidson
Augusta-Richmond County
Nashville-Davidson
Nashville-Davidson
Nashville-Davidson
Augusta-Richmond County
Nashville-Davidson
Augusta-Richmond County
Nashville-Davidson
Augusta-Richmond County
Nashville-Davidson
Augusta-Richmond County
Nashville-Davidson
Augusta-Richmond County
2018
71
77
0.40
N/A
13.8
N/A
24.1
25.4
N/A
N/A
15.2
13.1
9.2
9.9
0.2
0.9
2017
70
76
0.38
N/A
14.4
N/A
26.8
25.9
N/A
N/A
15.3
N/A
8.7
8.7
0.1
1.0
2016
90
81
0.42
N/A
16.1
N/A
26.4
26.5
N/A
N/A
N/A
N/A
10.1
8.9
0.0
1.8
2015
68
70
0.43
N/A
15.5
N/A
23.6
25.0
N/A
N/A
N/A
N/A
10.8
8.4
0.1
1.6
2014
66
76
N/A
N/A
N/A
N/A
26.3
26.2
N/A
N/A
N/A
N/A
9.8
10.0
1.4
1.8
2013
62
76
N/A
N/A
N/A
N/A
N/A
25.7
N/A
N/A
N/A
N/A
9.7
8.8
N/A
1.7
2012
81
89
N/A
N/A
N/A
N/A
28.3
27.4
N/A
N/A
N/A
N/A
11.0
10.4
2.3
N/A
2011
81
93
N/A
N/A
N/A
N/A
25.9
30.2
N/A
N/A
N/A
N/A
11.0
11.8
1.7
N/A
2010
80
85
N/A
N/A
N/A
N/A
24.3
27.8
N/A
N/A
N/A
N/A
12.2
10.9
2.2
N/A
2009
72
79
N/A
N/A
N/A
N/A
22.5
26.2
N/A
N/A
N/A
N/A
11.5
10.3
2.4
N/A
2008
81
97
N/A
N/A
N/A
N/A
25.7
27.7
N/A
0.004
N/A
N/A
13.4
12.4
2.5
N/A
2007
99
102
N/A
N/A
N/A
N/A
27.4
28.3
N/A
0.005
N/A
N/A
15.5
14.8
2.7
N/A
2006
93
106
0.69
N/A
N/A
N/A
24.9
27.9
N/A
0.004
N/A
N/A
14.9
14.6
2.9
N/A
2005
104
110
0.56
N/A
N/A
N/A
23.5
26.4
N/A
0.006
N/A
N/A
16.9
14.6
3.1
N/A
2004
83
109
0.61
N/A
N/A
N/A
22.0
25.4
0.006
0.006
N/A
N/A
N/A
14.7
2.6
N/A
2003
93
84
0.67
N/A
N/A
N/A
18.5
23.6
0.005
0.003
N/A
N/A
15.8
N/A
3.8
N/A
2002
92
90
0.67
N/A
N/A
N/A
20.2
26.2
N/A
0.000
N/A
N/A
15.3
N/A
4.3
N/A
2001
95
98
0.89
N/A
N/A
N/A
19.5
27.1
N/A
0.002
N/A
N/A
15.6
N/A
4.5
2.4
2000
97
109
0.74
N/A
N/A
N/A
19.8
29.0
N/A
0.002
N/A
N/A
N/A
N/A
4.1
N/A
Natural disasters
Type
Nashville-Davidson
Augusta-Richmond County
Tornado activity compared to U.S. average
169.1%
101.7%
Earthquake activity compared to U.S. average
296.1%
85.8%
Natural disasters compared to U.S. average
17%
7%
Transportation
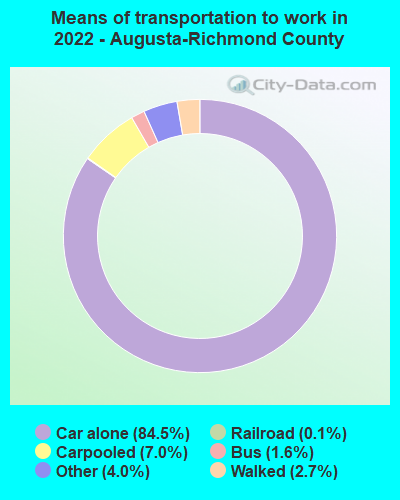
Nashville’s public transportation includes buses and commuter rail, but personal vehicles remain the preferred mode of transport. Augusta offers bus transit, but the city is also predominantly car-centric, with some areas more walkable than others.
Transport
Type
Nashville-Davidson
Augusta-Richmond County
Amtrak stations nearby
1
0
Means of transportation to work
Type
Nashville-Davidson
Augusta-Richmond County
Bicycle
0.3%
0.1%
Bus
1.2%
0.9%
Carpooled
9.8%
8.2%
Car alone
85.5%
86.6%
Taxicab
0.1%
0.3%
Walked
1.8%
1.8%
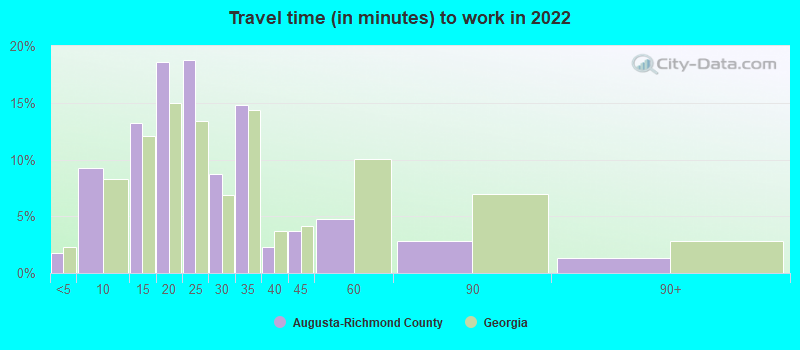
Average travel time to work
Type
Nashville-Davidson
Augusta-Richmond County
Average
31.3 min
24.8 min
Other means
23.4 min
22 min
Public transportation
38.9 min
35 min
Private vehicle occupancy
Type
Nashville-Davidson
Augusta-Richmond County
Average
1.2
1.1
Drove alone
88.7%
89.9%
In 2 person carpool
8.5%
8.1%
In 3 person carpool
1.6%
1.3%
In 4 person carpool
0.7%
0.3%
In 5-6 person carpool
0.5%
0.2%
In 7+ person carpool
0%
0.2%
How many people usually rode to work in the car, truck or van.
Real Estate
Nashville's real estate market is hot, with home prices and rents often notably higher than Augusta's. Augusta provides more affordable housing options, representing a significant potential benefit for those relocating.
Neighborhoods
Nashville offers a variety of appealing neighborhoods, each boasting a unique flavor. These include the trendy East Nashville, upscale Green Hills, and family-centric Sylvan Park. Augusta, on the other hand, offers historic neighborhoods like Summerville and Olde Town.
Houses and residents
Type
Nashville-Davidson
Augusta-Richmond County
Houses
331,262
90,645
Average household size (people)
2.3
2.5
Median year apartment built
1986
1983
Median year house/condo built
1984
1978
Length of stay in the house since moving in
12.2 years
16.2 years
Houses occupied
305,247 (92.1%)
72,760 (80.3%)
Houses occupied by owners
162,426 (53.2%)
37,458 (51.5%)
Houses occupied by renters
142,821 (46.8%)
35,302 (48.5%)
Median rent asked for vacant for-rent units
$1,391
$1,033
Median monthly housing costs
$1,291
$920
Median price asked for vacant for-sale houses and condos
$221,129
$171,838
Estimated median house or condo value
$346,700
$131,900
Median numbers of rooms
5.2
5.5
Median number of rooms in apartments
4.2
4.5
Median number of rooms in houses and condos
6.3
6.5
Median house price - detached houses
$437,686
$177,707
Median house price - in 3-to-4-unit structures
$319,119
$242,054
Median house price - in 5 or more unit structures
$305,249
$166,025
Median house price - mobile homes
$133,346
$72,383
Median house price - Townhouses or other attached units
$328,258
$162,209
Median house price - All housing units
$412,434
$171,426
Median house age
35
41
Renting percentage
44.6%
46.4%
Housing density (houses/condos per square mile)
699.9
300
House value disparities
31%
40.6%
Household income disparities
45.4%
47.5%
Median household income for houses/condes with a mortgage
$93,092
$73,692
Median household income for apartments without a mortgage
$68,871
$50,875
Housing units without a mortgage
3,189 (2.8%)
576 (2.5%)
Housing units with both a second mortgage and home equity loan
10,988 (9.6%)
824 (3.5%)
Housing units with a mortgage
110,850 (97.2%)
22,818 (97.5%)
Housing units with a home equity loan
333 (0.3%)
127 (0.5%)
Housing units with a second mortgage
13,192 (11.6%)
1,097 (4.7%)
House/condo owner moved in on average (years ago)
9
17
House/condo renter moved in on average (years ago)
1
1
Housing units lacking complete kitchen facilities
1.3%
4.7%
Housing units lacking complete plumbing facilities
0.5%
3.1%
Housing units in structures
Housing units in structures
Nashville-Davidson
Augusta-Richmond County
One, detached
50.9%
57.9%
One, attached
8.4%
5.2%
Two
3.3%
2.9%
3 or 4
3.1%
7.9%
5 to 9
7.1%
9.9%
10 to 19
8.7%
4.7%
20 to 49
5.3%
2.2%
50 or more
11.9%
2.5%
Mobile homes
1.2%
6.8%
Boats, RVs, vans, etc.
0.1%
0.0%
Median real estate property taxes paid for housing units
Self-employed workers in own not incorporated business
31,952
2,768
State government workers
15,693
7,865
Unpaid family workers
463
96
Industries and Occupations
The music and healthcare industries dominate Nashville's labor market, with a burgeoning tech sector. In contrast, Augusta's healthcare and education sectors are significant employers, along with a notable cyber-security presence due to the U.S Army Cyber Center of Excellence.
Both cities offer reliable healthcare options. Nashville stands out with top tier medical facilities like Vanderbilt University Medical Center, while Augusta boasts University Hospital and the Medical College of Georgia.
Health (county statistics)
Type
Nashville-Davidson
Augusta-Richmond County
General health status score of residents in this county from 1 (poor) to 5 (excellent)
Nashville has a more advanced infrastructure, with extensive dining, shopping, and entertainment options, along with a more developed public transit system. Augusta's infrastructure is continually improving but is more limited in scope compared to Nashville's metropolitan scale.
HMDA - Conventional home purchase loans - Applications denied
Year
Nashville-Davidson
Augusta-Richmond County
1999
2,397
857
2000
1,451
957
2001
1,130
589
2002
1,075
420
2003
2,231
393
2004
2,731
554
2005
3,231
550
2006
3,720
594
2007
2,419
399
2008
952
207
2009
532
104
Culture and Food
A cultural powerhouse, Nashville is globally recognized for its music scene, particularly country and blues. It offers an array of culinary delights, with a focus on hearty Southern fare. Augusta also features Southern cuisine, famed golf culture, and an expanding arts scene.
Sports Teams
Nashville is home to multiple professional sports teams, including the NFL's Titans and NHL's Predators. Augusta lacks major league sports teams but hosts The Masters, one of the most prestigious golf tournaments worldwide.