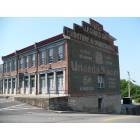
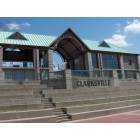
The comparison between Nashville-Davidson and Clarksville, both located in the state of Tennessee, reveals significant differences and unique characteristics that may appeal to different kinds of residents and tourists. Nashville, the state's capital, is a city famous for its rich musical history and vibrant nightlife. On the other hand, Clarksville, though smaller, holds its own with a peaceful, community-oriented ambiance. The comparison spans across various metrics, including crime and safety, education, economy, and infrastructure, among others. Each city has its advantages and potential areas for improvement.
Distance between
Nashville-Davidson, TN and
Clarksville, TN : 43.4 miles
Nashville-Davidson's population is larger by 297%. Its population has grown by 133,327 people (24.4%) since 2000. The population of Clarksville has grown by 67,502 people (65.2%) during that time.
As with any major city, Nashville-Davidson has higher crime rates compared to the smaller and relatively more rural Clarksville. Areas of Nashville closer to the city center tend to have higher crime rates, but there are many safe neighborhoods like Green Hills, Bellevue, and Sylvan Park. On the contrary, Clarksville's smaller size and close-knit community contribute to its generally lower crime rates. However, like most places, the crime rate can vary by neighborhood.
Cost of Living
Living in Nashville is generally more expensive than Clarksville. This is particularly true in terms of housing and childcare costs. Despite the higher cost, many people are drawn to Nashville because of the amenities and job opportunities the city has to offer. Conversely, Clarksville offers a lower cost of living, making it an attractive option for retirees or families on a budget.
Income Tax
Tennessee is one of the few states in the United States without a state income tax. Both Nashville and Clarksville residents enjoy this benefit.
Property Tax
While both cities reside in Tennessee, Nashville-Davidson has a higher property tax rate than Clarksville, due to its larger infrastructure and public services demand.
Sales Tax
Both cities fall under Tennessee's sales tax system, ranked among the highest nationwide. There are no differences between Nashville and Clarksville in this regard.
Income
Type
Nashville-Davidson
Clarksville
Estimated median household income
$64,857
$60,686
Estimated per capita income
$42,268
$26,631
Cost of living index (U.S. average is 100)
90.9
87.7
If you make $50,000 in Clarksville, you will have to make $51,824 in Nashville-Davidson to maintain the same standard of living.
Geographical Conditions
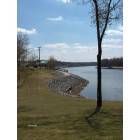
Both cities are found in a hilly region, with Nashville known for its "basin" location. Clarksville, on the other hand, is less dense and more rural, with more wide-open spaces and easy access to outdoor recreational areas.
Nashville-Davidson benefits from having numerous universities, including Vanderbilt University and Tennessee State University, making it a vibrant city for students and academic professionals. Clarksville is home to Austin Peay State University, which is a respected institution but does not have the same level of national recognition as some Nashville institutions.
Nashville is becoming one of the fastest-growing economies in the US, with diverse industries such as healthcare, technology, music, and entertainment providing abundant job opportunities. Clarksville, while having a smaller economy, still offers stable job markets in sectors like retail, manufacturing, and education.
Biggest Employers
Nashville's top employers include Vanderbilt University & Medical Center, Nissan North America, and HCA Healthcare. In Clarksville, some of the largest employers are Fort Campbell, Trane, and Hankook Tire.
There were 3,932 building permits issued in Nashville-Davidson in 2012 (2854 more than in 2011) compared to 1,452 building permits issued in Clarksville in 2012 (456 more than in 2011).
In Nashville-Davidson (Davidson County), 58.5% voted for Democrats and 39.9% for Republicans in 2012 Presidential Election. In Clarksville (Montgomery County), 44.3% voted for Democrats and 54.6% for Republicans.
Elections
Type
Democrats
Republicans
Other
Year
Nashville-Davidson
Clarksville
Nashville-Davidson
Clarksville
Nashville-Davidson
Clarksville
2020
65.0%
42.6%
32.6%
55.3%
2.3%
2.2%
2016
60.1%
37.8%
34.1%
56.4%
5.7%
5.7%
2012
58.5%
44.3%
39.9%
54.6%
1.6%
1.1%
2008
60.0%
45.6%
39.0%
53.5%
1.0%
0.9%
2004
54.9%
41.1%
44.6%
58.6%
0.4%
0.4%
2000
57.9%
48.5%
40.4%
50.6%
1.7%
0.9%
1996
79.3%
75.0%
18.1%
22.1%
2.6%
2.9%
Breakdown of population affiliated with a religious congregation
Type
Adherents
Congregations
Religion
Nashville-Davidson
Clarksville
Nashville-Davidson
Clarksville
SOUTHERN BAPTIST CONVENTION
14.1%
22.0%
19.6%
22.3%
CATHOLIC CHURCH
4.9%
4.4%
2.3%
0.5%
EPISCOPAL CHURCH
1.5%
0.3%
1.8%
1.0%
SEVENTH DAY ADVENTIST CHURCH
1.1%
0.2%
1.7%
1.0%
COPTIC ORTHODOX CHURCH
1.0%
0.0%
0.5%
0.0%
MUSLIM ESTIMATE
0.8%
0.2%
1.4%
0.5%
PRESBYTERIAN CHURCH IN AMERICA
0.8%
0.1%
0.9%
0.5%
CUMBERLAND PRESBYTERIAN CHURCH
0.4%
0.4%
1.3%
3.9%
LUTHERAN CHURCH
0.3%
0.4%
0.9%
0.5%
NATIONAL ASSOCIATION FREE WILL BAPTISTS
0.3%
0.4%
2.0%
2.9%
Weather
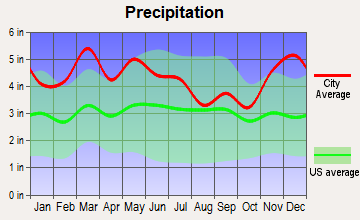
Both cities enjoy the typical Southern climate, with hot and humid summers and mild, wet winters. Nashville-Davidson gets a bit more precipitation throughout the year compared to Clarksville. Tornadoes and severe storms can occasionally occur in both locations, but proper preparation and resilience of locals make it manageable.
Weather and climate
Type
Nashville-Davidson
Clarksville
Temperature - Average
58.5°F
57.9°F
Humidity - Average morning or afternoon humidity
75.9%
76%
Humidity - Differences between morning and afternoon humidity
38%
37.8%
Humidity - Maximum monthly morning or afternoon humidity
89%
89.1%
Humidity - Minimum monthly morning or afternoon humidity
51%
51.3%
Precipitation - Yearly average
49 in
51.8 in
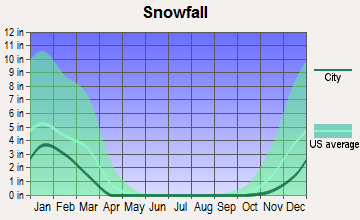
Snowfall - Yearly average
17.8 in
18.2 in
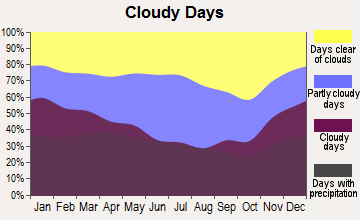
Clouds - Number of days clear of clouds
17.1%
17.1%
Sunshine amount - Average
59.7%
60.9%
Sunshine amount - Differences during a year
23%
23%
Sunshine amount - Maximum monthly
65%
66%
Sunshine amount - Minimum monthly
42%
43%
Wind speed - Average
7.7 mph
7.6 mph
Average climate in Nashville-Davidson, Tennessee
Average climate in Clarksville, Tennessee
Air pollution
Type
AQI
CO
NO2
OZONE
PB
PM10
PM25
SO2
Year
Nashville-Davidson
Clarksville
Nashville-Davidson
Nashville-Davidson
Clarksville
Nashville-Davidson
Clarksville
Nashville-Davidson
Nashville-Davidson
Nashville-Davidson
Clarksville
Nashville-Davidson
Clarksville
2018
71
62
0.40
N/A
13.8
N/A
24.1
32.2
N/A
N/A
15.2
N/A
9.2
8.0
0.2
N/A
2017
70
59
0.38
N/A
14.4
N/A
26.8
32.3
N/A
N/A
15.3
N/A
8.7
8.1
0.1
N/A
2016
90
46
0.42
N/A
16.1
N/A
26.4
33.1
N/A
N/A
N/A
N/A
10.1
N/A
0.0
N/A
2015
68
41
0.43
N/A
15.5
N/A
23.6
33.5
N/A
N/A
N/A
N/A
10.8
N/A
0.1
1.4
2014
66
44
N/A
N/A
N/A
N/A
26.3
34.3
N/A
N/A
N/A
N/A
9.8
N/A
1.4
1.6
2013
62
44
N/A
N/A
N/A
N/A
N/A
35.0
N/A
N/A
N/A
N/A
9.7
N/A
N/A
1.3
2012
81
56
N/A
N/A
N/A
N/A
28.3
40.2
N/A
N/A
N/A
N/A
11.0
N/A
2.3
1.8
2011
81
53
N/A
N/A
N/A
N/A
25.9
38.3
N/A
N/A
N/A
N/A
11.0
N/A
1.7
2.4
2010
80
56
N/A
N/A
N/A
N/A
24.3
41.0
N/A
N/A
N/A
N/A
12.2
N/A
2.2
1.5
2009
72
45
N/A
N/A
N/A
N/A
22.5
34.6
N/A
N/A
N/A
N/A
11.5
N/A
2.4
1.5
2008
81
59
N/A
N/A
N/A
N/A
25.7
39.2
N/A
N/A
N/A
N/A
13.4
N/A
2.5
1.4
2007
99
82
N/A
N/A
N/A
N/A
27.4
45.7
N/A
N/A
N/A
N/A
15.5
N/A
2.7
3.0
2006
93
66
0.69
N/A
N/A
N/A
24.9
36.5
N/A
N/A
N/A
N/A
14.9
N/A
2.9
5.5
2005
104
76
0.56
N/A
N/A
3.6
23.5
34.6
N/A
N/A
N/A
N/A
16.9
N/A
3.1
4.0
2004
83
63
0.61
N/A
N/A
N/A
22.0
37.8
0.006
N/A
N/A
N/A
N/A
N/A
2.6
5.0
2003
93
76
0.67
N/A
N/A
N/A
18.5
40.6
0.005
N/A
N/A
N/A
15.8
N/A
3.8
5.0
2002
92
74
0.67
N/A
N/A
N/A
20.2
40.2
N/A
N/A
N/A
N/A
15.3
N/A
4.3
4.9
2001
95
78
0.89
N/A
N/A
N/A
19.5
37.1
N/A
N/A
N/A
N/A
15.6
N/A
4.5
3.7
2000
97
98
0.74
N/A
N/A
4.9
19.8
34.7
N/A
N/A
N/A
N/A
N/A
N/A
4.1
3.3
Natural disasters
Type
Nashville-Davidson
Clarksville
Tornado activity compared to U.S. average
169.1%
158.8%
Earthquake activity compared to U.S. average
296.1%
331.7%
Natural disasters compared to U.S. average
17%
13%
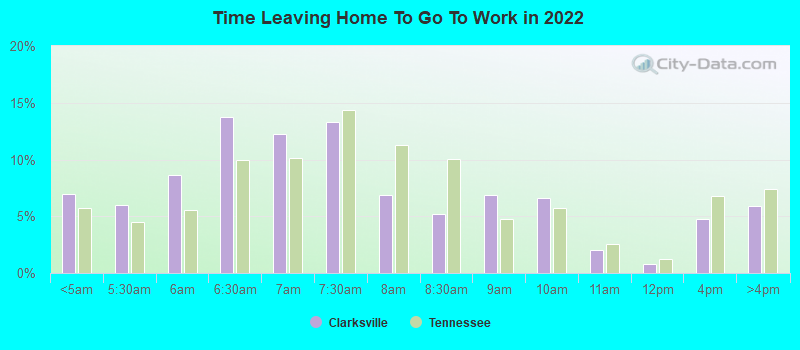
Transportation
Nashville boasts an extensive public transit system, but the city's traffic is notorious. Conversely, Clarksville has a smaller transit system, but commuting is less of a problem due to less congestion.
Transport
Type
Nashville-Davidson
Clarksville
Amtrak stations nearby
1
0
FAA registered aircraft
0
81
FAA registered aircraft manufacturers and dealers
0
11
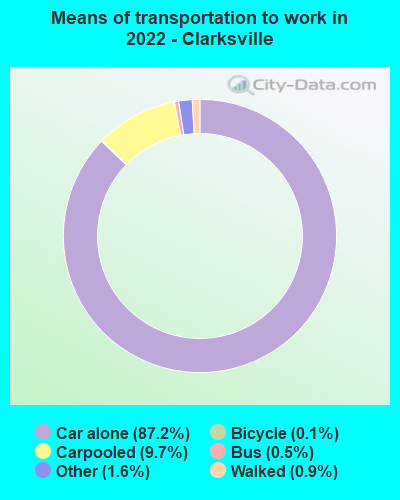
Means of transportation to work
Type
Nashville-Davidson
Clarksville
Bicycle
0.3%
0.1%
Bus
1.2%
0.5%
Carpooled
9.8%
9.6%
Car alone
85.5%
87.5%
Motorcycle
0.1%
0.2%
Taxicab
0.1%
0.1%
Walked
1.8%
1.1%
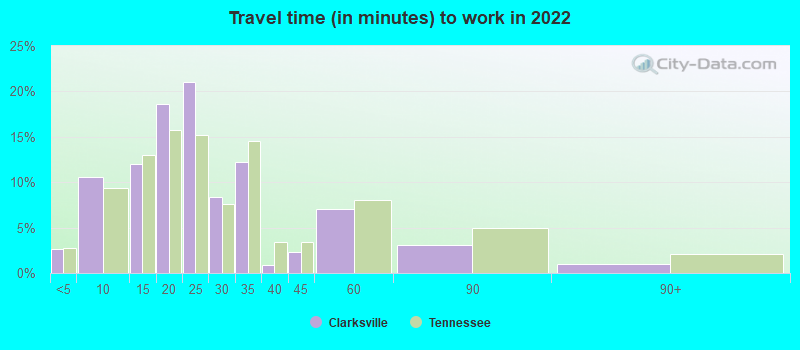
Average travel time to work
Type
Nashville-Davidson
Clarksville
Average
31.3 min
25.9 min
Other means
23.4 min
24.5 min
Public transportation
38.9 min
46.7 min
Private vehicle occupancy
Type
Nashville-Davidson
Clarksville
Average
1.2
1.1
Drove alone
88.7%
92.2%
In 2 person carpool
8.5%
6.2%
In 3 person carpool
1.6%
0.9%
In 4 person carpool
0.7%
0.4%
In 5-6 person carpool
0.5%
0.2%
In 7+ person carpool
0%
0.1%
How many people usually rode to work in the car, truck or van.
Real Estate
Nashville's real estate market is quite robust, with high housing prices due to the city's popularity and growth. Clarksville, although experiencing growth itself, still offers more affordable housing prices, making it a viable option for homebuyers on a budget.
Neighborhoods
Nashville neighborhoods range from the exciting downtown district to the upscale, family-friendly Green Hills area. In contrast, Clarksville has a more uniform suburban feel, with areas like Sango and St. Bethlehem being popular for their community atmosphere and quality schools.
Houses and residents
Type
Nashville-Davidson
Clarksville
Houses
331,262
68,485
Average household size (people)
2.3
2.6
Median year apartment built
1986
1999
Median year house/condo built
1984
1998
Length of stay in the house since moving in
12.2 years
10.5 years
Houses occupied
305,247 (92.1%)
63,787 (93.1%)
Houses occupied by owners
162,426 (53.2%)
34,601 (54.2%)
Houses occupied by renters
142,821 (46.8%)
29,186 (45.8%)
Median rent asked for vacant for-rent units
$1,391
$900.96
Median monthly housing costs
$1,291
$1,096
Median price asked for vacant for-sale houses and condos
$221,129
$228,803
Estimated median house or condo value
$346,700
$211,100
Median numbers of rooms
5.2
5.5
Median number of rooms in apartments
4.2
4.6
Median number of rooms in houses and condos
6.3
6.3
Median house price - detached houses
$437,686
$205,214
Median house price - in 2-unit structures
$320,904
$217,151
Median house price - in 3-to-4-unit structures
$319,119
$200,347
Median house price - in 5 or more unit structures
$305,249
$184,266
Median house price - mobile homes
$133,346
$51,866
Median house price - Townhouses or other attached units
$328,258
$272,234
Median house price - All housing units
$412,434
$201,786
Median house age
35
23
Renting percentage
44.6%
43.9%
Housing density (houses/condos per square mile)
699.9
722
House value disparities
31%
28%
Household income disparities
45.4%
37.6%
Median household income for houses/condes with a mortgage
$93,092
$83,421
Median household income for apartments without a mortgage
$68,871
$51,357
Housing units without a mortgage
3,189 (2.8%)
530 (2.2%)
Housing units with both a second mortgage and home equity loan
10,988 (9.6%)
1,709 (7.1%)
Housing units with a mortgage
110,850 (97.2%)
23,690 (97.8%)
Housing units with a home equity loan
333 (0.3%)
0 (0%)
Housing units with a second mortgage
13,192 (11.6%)
1,709 (7.1%)
House/condo owner moved in on average (years ago)
9
7
House/condo renter moved in on average (years ago)
1
1
Housing units lacking complete kitchen facilities
1.3%
1.6%
Housing units lacking complete plumbing facilities
0.5%
1.4%
Housing units in structures
Housing units in structures
Nashville-Davidson
Clarksville
One, detached
50.9%
66.0%
One, attached
8.4%
5.2%
Two
3.3%
3.5%
3 or 4
3.1%
7.1%
5 to 9
7.1%
8.8%
10 to 19
8.7%
2.4%
20 to 49
5.3%
2.4%
50 or more
11.9%
1.2%
Mobile homes
1.2%
2.9%
Boats, RVs, vans, etc.
0.1%
0.5%
Median real estate property taxes paid for housing units
Self-employed workers in own not incorporated business
31,952
1,734
State government workers
15,693
2,881
Unpaid family workers
463
0
Industries and Occupations
The diverse economy of Nashville allows for a wide range of job occupations, from music production and healthcare professionals to IT specialists. Clarksville's economy is more focused on manufacturing, military (due to the nearby Fort Campbell), and retail occupations.
Nashville is home to some of the top medical facilities in the country, including the Vanderbilt University Medical Center. Clarksville has quality healthcare providers as well, like Tennova Healthcare, but lacks the depth and breadth of Nashville's medical community.
Health (county statistics)
Type
Nashville-Davidson
Clarksville
General health status score of residents in this county from 1 (poor) to 5 (excellent)
Nashville-Davidson boasts efficient infrastructure with an international airport, various public transport options, and numerous entertainment facilities. Clarksville is smaller and has less extensive infrastructure, but its roads and utilities are typically well-maintained, and it has small public transit system for local travel.
HMDA - Conventional home purchase loans - Applications denied
Year
Nashville-Davidson
Clarksville
1999
2,397
505
2000
1,451
463
2001
1,130
454
2002
1,075
303
2003
2,231
215
2004
2,731
264
2005
3,231
362
2006
3,720
374
2007
2,419
262
2008
952
90
2009
532
48
Culture and Food
Nashville is internationally known for its country music scene and flavorful Southern cuisine. On the other hand, Clarksville offers a quieter cultural scene, with local festivals, galleries, and farm-to-table dining options.
Sports Teams
Nashville is home to several professional sports teams, including the Tennessee Titans (NFL), Nashville Predators (NHL), and Nashville SC (MLS). Clarksville does not have any major professional sports teams but has a passionate local sports culture surrounding high school and amateur leagues.


 Nashville-Davidson, TN and
  Clarksville, TN : 43.4 miles