Comparing Nashville-Davidson in Tennessee to Colorado Springs in Colorado offers a look at two distinct city lifestyles in the United States. On the surface, both are vibrant cities with rich cultural scenes, but they each have their own unique qualities that may suit different preferences. Factors such as crime and safety, weather, cost of living, education, work and economy, infrastructure, industries and occupations, biggest employers, real estate, neighborhoods, transportation and commuting, taxes, culture and food, sports teams, geographical conditions, and healthcare could be considered by individuals looking to relocate or tourists deciding on their next destination.
Distance between
Nashville-Davidson, TN and
Colorado Springs, CO : 1,004.0 miles
Nashville-Davidson's population is larger by 40%. Its population has grown by 133,327 people (24.4%) since 2000. The population of Colorado Springs has grown by 123,066 people (34.1%) during that time.
Nashville's overall crime rate is higher than the national average, although the situation varies by neighborhood, and the higher rate is mostly due to property crimes. Colorado Springs, on the other hand, has a slightly below-average crime rate. Yet, it is always important for both residents and tourists to be aware and take safety precautions in any city.
Cost of Living
Cost of living generally is higher in Nashville than Colorado Springs. This is mostly due to the cost of housing being higher on average in Nashville. However, healthcare and groceries tend to be cheaper in Nashville compared to Colorado Springs.
Income Tax
Colorado has a state income tax, while Tennessee does not. This could be a significant factor for individuals considering relocation.
Property Tax
Nashville has a higher property tax rate compared to Colorado Springs, which can contribute to the higher cost of living in Nashville.
Sales Tax
Tennessee has a higher sales tax rate compared to Colorado, which can add to the cost of living. However, Tennessee does not have a state income tax, which may offset some of this cost.
Income
Type
Nashville-Davidson
Colorado Springs
Estimated median household income
$64,857
$74,579
Estimated per capita income
$42,268
$39,808
Cost of living index (U.S. average is 100)
90.9
99.6
If you make $50,000 in Nashville-Davidson, you will have to make $54,785 in Colorado Springs to maintain the same standard of living.
Geographical Conditions
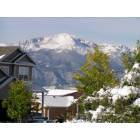
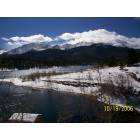
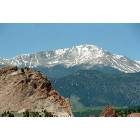
Nashville is classified as a high plains region, known for its rolling hills and fertile land. Colorado Springs is located near the Rocky Mountains, offering beautiful mountain vistas, hiking, and outdoor activities.
Both cities have a vibrant educational scene with renowned schools and universities. Nashville is home to prestigious institutions like Vanderbilt University, while Colorado Springs hosts the United States Air Force Academy. There are excellent public and private schools in both cities.
Nashville's economy is driven by health care, music and entertainment, education, and finance. Colorado Springs' economy is focused on the military, high-tech industry, and tourism. Both cities have a relatively low unemployment rate compared to the national average.
Biggest Employers
The largest employer in Nashville is Vanderbilt University and Medical Center. In Colorado Springs, the military plays a significant role in employment, with the United States Air Force Academy and several military bases among the biggest employers.
In Nashville-Davidson (Davidson County), 58.5% voted for Democrats and 39.9% for Republicans in 2012 Presidential Election. In Colorado Springs (El Paso County), 38.7% voted for Democrats and 59.2% for Republicans.
Elections
Type
Democrats
Republicans
Other
Year
Nashville-Davidson
Colorado Springs
Nashville-Davidson
Colorado Springs
Nashville-Davidson
Colorado Springs
2020
65.0%
43.0%
32.6%
53.9%
2.3%
3.1%
2016
60.1%
34.1%
34.1%
56.6%
5.7%
9.4%
2012
58.5%
38.7%
39.9%
59.2%
1.6%
2.0%
2008
60.0%
40.0%
39.0%
58.9%
1.0%
1.1%
2004
54.9%
32.2%
44.6%
66.9%
0.4%
0.9%
2000
57.9%
30.9%
40.4%
64.1%
1.7%
5.0%
1996
79.3%
32.2%
18.1%
59.0%
2.6%
8.8%
Breakdown of population affiliated with a religious congregation
Type
Adherents
Congregations
Religion
Nashville-Davidson
Colorado Springs
Nashville-Davidson
Colorado Springs
SOUTHERN BAPTIST CONVENTION
14.1%
2.6%
19.6%
11.3%
CATHOLIC CHURCH
4.9%
8.4%
2.3%
5.4%
EPISCOPAL CHURCH
1.5%
0.4%
1.8%
1.6%
SEVENTH DAY ADVENTIST CHURCH
1.1%
0.2%
1.7%
1.2%
COPTIC ORTHODOX CHURCH
1.0%
0.0%
0.5%
0.0%
MUSLIM ESTIMATE
0.8%
0.0%
1.4%
0.2%
PRESBYTERIAN CHURCH IN AMERICA
0.8%
0.4%
0.9%
1.2%
CUMBERLAND PRESBYTERIAN CHURCH
0.4%
0.0%
1.3%
0.0%
LUTHERAN CHURCH
0.3%
0.7%
0.9%
1.9%
EVANGELICAL LUTHERAN CHURCH IN AMERICA
0.2%
1.0%
0.8%
2.3%
AMERICAN BAPTIST CHURCHES IN THE USA
0.1%
0.3%
0.3%
1.2%
Weather
Nashville experiences a humid subtropical climate with hot summers and mild winters, while Colorado Springs sees a semi-arid, continental climate. Winters in Colorado Springs can be significantly colder with occasional heavy snowfall, which may appeal to those who enjoy winter sports.
Weather and climate
Type
Nashville-Davidson
Colorado Springs
Temperature - Average
58.5°F
43.4°F
Humidity - Average morning or afternoon humidity
75.9%
53.3%
Humidity - Differences between morning and afternoon humidity
38%
30%
Humidity - Maximum monthly morning or afternoon humidity
89%
64%
Humidity - Minimum monthly morning or afternoon humidity
51%
34%
Precipitation - Yearly average
49 in
18.6 in
Snowfall - Yearly average
17.8 in
77 in
Clouds - Number of days clear of clouds
17.1%
21.2%
Sunshine amount - Average
59.7%
82.2%
Sunshine amount - Differences during a year
23%
10.5%
Sunshine amount - Maximum monthly
65%
79.7%
Sunshine amount - Minimum monthly
42%
69.2%
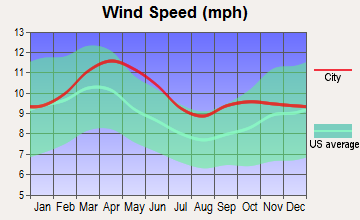
Wind speed - Average
7.7 mph
10.3 mph
Average climate in Nashville-Davidson, Tennessee
Average climate in Colorado Springs, Colorado
Air pollution
Type
AQI
CO
NO2
OZONE
PB
PM10
PM25
SO2
Year
Nashville-Davidson
Colorado Springs
Nashville-Davidson
Colorado Springs
Nashville-Davidson
Colorado Springs
Nashville-Davidson
Nashville-Davidson
Colorado Springs
Nashville-Davidson
Colorado Springs
Nashville-Davidson
Colorado Springs
Nashville-Davidson
Colorado Springs
2018
71
60
0.40
N/A
13.8
N/A
24.1
N/A
N/A
N/A
15.2
N/A
9.2
6.3
0.2
N/A
2017
70
58
0.38
N/A
14.4
N/A
26.8
N/A
N/A
N/A
15.3
N/A
8.7
6.1
0.1
N/A
2016
90
48
0.42
N/A
16.1
N/A
26.4
N/A
N/A
N/A
N/A
N/A
10.1
6.9
0.0
N/A
2015
68
N/A
0.43
N/A
15.5
N/A
23.6
N/A
N/A
N/A
N/A
N/A
10.8
N/A
0.1
N/A
2014
66
N/A
N/A
N/A
N/A
N/A
26.3
N/A
N/A
N/A
N/A
N/A
9.8
N/A
1.4
N/A
2013
62
N/A
N/A
N/A
N/A
N/A
N/A
N/A
N/A
N/A
N/A
N/A
9.7
N/A
N/A
N/A
2012
81
N/A
N/A
N/A
N/A
N/A
28.3
N/A
N/A
N/A
N/A
N/A
11.0
N/A
2.3
N/A
2011
81
N/A
N/A
N/A
N/A
N/A
25.9
N/A
N/A
N/A
N/A
N/A
11.0
N/A
1.7
N/A
2010
80
N/A
N/A
N/A
N/A
N/A
24.3
N/A
N/A
N/A
N/A
N/A
12.2
N/A
2.2
N/A
2009
72
N/A
N/A
N/A
N/A
N/A
22.5
N/A
N/A
N/A
N/A
N/A
11.5
N/A
2.4
N/A
2008
81
N/A
N/A
N/A
N/A
N/A
25.7
N/A
N/A
N/A
N/A
N/A
13.4
N/A
2.5
N/A
2007
99
N/A
N/A
N/A
N/A
N/A
27.4
N/A
N/A
N/A
N/A
N/A
15.5
N/A
2.7
N/A
2006
93
15
0.69
0.50
N/A
N/A
24.9
N/A
N/A
0.005
N/A
N/A
14.9
N/A
2.9
N/A
2005
104
17
0.56
0.55
N/A
N/A
23.5
N/A
N/A
0.027
N/A
N/A
16.9
N/A
3.1
N/A
2004
83
17
0.61
0.56
N/A
N/A
22.0
N/A
0.006
0.010
N/A
N/A
N/A
N/A
2.6
N/A
2003
93
19
0.67
0.59
N/A
N/A
18.5
N/A
0.005
0.011
N/A
N/A
15.8
N/A
3.8
N/A
2002
92
24
0.67
0.66
N/A
N/A
20.2
N/A
N/A
0.010
N/A
N/A
15.3
N/A
4.3
N/A
2001
95
51
0.89
0.63
N/A
16.7
19.5
N/A
N/A
0.005
N/A
21.3
15.6
N/A
4.5
1.9
2000
97
78
0.74
0.58
N/A
22.5
19.8
N/A
N/A
0.010
N/A
21.0
N/A
N/A
4.1
2.3
Natural disasters
Type
Nashville-Davidson
Colorado Springs
Tornado activity compared to U.S. average
169.1%
78.4%
Earthquake activity compared to U.S. average
296.1%
816.1%
Natural disasters compared to U.S. average
17%
17%
Transportation
Both cities offer various public transportation options, such as buses and bike-sharing programs. Nashville also has a commuter rail service. However, like many US cities, private vehicles remain the predominant method of transportation in both cities.
Transport
Type
Nashville-Davidson
Colorado Springs
Amtrak stations
0
1
Amtrak stations nearby
1
1
FAA registered aircraft
0
552
FAA registered aircraft manufacturers and dealers
0
44
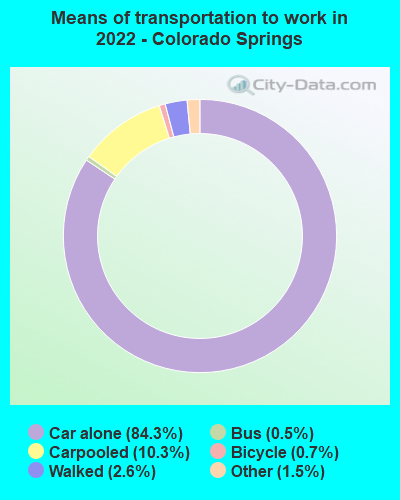
Means of transportation to work
Type
Nashville-Davidson
Colorado Springs
Bicycle
0.3%
0.3%
Bus
1.2%
0.4%
Carpooled
9.8%
9.2%
Car alone
85.5%
87%
Motorcycle
0.1%
0.1%
Taxicab
0.1%
0.1%
Walked
1.8%
2.1%
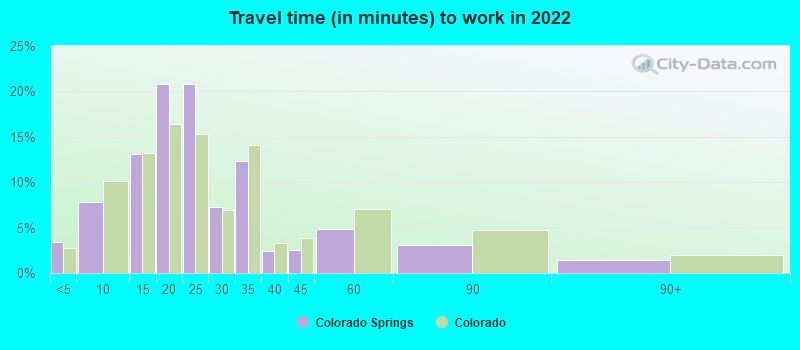
Average travel time to work
Type
Nashville-Davidson
Colorado Springs
Average
31.3 min
23.8 min
Other means
23.4 min
21.3 min
Public transportation
38.9 min
39 min
Private vehicle occupancy
Type
Nashville-Davidson
Colorado Springs
Average
1.2
1.1
Drove alone
88.7%
90%
In 2 person carpool
8.5%
7.5%
In 3 person carpool
1.6%
1.9%
In 4 person carpool
0.7%
0.2%
In 5-6 person carpool
0.5%
0.4%
In 7+ person carpool
0%
0.1%
How many people usually rode to work in the car, truck or van.
Real Estate
Real estate in Nashville is generally more expensive than in Colorado Springs, with a median home cost being higher. Colorado Springs, however, has seen recent growth in its housing market, indicating potential for investment.
Neighborhoods
Both cities have diverse neighborhoods. Nashville combines a southern charm with an urban feel, highlighted in areas like Downtown, East End, and The Gulch. Colorado Springs has older, established neighborhoods like Old North End, and newer, trendy areas like Briargate.
Houses and residents
Type
Nashville-Davidson
Colorado Springs
Houses
331,262
205,380
Average household size (people)
2.3
2.4
Median year apartment built
1986
1984
Median year house/condo built
1984
1987
Length of stay in the house since moving in
12.2 years
10.6 years
Houses occupied
305,247 (92.1%)
197,542 (96.2%)
Houses occupied by owners
162,426 (53.2%)
123,398 (62.5%)
Houses occupied by renters
142,821 (46.8%)
74,144 (37.5%)
Median rent asked for vacant for-rent units
$1,391
$1,458
Median monthly housing costs
$1,291
$1,422
Median price asked for vacant for-sale houses and condos
$221,129
$595,239
Estimated median house or condo value
$346,700
$390,500
Median numbers of rooms
5.2
6
Median number of rooms in apartments
4.2
4.1
Median number of rooms in houses and condos
6.3
7.2
Median house price - detached houses
$437,686
$427,641
Median house price - in 2-unit structures
$320,904
$389,381
Median house price - in 3-to-4-unit structures
$319,119
$295,560
Median house price - in 5 or more unit structures
$305,249
$258,564
Median house price - mobile homes
$133,346
$30,081
Median house price - Townhouses or other attached units
$328,258
$308,944
Median house price - All housing units
$412,434
$403,675
Median house age
35
35
Renting percentage
44.6%
39.9%
Housing density (houses/condos per square mile)
699.9
1,105.7
House value disparities
31%
25.2%
Household income disparities
45.4%
41%
Median household income for houses/condes with a mortgage
$93,092
$99,037
Median household income for apartments without a mortgage
$68,871
$72,581
Housing units without a mortgage
3,189 (2.8%)
1,835 (2.1%)
Housing units with both a second mortgage and home equity loan
10,988 (9.6%)
6,564 (7.3%)
Housing units with a mortgage
110,850 (97.2%)
87,580 (97.9%)
Housing units with a home equity loan
333 (0.3%)
86 (0.1%)
Housing units with a second mortgage
13,192 (11.6%)
7,898 (8.8%)
House/condo owner moved in on average (years ago)
9
7
House/condo renter moved in on average (years ago)
1
1
Housing units lacking complete kitchen facilities
1.3%
0.6%
Housing units lacking complete plumbing facilities
0.5%
0.3%
Housing units in structures
Housing units in structures
Nashville-Davidson
Colorado Springs
One, detached
50.9%
62.3%
One, attached
8.4%
8.3%
Two
3.3%
1.4%
3 or 4
3.1%
4.7%
5 to 9
7.1%
4.9%
10 to 19
8.7%
6.7%
20 to 49
5.3%
6.1%
50 or more
11.9%
4.0%
Mobile homes
1.2%
1.7%
Boats, RVs, vans, etc.
0.1%
0.0%
Median real estate property taxes paid for housing units
Self-employed workers in own not incorporated business
31,952
13,110
State government workers
15,693
7,029
Unpaid family workers
463
735
Industries and Occupations
In Nashville, the health care industry dominates, followed by music and entertainment sectors. In Colorado Springs, the military and high-tech sectors play a significant role, along with a growing emphasis on cybersecurity.
Nashville hosts a large concentration of highly ranked healthcare facilities and research institutions, such as Vanderbilt University Medical Center. Colorado Springs also provides quality healthcare, with Penrose-St. Francis Health Services being highly rated.
Health (county statistics)
Type
Nashville-Davidson
Colorado Springs
General health status score of residents in this county from 1 (poor) to 5 (excellent)
Nashville is known for its well-developed infrastructure with a strong focus on industry and music venues. Colorado Springs offers a well-rounded infrastructure with a military focus, including several military bases and a prominent high-tech sector.
HMDA - Conventional home purchase loans - Applications denied
Year
Nashville-Davidson
Colorado Springs
1999
2,397
1,957
2000
1,451
985
2001
1,130
756
2002
1,075
502
2003
2,231
1,131
2004
2,731
1,811
2005
3,231
2,631
2006
3,720
2,188
2007
2,419
1,246
2008
952
496
2009
532
233
Culture and Food
Both cities offer rich cultural experiences. Nashville is known for its music scene, particularly country music, with numerous live venues and music festivals throughout the year. Colorado Springs offers a robust outdoors culture, food festivals, and close proximity to nationally known breweries.
Sports Teams
Both cities have thriving sports scenes. Nashville boasts teams in the NFL and NHL along with a strong collegiate sports presence. Colorado Springs is home to several minor league teams and is the headquarters for the U.S. Olympic Committee and Training Center.


 Nashville-Davidson, TN and
  Colorado Springs, CO : 1,004.0 miles
 Nashville-Davidson, TN and
  Colorado Springs, CO : 1,004.0 miles