When comparing Oklahoma City, OK to Lubbock, TX, both cities offer unique experiences and characteristics. From geographic conditions to the local economy, quality of life can vary greatly. Deciding on which city to relocate or visit depends upon individual priorities and preferences. This comparison will take into account several aspects of both cities, including crime rates, weather, cost of living, education standards, work opportunities, city infrastructure, diverse industries and occupations, dominant employers, real estate market, neighborhood vibes, transportation availability, tax burdens, cultural offerings, sports teams, geographical conditions, and available healthcare.
Distance between
Oklahoma City, OK and
Lubbock, TX : 280.4 miles
Oklahoma City's population is larger by 164%. Its population has grown by 181,593 people (35.9%) since 2000. The population of Lubbock has grown by 61,429 people (30.8%) during that time.
Oklahoma City tends to have a slightly higher crime rate compared to the national average and Lubbock, TX. However, like many cities, crime rates can vary significantly from neighborhood to neighborhood. Lubbock's overall crime rate is lower than Oklahoma City's, making it relatively safer. Both cities have instituted robust community policing programs designed to improve safety and reduce crime rates.
City-data.com crime index counts serious crimes and violent crime more heavily. It adjusts for the number of visitors and daily workers commuting into cities. (higher means more crime, U.S. average = 301.1)
City-data.com crime index counts serious crimes and violent crime more heavily. It adjusts for the number of visitors and daily workers commuting into cities. (higher means more crime, U.S. average = 301.1)
Sex Offenders
According to our data, there are 1,386 registered sex offenders living in Oklahoma City and 595 registered sex offenders living in . The ratio of residents to sex offenders in Oklahoma City is 461 to 1; the ratio in Lubbock is 424 to 1. The number of registered sex offenders compared to the number of residents in Oklahoma City is near to than in Lubbock.
Cost of Living
The cost of living in both cities is below the national average, however, Lubbock's cost of living is slightly lower than Oklahoma City's. In general, housing costs are lower in Lubbock than in Oklahoma City. Other costs such as groceries, utilities, transportation, and healthcare are comparative in both cities.
Income Tax
Oklahoma imposes a state income tax, with rates ranging from 0.5% to 5%, while Texas, including Lubbock, has no state income tax. This could be a significant consideration for those with high incomes.
Property Tax
Property taxes in both cities are around the national average, with Oklahoma City having slightly higher rates compared to Lubbock.
Sales Tax
Oklahoma City has a sales tax rate of 8.375%, while Lubbock has a lower sales tax rate of 8.25%. Both rates are higher than the U.S average, and it's something to consider.
Income
Type
Oklahoma City
Lubbock
Estimated median household income
$59,214
$54,747
Estimated per capita income
$31,630
$30,618
Cost of living index (U.S. average is 100)
85.4
83.8
If you make $50,000 in Lubbock, you will have to make $50,955 in Oklahoma City to maintain the same standard of living.
Geographical Conditions
Oklahoma City sits in the Great Plains region, characterized by flat, fertile land, and is prone to tornadoes because of its location in Tornado Alley. Lubbock, located in the High Plains, is relatively flat with a semi-arid climate.
Oklahoma City has a large school system, with several highly rated schools and it's home to several universities, including the University of Oklahoma. In contrast, Lubbock houses Texas Tech University and has a solid reputation for its public education system. Educational opportunities are ample in both cities.
Both cities have diverse economies. Oklahoma City's economy is largely driven by the petroleum industry, while Lubbock's economy is more based on agriculture, education, and healthcare services. Oklahoma City generally has a slightly lower unemployment rate compared to Lubbock, offering more work opportunities.
Biggest Employers
In Oklahoma City, some of the largest employers include the State of Oklahoma, Integris Health, and the University of Oklahoma. For Lubbock, major employers include Texas Tech University, Covenant Health System, and Lubbock Independent School District.
There were 4,127 building permits issued in Oklahoma City in 2012 (2834 more than in 2011) compared to 2,454 building permits issued in Lubbock in 2012 (1825 more than in 2011).
In Oklahoma City (Oklahoma County), 41.7% voted for Democrats and 58.3% for Republicans in 2012 Presidential Election. In Lubbock (Lubbock County), 28.8% voted for Democrats and 69.6% for Republicans.
Elections
Type
Democrats
Republicans
Other
Year
Oklahoma City
Lubbock
Oklahoma City
Lubbock
Oklahoma City
Lubbock
2020
48.1%
33.2%
49.2%
65.4%
2.7%
1.3%
2016
41.2%
28.3%
51.7%
66.4%
7.1%
5.3%
2012
41.7%
28.8%
58.3%
69.6%
0.0%
1.5%
2008
41.6%
31.3%
58.4%
68.1%
0.0%
0.7%
2004
35.8%
24.2%
64.2%
75.4%
0.0%
0.4%
2000
36.6%
24.4%
62.3%
73.9%
1.1%
1.7%
1996
36.5%
30.6%
54.7%
63.5%
8.8%
5.9%
Breakdown of population affiliated with a religious congregation
Type
Adherents
Congregations
Religion
Oklahoma City
Lubbock
Oklahoma City
Lubbock
SOUTHERN BAPTIST CONVENTION
20.7%
16.1%
20.0%
31.5%
CATHOLIC CHURCH
8.5%
13.0%
3.0%
5.0%
EPISCOPAL CHURCH
0.7%
0.7%
1.3%
0.9%
INTERNA PENTECO HOLINESS CHURCH
0.7%
0.2%
2.9%
2.1%
LUTHERAN CHURCH
0.5%
0.3%
1.0%
0.9%
SEVENTH DAY ADVENTIST CHURCH
0.4%
0.2%
1.5%
0.9%
AMERICAN BAPTIST CHURCHES IN THE USA
0.3%
0.0%
0.1%
0.0%
MUSLIM ESTIMATE
0.3%
1.8%
0.6%
0.6%
Weather
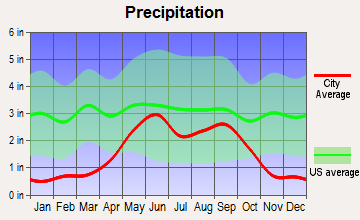
Oklahoma City experiences all four seasons with generally mild winters and hot, humid summers. Tornadoes can be a concern due to its location in "Tornado Alley". Lubbock, on the other hand, is in a semi-arid region, experiencing mild winters and hot, dry summers. Lubbock also experiences less rainfall compared to Oklahoma City, which can be a consideration for those with weather-related concerns.
Weather and climate
Type
Oklahoma City
Lubbock
Temperature - Average
60.1°F
59.7°F
Humidity - Average morning or afternoon humidity
73.1%
64.4%
Humidity - Differences between morning and afternoon humidity
35%
42.3%
Humidity - Maximum monthly morning or afternoon humidity
85%
79.7%
Humidity - Minimum monthly morning or afternoon humidity
50%
37.4%
Precipitation - Yearly average
35.7 in
19 in
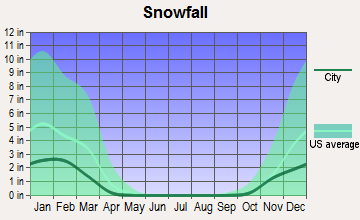
Snowfall - Yearly average
17.2 in
16.7 in
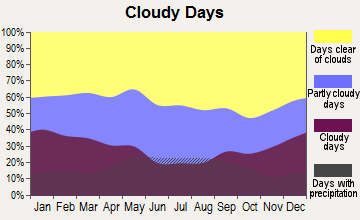
Clouds - Number of days clear of clouds
23.1%
26.6%
Sunshine amount - Average
72.1%
78.7%
Sunshine amount - Differences during a year
21%
16.7%
Sunshine amount - Maximum monthly
79%
80%
Sunshine amount - Minimum monthly
58%
63.3%
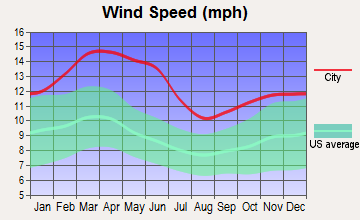
Wind speed - Average
12.3 mph
12.8 mph
Average climate in Oklahoma City, Oklahoma
Average climate in Lubbock, Texas
Air pollution
Type
AQI
CO
NO2
OZONE
PB
PM10
PM25
SO2
Year
Oklahoma City
Lubbock
Oklahoma City
Oklahoma City
Oklahoma City
Oklahoma City
Oklahoma City
Oklahoma City
Lubbock
Oklahoma City
2018
85
62
0.29
N/A
6.6
N/A
31.9
N/A
0.002
N/A
21.3
N/A
9.6
6.6
0.0
N/A
2017
82
56
0.32
N/A
6.7
N/A
33.0
N/A
0.002
N/A
20.7
N/A
8.9
6.3
0.0
N/A
2016
72
N/A
0.29
N/A
6.6
N/A
31.9
N/A
0.002
N/A
19.4
N/A
8.5
N/A
0.2
N/A
2015
76
N/A
0.24
N/A
7.0
N/A
31.5
N/A
0.002
N/A
19.1
N/A
7.8
N/A
0.5
N/A
2014
84
61
0.15
N/A
7.1
N/A
32.4
N/A
0.002
N/A
N/A
N/A
8.7
7.6
0.1
N/A
2013
84
68
0.14
N/A
8.6
N/A
32.8
N/A
0.002
N/A
N/A
N/A
9.3
7.5
0.2
N/A
2012
97
76
0.13
N/A
9.4
N/A
34.0
N/A
0.007
N/A
N/A
N/A
7.9
9.0
0.3
N/A
2011
107
81
0.24
N/A
9.9
N/A
36.3
N/A
0.003
N/A
N/A
N/A
9.9
9.1
0.8
N/A
2010
81
57
0.30
N/A
8.8
N/A
31.7
N/A
0.002
N/A
N/A
N/A
9.8
6.7
0.7
N/A
2009
82
59
0.52
N/A
8.1
N/A
31.9
N/A
0.002
N/A
N/A
N/A
10.2
7.0
0.7
N/A
2008
78
N/A
0.51
N/A
9.8
N/A
31.0
N/A
N/A
N/A
N/A
N/A
N/A
N/A
1.4
N/A
2007
81
N/A
0.44
N/A
10.2
N/A
29.4
N/A
N/A
N/A
N/A
N/A
N/A
N/A
2.0
N/A
2006
95
N/A
0.43
N/A
10.1
N/A
33.7
N/A
N/A
N/A
N/A
N/A
N/A
N/A
1.2
N/A
2005
88
N/A
0.38
N/A
11.6
N/A
31.0
N/A
N/A
N/A
N/A
N/A
N/A
N/A
1.3
N/A
2004
75
N/A
0.46
N/A
10.5
N/A
28.6
N/A
N/A
N/A
N/A
N/A
N/A
N/A
0.6
N/A
2003
87
N/A
0.42
N/A
10.9
N/A
30.8
N/A
N/A
N/A
N/A
N/A
N/A
N/A
N/A
N/A
2002
91
N/A
0.35
N/A
14.3
N/A
29.0
N/A
N/A
N/A
N/A
N/A
N/A
N/A
2.0
N/A
2001
87
N/A
0.69
N/A
13.1
N/A
31.0
N/A
N/A
N/A
N/A
N/A
N/A
N/A
1.8
N/A
2000
89
N/A
0.66
N/A
13.4
N/A
29.5
N/A
N/A
N/A
N/A
N/A
N/A
N/A
3.0
N/A
Natural disasters
Type
Oklahoma City
Lubbock
Tornado activity compared to U.S. average
353.4%
166%
Earthquake activity compared to U.S. average
938.9%
535.5%
Natural disasters compared to U.S. average
43%
14%
Transportation
Oklahoma City is served by a comprehensive public transportation system, including buses and a modern streetcar system for urban commuting. Lubbock, best navigated by car, has a denser network of routes, served mainly by city buses. Both cities have international airports and are well served by inter-city road networks.
Transport
Type
Oklahoma City
Lubbock
Amtrak stations
1
0
Amtrak stations nearby
2
0
FAA registered aircraft
0
293
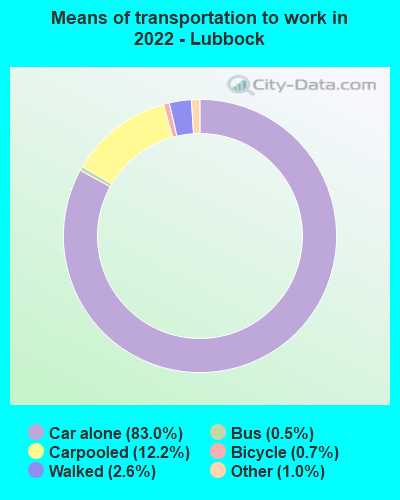
Means of transportation to work
Type
Oklahoma City
Lubbock
Bicycle
0.2%
0.3%
Bus
0.3%
0.8%
Carpooled
8.6%
9.6%
Car alone
87.6%
86.4%
Motorcycle
0.1%
0.2%
Taxicab
0.2%
0.1%
Walked
1.4%
1.9%
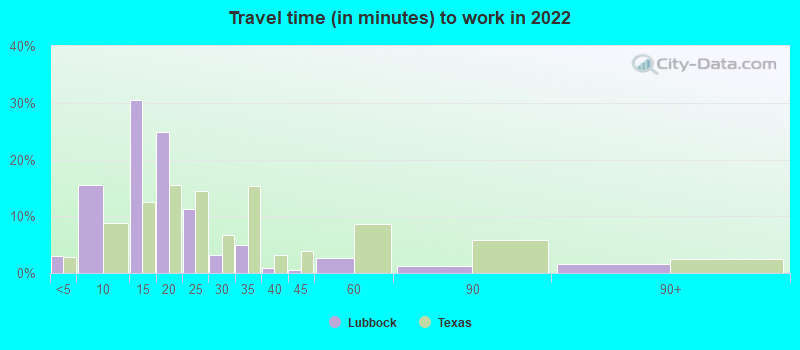
Average travel time to work
Type
Oklahoma City
Lubbock
Average
25.6 min
18.2 min
Other means
21 min
18 min
Public transportation
33.1 min
31.3 min
Private vehicle occupancy
Type
Oklahoma City
Lubbock
Average
1.2
1.2
Drove alone
89.5%
89.3%
In 2 person carpool
7.1%
7.9%
In 3 person carpool
1.9%
1%
In 4 person carpool
0.7%
0.6%
In 5-6 person carpool
0.5%
1.2%
In 7+ person carpool
0.2%
0.1%
How many people usually rode to work in the car, truck or van.
Real Estate
Oklahoma City's real estate market is somewhat hotter than Lubbock's. The median home cost in Oklahoma City is higher than in Lubbock. However, both cities offer a good mix of urban and suburban housing options.
Neighborhoods
Oklahoma City has a wide range of neighborhoods to choose from, each with its unique vibe. From the historic charm of Heritage Hills to the modern feel of Deep Deuce, there is something for everyone. Likewise, Lubbock offers diverse neighborhoods, from the college-centered Tech Terrace to the family-friendly Lakeridge.
Houses and residents
Type
Oklahoma City
Lubbock
Houses
302,241
113,800
Average household size (people)
2.5
2.5
Median year apartment built
1978
1985
Median year house/condo built
1986
1985
Length of stay in the house since moving in
11.8 years
12.4 years
Houses occupied
275,285 (91.1%)
104,426 (91.8%)
Houses occupied by owners
164,470 (59.7%)
53,722 (51.4%)
Houses occupied by renters
110,815 (40.3%)
50,704 (48.6%)
Median rent asked for vacant for-rent units
$1,241
$760.15
Median monthly housing costs
$983
$1,010
Median price asked for vacant for-sale houses and condos
$278,299
$431,965
Estimated median house or condo value
$190,900
$171,400
Median numbers of rooms
5.5
5.2
Median number of rooms in apartments
4.3
4
Median number of rooms in houses and condos
6.2
6.2
Median house price - detached houses
$254,772
$217,964
Median house price - in 2-unit structures
$318,820
$266,863
Median house price - in 3-to-4-unit structures
$128,784
$270,056
Median house price - in 5 or more unit structures
$170,231
$186,477
Median house price - mobile homes
$112,256
$60,138
Median house price - occupied boats, rvs, vans etc.
$67,765
$28,841
Median house price - Townhouses or other attached units
$245,885
$159,383
Median house price - All housing units
$249,488
$215,105
Median house age
40
37
Renting percentage
40.3%
45.4%
Housing density (houses/condos per square mile)
497.9
991.2
House value disparities
34.7%
37.4%
Household income disparities
44.3%
48.2%
Median household income for houses/condes with a mortgage
$87,907
$96,150
Median household income for apartments without a mortgage
$61,761
$60,175
Housing units without a mortgage
1,238 (1.2%)
244 (0.8%)
Housing units with both a second mortgage and home equity loan
4,838 (4.7%)
577 (1.9%)
Housing units with a mortgage
100,798 (98.8%)
29,683 (99.2%)
Housing units with a home equity loan
123 (0.1%)
0 (0%)
Housing units with a second mortgage
5,921 (5.8%)
705 (2.4%)
House/condo owner moved in on average (years ago)
9
9
House/condo renter moved in on average (years ago)
1
1
Housing units lacking complete kitchen facilities
3.1%
2.9%
Housing units lacking complete plumbing facilities
1.9%
1.9%
Housing units in structures
Housing units in structures
Oklahoma City
Lubbock
One, detached
67.8%
64.8%
One, attached
3.4%
2.7%
Two
2.0%
3.6%
3 or 4
5.1%
5.0%
5 to 9
6.0%
6.5%
10 to 19
5.6%
5.4%
20 to 49
2.4%
2.8%
50 or more
4.6%
6.9%
Mobile homes
3.1%
2.2%
Boats, RVs, vans, etc.
0.1%
0.1%
Median real estate property taxes paid for housing units
Self-employed workers in own not incorporated business
20,964
8,411
State government workers
17,132
10,797
Unpaid family workers
555
523
Industries and Occupations
Major industries in Oklahoma City include petroleum, technology, natural gas, and services. In contrast, Lubbock's dominant industries are education, healthcare, and agriculture. Both cities offer a good blend of traditional and modern occupations, providing a range of opportunities for job seekers.
Both cities boast excellent healthcare facilities. Oklahoma City is home to numerous top-rated hospitals and health centers. Lubbock, the healthcare hub of West Texas, offers state-of-the-art medical facilities, especially through the Texas Tech University Health Sciences Center.
Health (county statistics)
Type
Oklahoma City
Lubbock
General health status score of residents in this county from 1 (poor) to 5 (excellent)
Oklahoma City boasts an extensive infrastructure, from its public utilities to road networks and public buildings. It's well-connected to the rest of the country by its network of highways. Similarly, Lubbock's infrastructure is robust and reliable, especially with its well-maintained highways and state-of-the-art medical facilities.
Infrastructure
Type
Oklahoma City
Lubbock
Hospitals
61
36
TV stations
20
13
Arenas or stadiums
4
3
Bank branches located here
183
97
Bank institutions located here
44
22
Main business address for public companies
15
3
Drinking water stations with no reported violations in the past
4
3
Drinking water stations with reported violations in the past
HMDA - Conventional home purchase loans - Applications denied
Year
Oklahoma City
Lubbock
1999
2,925
1,025
2000
2,396
673
2001
1,824
472
2002
1,507
402
2003
2,014
0
2004
2,323
542
2005
3,134
566
2006
3,132
565
2007
2,036
343
2008
1,143
161
2009
593
115
Culture and Food
Oklahoma City boasts a rich cultural scene, with numerous museums, theaters, and music festivals, and a diverse food scene that blends Southern, Native American, and Mexican cuisines. Lubbock is known for its vibrant live music scene, particularly for country music, and its food scene strongly features Tex-Mex and barbecue.
Sports Teams
Sports fans will find a lot to love in either city. Oklahoma City is home to the NBA's Oklahoma City Thunder, while Lubbock is home to the Texas Tech Red Raiders collegiate teams. Both cities also host minor league teams and regularly host significant sporting events.


 Oklahoma City, OK
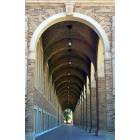
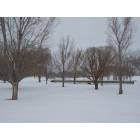
 Lubbock, TX