When comparing Oklahoma City, OK to Overland Park, KS, there are numerous factors to take into consideration. Each city has its own unique qualities, strengths, and areas in need of development. This comparison will deep dive into crime and safety, weather, cost of living, education, work and economy, infrastructure, industries and occupations, amongst other crucial aspects. This information will not only be useful for those considering relocation but also for tourists trying to identify which place offers a better experience in terms of safety, affordability, recreational activities, and overall quality of life.
Distance between
Oklahoma City, OK and
Overland Park, KS : 285.9 miles
Oklahoma City's population is larger by 249%. Its population has grown by 181,593 people (35.9%) since 2000. The population of Overland Park has grown by 48,026 people (32.2%) during that time.
Oklahoma City's crime rates are generally higher compared to Overland Park. According to the FBI's crime data, both the violent and property crime rates are higher in Oklahoma City than in Overland Park, noting that Overland Park is one of the safer cities in Kansas. It's important for potential relocators or visitors to consider this factor in their decision-making process.
City-data.com crime index counts serious crimes and violent crime more heavily. It adjusts for the number of visitors and daily workers commuting into cities. (higher means more crime, U.S. average = 301.1)
City-data.com crime index counts serious crimes and violent crime more heavily. It adjusts for the number of visitors and daily workers commuting into cities. (higher means more crime, U.S. average = 301.1)
Sex Offenders
According to our data, there are 1,388 registered sex offenders living in Oklahoma City and 132 registered sex offenders living in . The ratio of residents to sex offenders in Oklahoma City is 460 to 1; the ratio in Overland Park is 1,431 to 1. The number of registered sex offenders compared to the number of residents is much larger in Oklahoma City than that in Overland Park.
Cost of Living
Overall, the cost of living in Oklahoma City is generally lower than in Overland Park. This can be seen in factors like housing, groceries, and healthcare. Conversely, Overland Park, despite being more expensive, offers higher average salaries, meaning the higher cost might be offset for many residents.
Income Tax
Kansas has a higher state income tax rate than Oklahoma. However, the difference is moderate and might not heavily impact the decision to move or visit one city over the other.
Property Tax
Property taxes also tend to be higher in Overland Park, Kansas, compared to Oklahoma City, Oklahoma. This is something to keep in mind if you're considering purchasing property.
Sales Tax
Oklahoma City has a higher combined city and state sales tax rate compared to Overland Park. This is an important consideration for both residents and tourists planning shopping or dining out.
Income
Type
Oklahoma City
Overland Park
Estimated median household income
$59,214
$89,280
Estimated per capita income
$31,630
$50,828
Cost of living index (U.S. average is 100)
85.4
88.1
If you make $50,000 in Oklahoma City, you will have to make $51,581 in Overland Park to maintain the same standard of living.
Geographical Conditions
Oklahoma City is located in the Great Plains region, providing flat, open landscapes perfect for agricultural activities. Overland Park is situated near the Kansas and Missouri rivers, with more hilly terrain and lush green spaces.
When it comes to education, Overland Park ranks higher than Oklahoma City. The school district in Overland Park is recognized for its excellent performance, while Oklahoma City schools face some challenges. Furthermore, Overland Park is in proximity to several universities and colleges, with the University of Kansas and Kansas State University being only short drives away.
Oklahoma City has a diverse economy with strong sectors in energy, healthcare, and manufacturing. Overland Park, on the other hand, thrives in telecommunications, healthcare, and finance. Both cities have positive job growth but Overland Park has a significantly lower unemployment rate.
Biggest Employers
The biggest employers in Oklahoma City include the state government, Mike Monroney Aeronautical Center, and the University of Oklahoma Health Sciences Center. Overland Park, however, houses the headquarters of Sprint Corporation, one of the city’s largest employers, with other major employers including Blue Valley School District and Black & Veatch.
There were 4,127 building permits issued in Oklahoma City in 2012 (2834 more than in 2011) compared to 635 building permits issued in Overland Park in 2012 (361 more than in 2011).
In Oklahoma City (Oklahoma County), 41.7% voted for Democrats and 58.3% for Republicans in 2012 Presidential Election. In Overland Park (Johnson County), 40.3% voted for Democrats and 57.8% for Republicans.
Elections
Type
Democrats
Republicans
Other
Year
Oklahoma City
Overland Park
Oklahoma City
Overland Park
Oklahoma City
Overland Park
2020
48.1%
53.1%
49.2%
44.8%
2.7%
2.1%
2016
41.2%
44.1%
51.7%
46.7%
7.1%
9.1%
2012
41.7%
40.3%
58.3%
57.8%
0.0%
1.9%
2008
41.6%
44.8%
58.4%
53.8%
0.0%
1.3%
2004
35.8%
37.9%
64.2%
61.2%
0.0%
0.9%
2000
36.6%
36.4%
62.3%
59.8%
1.1%
3.7%
1996
36.5%
35.7%
54.7%
57.8%
8.8%
6.5%
Breakdown of population affiliated with a religious congregation
Type
Adherents
Congregations
Religion
Oklahoma City
Overland Park
Oklahoma City
Overland Park
SOUTHERN BAPTIST CONVENTION
20.7%
4.5%
20.0%
7.4%
CATHOLIC CHURCH
8.5%
18.8%
3.0%
5.1%
EPISCOPAL CHURCH
0.7%
0.7%
1.3%
1.4%
INTERNA PENTECO HOLINESS CHURCH
0.7%
0.0%
2.9%
0.0%
LUTHERAN CHURCH
0.5%
1.8%
1.0%
2.6%
SEVENTH DAY ADVENTIST CHURCH
0.4%
0.3%
1.5%
1.7%
AMERICAN BAPTIST CHURCHES IN THE USA
0.3%
0.9%
0.1%
3.7%
MUSLIM ESTIMATE
0.3%
0.5%
0.6%
0.9%
EVANGELICAL LUTHERAN CHURCH IN AMERICA
0.2%
1.4%
0.9%
3.4%
Weather
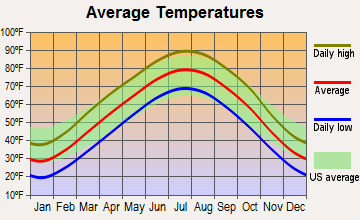
Both cities experience the full 4-season climate, but Oklahoma City tends to have more extreme weather. Summers in Oklahoma City can be hotter, reaching the high 90s, while Overland Park rarely gets above 90 degrees. Winter temperatures are similar in both cities, with cold temperatures and potential for snowfall. Oklahoma City, however, is located in the center of Tornado Alley and can experience severe weather conditions including tornadoes.
Weather and climate
Type
Oklahoma City
Overland Park
Temperature - Average
60.1°F
55.5°F
Humidity - Average morning or afternoon humidity
73.1%
76.3%
Humidity - Differences between morning and afternoon humidity
35%
30.4%
Humidity - Maximum monthly morning or afternoon humidity
85%
86.2%
Humidity - Minimum monthly morning or afternoon humidity
50%
55.7%
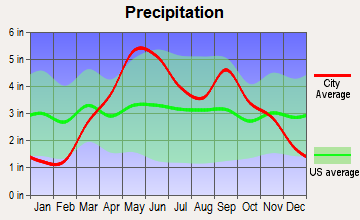
Precipitation - Yearly average
35.7 in
39.6 in
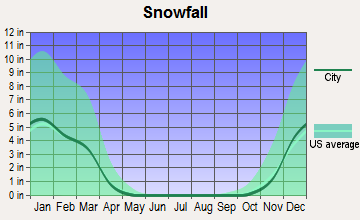
Snowfall - Yearly average
17.2 in
38.1 in
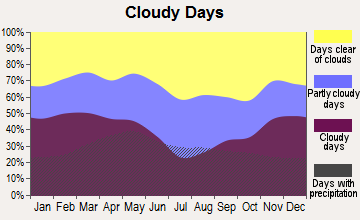
Clouds - Number of days clear of clouds
23.1%
20.1%
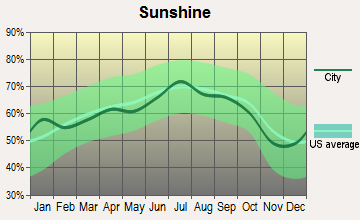
Sunshine amount - Average
72.1%
67%
Sunshine amount - Differences during a year
21%
25.7%
Sunshine amount - Maximum monthly
79%
73.8%
Sunshine amount - Minimum monthly
58%
48.2%
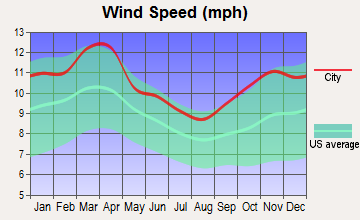
Wind speed - Average
12.3 mph
11 mph
Average climate in Oklahoma City, Oklahoma
Average climate in Overland Park, Kansas
Air pollution
Type
AQI
CO
NO2
OZONE
PB
PM10
PM25
SO2
Year
Oklahoma City
Overland Park
Oklahoma City
Overland Park
Oklahoma City
Overland Park
Oklahoma City
Overland Park
Oklahoma City
Oklahoma City
Overland Park
Oklahoma City
Overland Park
Oklahoma City
Overland Park
2018
85
85
0.29
0.24
6.6
10.6
31.9
28.5
0.002
N/A
21.3
22.0
9.6
7.6
0.0
0.7
2017
82
87
0.32
0.23
6.7
10.7
33.0
29.0
0.002
N/A
20.7
22.5
8.9
7.4
0.0
1.0
2016
72
80
0.29
0.26
6.6
11.5
31.9
27.6
0.002
N/A
19.4
22.2
8.5
7.5
0.2
1.2
2015
76
89
0.24
0.29
7.0
12.2
31.5
27.9
0.002
N/A
19.1
33.6
7.8
9.3
0.5
3.0
2014
84
88
0.15
0.27
7.1
12.3
32.4
28.4
0.002
N/A
N/A
28.5
8.7
10.4
0.1
3.3
2013
84
83
0.14
0.42
8.6
12.5
32.8
30.1
0.002
N/A
N/A
30.8
9.3
10.5
0.2
3.8
2012
97
97
0.13
0.52
9.4
13.2
34.0
32.4
0.007
N/A
N/A
N/A
7.9
10.9
0.3
4.7
2011
107
97
0.24
0.45
9.9
14.0
36.3
30.2
0.003
N/A
N/A
N/A
9.9
11.3
0.8
4.2
2010
81
89
0.30
0.40
8.8
14.1
31.7
28.9
0.002
N/A
N/A
N/A
9.8
11.3
0.7
5.3
2009
82
87
0.52
0.29
8.1
13.5
31.9
27.9
0.002
N/A
N/A
N/A
10.2
9.8
0.7
5.4
2008
78
86
0.51
0.40
9.8
17.1
31.0
26.9
N/A
N/A
N/A
N/A
N/A
11.3
1.4
4.9
2007
81
92
0.44
0.42
10.2
15.9
29.4
27.8
N/A
N/A
N/A
N/A
N/A
13.1
2.0
4.2
2006
95
93
0.43
0.38
10.1
16.7
33.7
30.0
N/A
N/A
N/A
N/A
N/A
12.4
1.2
4.8
2005
88
105
0.38
0.54
11.6
17.9
31.0
29.4
N/A
N/A
N/A
N/A
N/A
N/A
1.3
4.4
2004
75
81
0.46
0.47
10.5
16.3
28.6
27.1
N/A
N/A
N/A
N/A
N/A
N/A
0.6
4.1
2003
87
95
0.42
0.43
10.9
16.8
30.8
28.2
N/A
N/A
N/A
N/A
N/A
N/A
N/A
4.0
2002
91
91
0.35
0.52
14.3
15.7
29.0
26.7
N/A
N/A
N/A
N/A
N/A
N/A
2.0
2.7
2001
87
85
0.69
0.53
13.1
16.0
31.0
26.5
N/A
N/A
N/A
N/A
N/A
N/A
1.8
1.4
2000
89
97
0.66
0.80
13.4
14.9
29.5
27.9
N/A
N/A
N/A
N/A
N/A
N/A
3.0
2.1
Natural disasters
Type
Oklahoma City
Overland Park
Tornado activity compared to U.S. average
353.4%
201.8%
Earthquake activity compared to U.S. average
938.9%
619%
Natural disasters compared to U.S. average
43%
10%
Transportation
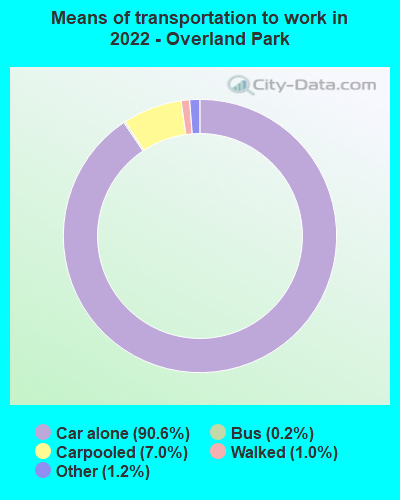
Both cities offer public transportation facilities. Oklahoma City's public transit includes buses and a modern streetcar system, while Overland Park relies primarily on buses. Both cities are car-dependent with most people using private vehicles for commuting.
Transport
Type
Oklahoma City
Overland Park
Amtrak stations
1
0
Amtrak stations nearby
2
3
FAA registered aircraft
0
201
FAA registered aircraft manufacturers and dealers
0
9
Means of transportation to work
Type
Oklahoma City
Overland Park
Bicycle
0.2%
0.2%
Bus
0.3%
0.5%
Carpooled
8.6%
5.6%
Car alone
87.6%
90.5%
Taxicab
0.2%
0%
Walked
1.4%
1.9%
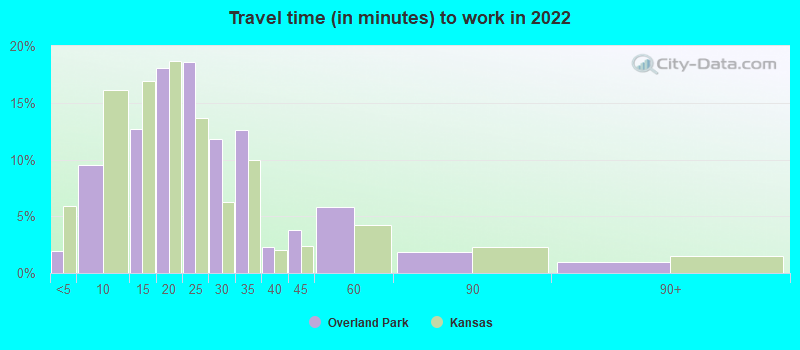
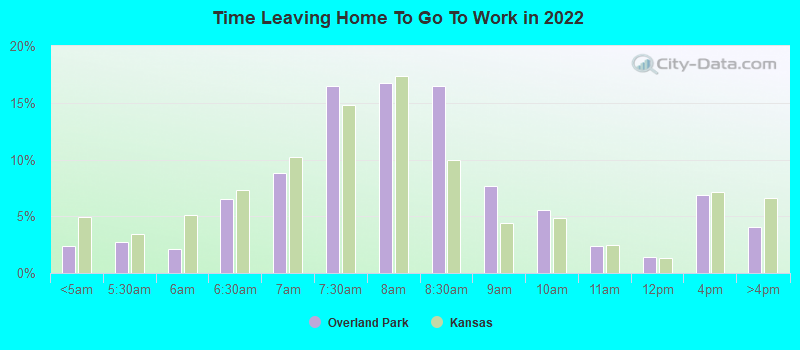
Average travel time to work
Type
Oklahoma City
Overland Park
Average
25.6 min
23.5 min
Other means
21 min
20.4 min
Public transportation
33.1 min
33.8 min
Private vehicle occupancy
Type
Oklahoma City
Overland Park
Average
1.2
1.1
Drove alone
89.5%
93.1%
In 2 person carpool
7.1%
5.3%
In 3 person carpool
1.9%
1%
In 4 person carpool
0.7%
0.2%
In 5-6 person carpool
0.5%
0.1%
In 7+ person carpool
0.2%
0.2%
How many people usually rode to work in the car, truck or van.
Real Estate
Real estate is generally cheaper in Oklahoma City than in Overland Park, with the median home cost being significantly lower. However, Overland Park's real estate market has shown a trend of consistent growth, which could be an attraction for potential investors.
Neighborhoods
Oklahoma City boasts diverse neighborhoods, each with its own unique charm, like the historic Paseo Arts District or the vibrant Bricktown. Overland Park offers family-friendly neighborhoods like Nottingham and Wellington West, known for their safety and highly rated schools.
Houses and residents
Type
Oklahoma City
Overland Park
Houses
302,241
85,708
Average household size (people)
2.5
2.4
Median year apartment built
1978
1994
Median year house/condo built
1986
1986
Length of stay in the house since moving in
11.8 years
11.8 years
Houses occupied
275,285 (91.1%)
82,593 (96.4%)
Houses occupied by owners
164,470 (59.7%)
50,359 (61%)
Houses occupied by renters
110,815 (40.3%)
32,234 (39%)
Median rent asked for vacant for-rent units
$1,241
$2,193
Median monthly housing costs
$983
$1,378
Median price asked for vacant for-sale houses and condos
$278,299
$298,188
Estimated median house or condo value
$190,900
$352,000
Median numbers of rooms
5.5
6.2
Median number of rooms in apartments
4.3
3.7
Median number of rooms in houses and condos
6.2
7.9
Median house price - detached houses
$254,772
$369,400
Median house price - in 2-unit structures
$318,820
$192,477
Median house price - in 3-to-4-unit structures
$128,784
$187,166
Median house price - in 5 or more unit structures
$170,231
$237,623
Median house price - mobile homes
$112,256
$162,267
Median house price - Townhouses or other attached units
$245,885
$246,600
Median house price - All housing units
$249,488
$355,351
Median house age
40
32
Renting percentage
40.3%
34.8%
Housing density (houses/condos per square mile)
497.9
1,510.3
House value disparities
34.7%
28.5%
Household income disparities
44.3%
40.2%
Median household income for houses/condes with a mortgage
$87,907
$137,694
Median household income for apartments without a mortgage
$61,761
$88,940
Housing units without a mortgage
1,238 (1.2%)
641 (1.9%)
Housing units with both a second mortgage and home equity loan
4,838 (4.7%)
3,500 (10.3%)
Housing units with a mortgage
100,798 (98.8%)
33,381 (98.1%)
Housing units with a home equity loan
123 (0.1%)
134 (0.4%)
Housing units with a second mortgage
5,921 (5.8%)
3,937 (11.6%)
House/condo owner moved in on average (years ago)
9
9
House/condo renter moved in on average (years ago)
1
1
Housing units lacking complete kitchen facilities
3.1%
1.1%
Housing units lacking complete plumbing facilities
1.9%
0.1%
Housing units in structures
Housing units in structures
Oklahoma City
Overland Park
One, detached
67.8%
56.8%
One, attached
3.4%
7.6%
Two
2.0%
1.4%
3 or 4
5.1%
8.1%
5 to 9
6.0%
10.7%
10 to 19
5.6%
5.7%
20 to 49
2.4%
2.6%
50 or more
4.6%
6.5%
Mobile homes
3.1%
0.5%
Boats, RVs, vans, etc.
0.1%
0.0%
Median real estate property taxes paid for housing units
Self-employed workers in own not incorporated business
20,964
6,111
State government workers
17,132
4,203
Unpaid family workers
555
0
Industries and Occupations
Key industries in Oklahoma City include aerospace and defense, energy, and biotechnology, while Overland Park has a robust presence of telecommunications, finance, insurance, and professional services. Both cities boast a diverse array of occupations for job seekers.
Both cities have access to quality healthcare facilities, however, Oklahoma City is home to prestigious medical research institutions like the University of Oklahoma Health Sciences Center.
Health (county statistics)
Type
Oklahoma City
Overland Park
General health status score of residents in this county from 1 (poor) to 5 (excellent)
In terms of infrastructure, both cities have invested in developments. Oklahoma City has a series of major road and public transportation improvements, while Overland Park enjoys well-maintained roads and public infrastructure. Both cities also have easy access to international airports.
HMDA - Conventional home purchase loans - Applications denied
Year
Oklahoma City
Overland Park
1999
2,925
257
2000
2,396
142
2001
1,824
106
2002
1,507
122
2003
2,014
292
2004
2,323
394
2005
3,134
425
2006
3,132
380
2007
2,036
265
2008
1,143
140
2009
593
78
Culture and Food
Both cities boast vibrant cultural and food scenes. Oklahoma City offers a mix of traditional Southern cuisine and contemporary food trends, while Overland Park, with its diverse population, offers a range of culinary experiences from around the world.
Sports Teams
Oklahoma City is home to the NBA's Oklahoma City Thunder, while Overland Park doesn't have any major professional sports teams. However, Overland Park residents are in close proximity to Kansas City, home of the NFL's Kansas City Chiefs and the MLB's Kansas City Royals.


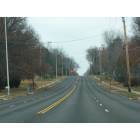
 Oklahoma City, OK
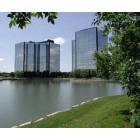
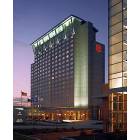
 Overland Park, KS