Philadelphia, Pennsylvania, and Kansas City, Missouri, are two vibrant American cities with unique offerings and differences. Both have strong histories and cultures and offer a distinctive lifestyle. Though they share similarities in certain aspects like education and healthcare, the differences like cost of living, weather conditions, local taxes, and job opportunities are quite noticeable. This comparison may help you decide whether the city of Brotherly Love or the Heart of America is the best place for you to visit or even relocate.
Distance between
Philadelphia, PA and
Kansas City, MO : 1,034.2 miles
Philadelphia's population is larger by 210%. Its population has grown by 58,701 people (3.9%) since 2000. The population of Kansas City has grown by 66,849 people (15.1%) during that time.
Philadelphia has a higher crime rate compared to the US average, including both property and violent crimes compared to Kansas City. In Kansas City, although the crime rate is also above the national average, it is lower relative to Philadelphia. Both cities have put efforts in employing crime reduction strategies to ensure the safety of their residents and visitors.
City-data.com crime index counts serious crimes and violent crime more heavily. It adjusts for the number of visitors and daily workers commuting into cities. (higher means more crime, U.S. average = 301.1)
City-data.com crime index counts serious crimes and violent crime more heavily. It adjusts for the number of visitors and daily workers commuting into cities. (higher means more crime, U.S. average = 301.1)
Sex Offenders
According to our data, there are 2,776 registered sex offenders living in Philadelphia and 1,794 registered sex offenders living in . The ratio of residents to sex offenders in Philadelphia is 565 to 1; the ratio in Kansas City is 268 to 1. The number of registered sex offenders compared to the number of residents is a smaller in Philadelphia than in Kansas City.
Cost of Living
The cost of living in Philadelphia is relatively higher than that in Kansas City. This includes costs associated with housing, groceries, utilities, and healthcare. Kansas City, therefore, may offer a more affordable lifestyle for potential residents or long-term visitors.
Income Tax
Pennsylvania has a flat state income tax rate of 3.07%, and Philadelphia imposes an additional city wage tax. Missouri's income tax is progressive, with rates ranging from 1.5% to 5.4%, but Kansas City does not impose an additional city income tax.
Property Tax
Philadelphia also tends to have higher property taxes than Kansas City, further contributing to its higher cost of living.
Sales Tax
Philadelphia has a higher sales tax rate at 8% which includes a 2% city sales tax, compared to Kansas City's total sales tax of around 7.85%.
Income
Type
Philadelphia
Kansas City
Estimated median household income
$52,899
$63,396
Estimated per capita income
$32,707
$36,456
Cost of living index (U.S. average is 100)
105.4
87.3
If you make $50,000 in Kansas City, you will have to make $60,367 in Philadelphia to maintain the same standard of living.
Geographical Conditions
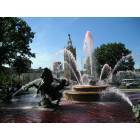
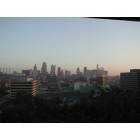
Philadelphia is located in a lowland area close to the Atlantic coast, with rivers shaping its geographical makeup. Kansas City is defined more by its midwestern prairie landscape and is famous for its fountains and boulevards.
Both cities have a strong emphasis on education. Philadelphia houses prestigious institutions like the University of Pennsylvania and Temple University. Kansas City is home to the University of Missouri-Kansas City and Kansas City Art Institute. Both cities offer ample opportunities for quality education at all levels.
Philadelphia's economy is primarily driven by sectors like healthcare, education, and financial services. On the other hand, Kansas City's economy focuses more on service industries, including federal government jobs. The median household income is slightly higher in Philadelphia compared to Kansas City.
Biggest Employers
In Philadelphia, some of the biggest employers include the University of Pennsylvania and the Children's Hospital of Philadelphia. Kansas City's largest employers are the federal government and several healthcare establishments like Saint Luke's Health System and the University of Kansas Hospital.
In Philadelphia (Philadelphia County), 85.2% voted for Democrats and 14.0% for Republicans in 2012 Presidential Election. In Kansas City (Jackson County), 58.9% voted for Democrats and 39.3% for Republicans.
Elections
Type
Democrats
Republicans
Other
Year
Philadelphia
Kansas City
Philadelphia
Kansas City
Philadelphia
Kansas City
2020
81.2%
60.1%
17.9%
38.1%
0.9%
1.8%
2016
82.3%
55.5%
15.3%
38.1%
2.4%
6.4%
2012
85.2%
58.9%
14.0%
39.3%
0.8%
1.7%
2008
83.2%
62.1%
16.4%
36.8%
0.4%
1.1%
2004
80.6%
58.2%
19.4%
41.4%
0.0%
0.4%
2000
80.4%
59.0%
18.1%
38.4%
1.5%
2.5%
1996
77.4%
56.2%
16.0%
34.3%
6.6%
9.5%
Breakdown of population affiliated with a religious congregation
Type
Adherents
Congregations
Religion
Philadelphia
Kansas City
Philadelphia
Kansas City
CATHOLIC CHURCH
24.8%
10.3%
8.8%
6.4%
AMERICAN BAPTIST CHURCHES IN THE USA
3.8%
0.3%
6.7%
1.4%
MUSLIM ESTIMATE
2.6%
0.4%
3.1%
1.1%
SOUTHERN BAPTIST CONVENTION
2.2%
9.5%
9.9%
13.7%
EPISCOPAL CHURCH
0.8%
0.8%
3.8%
1.7%
EVANGELICAL LUTHERAN CHURCH IN AMERICA
0.6%
0.2%
3.1%
1.0%
PRESBYTERIAN CHURCH IN AMERICA
0.4%
0.0%
1.4%
0.1%
SEVENTH DAY ADVENTIST CHURCH
0.4%
0.5%
1.7%
1.0%
SALVATION ARMY
0.2%
0.4%
0.7%
0.6%
LUTHERAN CHURCH
0.0%
1.4%
0.5%
1.8%
Weather
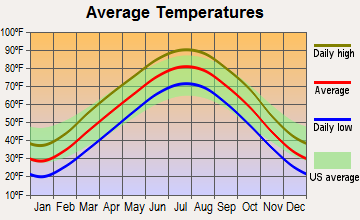
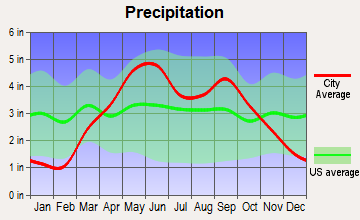
Weather varies greatly between these two cities. Philadelphia experiences four distinct seasons with humid summers and cold winters. On the other hand, Kansas City, situated in the Midwest, experiences more extreme weather patterns. Summers can be very hot and humid, and winters can be particularly cold with more snowfall compared to Philadelphia.
Weather and climate
Type
Philadelphia
Kansas City
Temperature - Average
54.8°F
56.2°F
Humidity - Average morning or afternoon humidity
69.9%
76.3%
Humidity - Differences between morning and afternoon humidity
34%
30.1%
Humidity - Maximum monthly morning or afternoon humidity
82%
86%
Humidity - Minimum monthly morning or afternoon humidity
48%
56%
Precipitation - Yearly average
45.7 in
36.3 in
Snowfall - Yearly average
45.1 in
38 in
Clouds - Number of days clear of clouds
15.4%
20.1%
Sunshine amount - Average
59.8%
67.3%
Sunshine amount - Differences during a year
18%
25.9%
Sunshine amount - Maximum monthly
63%
74%
Sunshine amount - Minimum monthly
45%
48%
Wind speed - Average
10 mph
11.2 mph
Average climate in Philadelphia, Pennsylvania
Average climate in Kansas City, Missouri
Air pollution
Type
AQI
CO
NO2
OZONE
PB
PM10
PM25
SO2
Year
Philadelphia
Kansas City
Philadelphia
Kansas City
Philadelphia
Kansas City
Philadelphia
Kansas City
Philadelphia
Philadelphia
Kansas City
Philadelphia
Kansas City
Philadelphia
Kansas City
2018
99
89
0.37
0.29
10.7
11.1
24.3
29.6
N/A
N/A
17.2
24.5
9.2
7.4
0.9
0.9
2017
105
88
0.32
0.29
11.0
11.6
25.3
30.4
0.004
N/A
22.3
26.7
8.9
10.0
1.0
1.4
2016
99
85
0.30
0.30
13.6
12.0
25.1
28.9
0.007
N/A
23.2
24.9
9.5
9.0
1.4
1.5
2015
110
90
0.34
0.30
15.8
12.9
22.6
28.9
0.007
N/A
23.9
33.6
10.5
8.3
1.8
4.6
2014
105
90
0.34
0.28
16.8
13.0
23.1
28.6
0.027
N/A
23.0
28.5
11.7
9.3
2.2
5.0
2013
105
88
0.27
0.41
16.7
13.2
22.5
29.3
0.029
N/A
31.0
30.8
10.5
10.3
1.5
5.6
2012
111
105
0.29
0.52
17.8
14.2
23.0
31.9
0.040
N/A
14.6
N/A
11.7
10.3
1.5
6.4
2011
113
108
0.28
0.45
19.9
15.0
24.3
29.9
0.039
N/A
16.9
N/A
9.8
10.9
1.9
4.8
2010
116
97
0.30
0.40
20.1
15.0
23.0
27.4
0.009
N/A
21.7
N/A
12.2
11.9
2.6
5.4
2009
95
96
0.32
0.29
18.9
14.8
19.7
28.3
0.011
N/A
18.0
N/A
11.9
9.6
2.9
6.1
2008
112
89
0.30
0.40
19.8
17.0
19.1
25.7
0.010
N/A
16.8
N/A
13.9
11.5
3.8
6.0
2007
128
104
0.42
0.42
21.6
18.4
23.3
29.1
0.019
N/A
17.5
N/A
12.3
13.1
4.2
4.2
2006
112
104
0.52
0.36
21.4
18.5
22.5
29.2
0.016
N/A
18.3
N/A
13.1
12.4
4.2
5.1
2005
108
105
0.58
0.55
24.4
18.3
20.8
28.4
0.018
N/A
19.7
N/A
N/A
N/A
5.0
4.5
2004
102
83
0.58
0.45
24.1
11.6
18.9
26.2
0.023
N/A
19.1
N/A
N/A
N/A
5.2
4.0
2003
103
99
0.62
0.41
23.8
10.9
19.7
28.0
0.034
N/A
19.6
N/A
N/A
N/A
5.4
3.0
2002
128
100
0.56
0.40
26.8
8.9
21.2
27.0
0.035
N/A
18.3
N/A
N/A
N/A
4.9
2.5
2001
119
88
0.63
0.52
27.9
7.9
20.0
27.0
0.014
N/A
20.6
N/A
N/A
N/A
5.6
1.2
2000
111
102
0.68
0.75
26.7
8.8
19.0
29.2
0.034
N/A
N/A
N/A
N/A
N/A
5.5
2.2
Natural disasters
Type
Philadelphia
Kansas City
Tornado activity compared to U.S. average
96.6%
200.4%
Earthquake activity compared to U.S. average
34.4%
598.9%
Natural disasters compared to U.S. average
22%
24%
Transportation
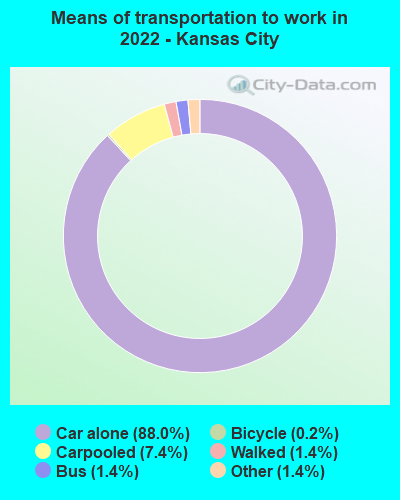
Both cities offer robust public transportation options. Philadelphia's Southeastern Pennsylvania Transportation Authority (SEPTA) provides comprehensive bus, subway, and trolley services. Kansas City has a free streetcar line and extensive bus system operated by RideKC.
Transport
Type
Philadelphia
Kansas City
Amtrak stations
2
1
Amtrak stations nearby
3
3
FAA registered aircraft
347
0
FAA registered aircraft manufacturers and dealers
2
0
Means of transportation to work
Type
Philadelphia
Kansas City
Bicycle
2%
0.4%
Bus
11.7%
1.5%
Carpooled
8.7%
8.7%
Car alone
60%
86.8%
Railroad
0.7%
0%
Streetcar
4.2%
0%
Subway
2.8%
0%
Taxicab
0.2%
0.2%
Walked
7.8%
1.3%
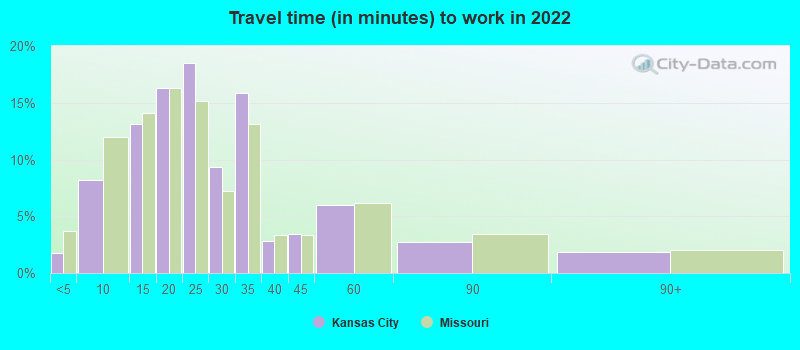
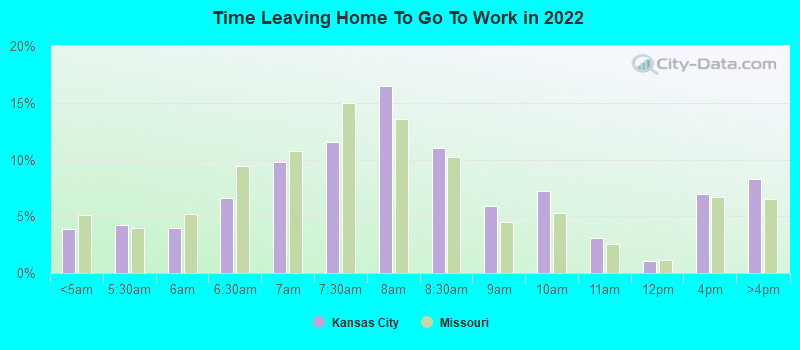
Average travel time to work
Type
Philadelphia
Kansas City
Average
34.3 min
25.5 min
Other means
28.2 min
21.7 min
Public transportation
45.6 min
38.9 min
Private vehicle occupancy
Type
Philadelphia
Kansas City
Average
1.2
1.1
Drove alone
86.4%
89.4%
In 2 person carpool
10.2%
8%
In 3 person carpool
2%
2.1%
In 4 person carpool
0.9%
0.3%
In 5-6 person carpool
0.3%
0.2%
In 7+ person carpool
0.2%
0%
How many people usually rode to work in the car, truck or van.
Real Estate
Real estate costs are generally higher in Philadelphia, reflecting its higher cost of living. Kansas City offers more affordable housing options, relatively, whether you're looking to rent or buy.
Neighborhoods
Philadelphia offers a range of diverse neighborhoods, each with its unique charm, from the historic Old City to the vibrant South Philly. Similarly, Kansas City has neighborhoods for every lifestyle, from artsy Crossroads to family-friendly Brookside.
Houses and residents
Type
Philadelphia
Kansas City
Houses
733,015
243,950
Average household size (people)
2.5
2.3
Median year apartment built
1953
1975
Median year house/condo built
1947
1967
Length of stay in the house since moving in
16 years
12 years
Houses occupied
660,921 (90.2%)
219,020 (89.8%)
Houses occupied by owners
348,935 (52.8%)
118,384 (54.1%)
Houses occupied by renters
311,986 (47.2%)
100,636 (45.9%)
Median rent asked for vacant for-rent units
$1,301
$933.71
Median monthly housing costs
$1,096
$1,092
Median price asked for vacant for-sale houses and condos
$260,453
$71,644
Estimated median house or condo value
$220,700
$213,400
Median numbers of rooms
5.5
5.5
Median number of rooms in apartments
4.2
4.3
Median number of rooms in houses and condos
6.2
6.6
Median house price - detached houses
$292,974
$250,072
Median house price - in 2-unit structures
$357,727
$212,485
Median house price - in 3-to-4-unit structures
$264,854
$147,015
Median house price - in 5 or more unit structures
$442,314
$274,597
Median house price - mobile homes
$163,609
$19,650
Median house price - occupied boats, rvs, vans etc.
$93,218
$485,967
Median house price - Townhouses or other attached units
$239,791
$203,232
Median house price - All housing units
$256,324
$247,285
Median house age
73
52
Renting percentage
45.9%
43.8%
Housing density (houses/condos per square mile)
5,426.1
778
House value disparities
38.4%
36%
Household income disparities
49.5%
43.9%
Median household income for houses/condes with a mortgage
$86,108
$96,255
Median household income for apartments without a mortgage
$44,075
$64,961
Housing units without a mortgage
8,484 (4%)
1,566 (2%)
Housing units with both a second mortgage and home equity loan
18,029 (8.5%)
5,650 (7.2%)
Housing units with a mortgage
202,880 (96%)
77,422 (98%)
Housing units with a home equity loan
1,280 (0.6%)
403 (0.5%)
Housing units with a second mortgage
22,966 (10.9%)
6,848 (8.7%)
House/condo owner moved in on average (years ago)
15
9
House/condo renter moved in on average (years ago)
3
1
Housing units lacking complete kitchen facilities
3.7%
3.8%
Housing units lacking complete plumbing facilities
3.3%
2.2%
Housing units in structures
Housing units in structures
Philadelphia
Kansas City
One, detached
9.9%
60.7%
One, attached
55.9%
3.9%
Two
7.4%
3.1%
3 or 4
6.7%
4.4%
5 to 9
2.8%
5.8%
10 to 19
2.5%
6.2%
20 to 49
3.1%
5.8%
50 or more
11.2%
9.3%
Mobile homes
0.3%
0.6%
Boats, RVs, vans, etc.
0.1%
0.1%
Median real estate property taxes paid for housing units
Self-employed workers in own not incorporated business
29,270
13,035
State government workers
16,901
6,835
Unpaid family workers
570
197
Industries and Occupations
In Philadelphia, the biggest industries are education, healthcare, and financial services with occupations spread across these sectors. Kansas City, however, is known for its government services, trade, and transportation, with many inhabitants working in these sectors.
Both cities offer excellent healthcare options. Philadelphia is known for its top-rated hospitals like the University of Pennsylvania's Penn Presbyterian. Kansas City boasts quality health facilities like the University of Kansas Hospital.
Health (county statistics)
Type
Philadelphia
Kansas City
General health status score of residents in this county from 1 (poor) to 5 (excellent)
Philadelphia, established earlier in American history, boasts of historic buildings and older infrastructure. Kansas City, developing more in the 1800s, has a blend of historic and modern architecture. Both cities are investing in infrastructure improvement projects to make commuting smoother for their inhabitants and visitors.
Infrastructure
Type
Philadelphia
Kansas City
Hospitals
91
30
TV stations
24
14
Arenas or stadiums
7
2
Bank branches located here
329
140
Bank institutions located here
46
41
Main business address for public companies
47
27
Drinking water stations with no reported violations in the past
1
0
Drinking water stations with reported violations in the past
HMDA - Conventional home purchase loans - Applications denied
Year
Philadelphia
Kansas City
1999
3,294
1,565
2000
3,202
1,758
2001
2,480
1,494
2002
2,012
1,380
2003
3,268
1,975
2004
4,525
3,011
2005
6,637
3,470
2006
7,517
3,499
2007
5,750
2,228
2008
2,745
742
2009
1,390
447
Culture and Food
Both cities are rich in culture and cuisine. Philadelphia is known for its historic sites, museums, and food specialties like cheesesteaks. Kansas City is renowned for its jazz music, barbecue cuisine, and craft breweries.
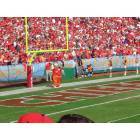
Sports Teams
Sports fans will find much to enjoy in either city. Philadelphia has the Eagles (NFL), Phillies (MLB), 76ers (NBA), and Flyers (NHL). In contrast, Kansas City is home to the Chiefs (NFL), Royals (MLB), and Sporting KC (MLS).


 Philadelphia, PA
 Kansas City, MO