Phoenix, Arizona, and Raleigh, North Carolina offer differing lifestyles and environments for residents and tourists alike. While Phoenix is prided on its desert beauty and sunny weather, Raleigh, the "City of Oaks", offers a combination of southern charm and high-tech innovation. The thriving economy, varying climates, and unique opportunities for outdoor activities set these cities apart. Both cities provide diverse food scenes, top-rated healthcare, and a rich tapestry of culture and sports teams; however, living costs and infrastructures differ.
Distance between
Phoenix, AZ and
Raleigh, NC : 1,897.0 miles
Phoenix's population is larger by 246%. Its population has grown by 303,524 people (23.0%) since 2000. The population of Raleigh has grown by 193,031 people (69.9%) during that time.
When comparing crime rates between Phoenix and Raleigh, Phoenix has a slightly higher crime rate, mostly in property crimes. However, like any other city, crime fluctuates depending on the neighborhood. In Raleigh, the crime rates are lower which often ranks it as one of America's safest cities. Visitors and potential residents alike should consider these statistics and focus on choosing safer neighborhoods within each city.
City-data.com crime index counts serious crimes and violent crime more heavily. It adjusts for the number of visitors and daily workers commuting into cities. (higher means more crime, U.S. average = 301.1)
City-data.com crime index counts serious crimes and violent crime more heavily. It adjusts for the number of visitors and daily workers commuting into cities. (higher means more crime, U.S. average = 301.1)
Sex Offenders
According to our data, there are 3,583 registered sex offenders living in Phoenix and 2,151 registered sex offenders living in . The ratio of residents to sex offenders in Phoenix is 451 to 1; the ratio in Raleigh is 213 to 1. The number of registered sex offenders compared to the number of residents is a smaller in Phoenix than in Raleigh.
Cost of Living
The cost of living in Raleigh is lower compared to Phoenix. Raleigh boasts affordable housing options without compromising quality or comforts. Phoenix, however, has elevated costs primarily due to higher housing prices. This difference indicates a meaningful consideration for tourists or those looking to relocate.
Income Tax
Arizona has a state income tax that ranges from 2.59% to 4.50% while North Carolina charges a flat tax rate of 5.25% for all taxpayers, regardless of income level.
Property Tax
Raleigh's property tax rate is generally lower than Phoenix's. However, the actual amounts paid may vary depending on the local community and the value of the property.
Sales Tax
Raleigh has a lower sales tax as compared to Phoenix. It is 7.25% in Raleigh, while Phoenix charges 8.6%, affecting the amount spent on local purchases.
Income
Type
Phoenix
Raleigh
Estimated median household income
$68,435
$74,612
Estimated per capita income
$35,073
$44,001
Cost of living index (U.S. average is 100)
101.2
95.1
If you make $50,000 in Raleigh, you will have to make $53,207 in Phoenix to maintain the same standard of living.
Geographical Conditions
Phoenix possesses a desert setting with mountainous surroundings, offering plenty of outdoor activities like hiking, camping, and biking. Raleigh is located near the Atlantic Ocean and the Appalachian Mountains, allowing for frequent beach, hiking, and skiing trips.
Both Phoenix and Raleigh have excellent colleges and universities. In Raleigh, North Carolina State University, Duke University, and the University of North Carolina at Chapel Hill are top-rated institutions. Phoenix offers Arizona State University and the University of Phoenix, renowned for their research and online programs.
While Phoenix's economy is driven by a robust real estate market, healthcare, retail, and manufacturing, Raleigh, also known as the "Silicon Valley of the East", is a tech hub with the economy driven by the high-tech and biotech. Both cities have higher than average job growth rates, underscoring the economic opportunities in both cities.
Biggest Employers
The state of Arizona, Banner Health and Walmart, are the largest employers in Phoenix. Alternatively, Raleigh's largest employers include Wake County Public School System, North Carolina State University, and IBM.
There were 4,922 building permits issued in Phoenix in 2012 (3970 more than in 2011) compared to 1,354 building permits issued in Raleigh in 2012 (366 more than in 2011).
In Phoenix (Maricopa County), 43.6% voted for Democrats and 54.3% for Republicans in 2012 Presidential Election. In Raleigh (Wake County), 54.9% voted for Democrats and 43.5% for Republicans.
Elections
Type
Democrats
Republicans
Other
Year
Phoenix
Raleigh
Phoenix
Raleigh
Phoenix
Raleigh
2020
50.2%
62.3%
48.0%
35.9%
1.8%
1.8%
2016
44.9%
57.4%
47.7%
37.2%
7.5%
5.5%
2012
43.6%
54.9%
54.3%
43.5%
2.1%
1.6%
2008
44.0%
56.8%
54.5%
42.3%
1.5%
0.9%
2004
42.4%
48.7%
57.0%
50.9%
0.6%
0.4%
2000
43.0%
46.1%
53.4%
53.2%
3.6%
0.7%
1996
44.5%
45.9%
47.2%
48.2%
8.2%
5.9%
Breakdown of population affiliated with a religious congregation
Type
Adherents
Congregations
Religion
Phoenix
Raleigh
Phoenix
Raleigh
CATHOLIC CHURCH
13.6%
11.0%
4.3%
2.4%
SOUTHERN BAPTIST CONVENTION
1.9%
9.0%
6.5%
22.5%
EVANGELICAL LUTHERAN CHURCH IN AMERICA
0.8%
0.6%
2.0%
1.1%
LUTHERAN CHURCH
0.5%
0.4%
1.5%
0.6%
SEVENTH DAY ADVENTIST CHURCH
0.4%
0.2%
2.0%
1.0%
EPISCOPAL CHURCH
0.3%
1.1%
1.3%
1.8%
VINEYARD USA
0.3%
0.1%
0.6%
0.6%
AMERICAN BAPTIST CHURCHES IN THE USA
0.2%
0.4%
0.6%
0.6%
MUSLIM ESTIMATE
0.2%
1.1%
1.0%
1.0%
Weather
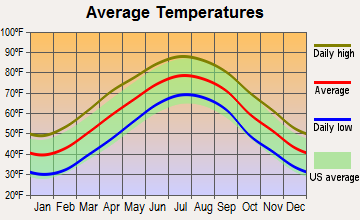
Phoenix's weather is hot, with over 300 sunny days annually, making it ideal for outdoor enthusiasts but potentially uncomfortable during summer. Unlike Phoenix, Raleigh has a moderate climate with four distinct seasons, including a hot and humid summer, a chilly (yet mild) winter, and beautiful spring and autumn seasons.
Weather and climate
Type
Phoenix
Raleigh
Temperature - Average
71.5°F
59.8°F
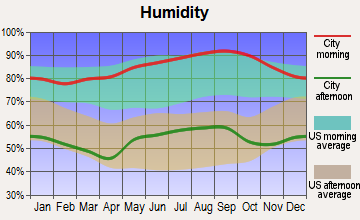
Humidity - Average morning or afternoon humidity
37.5%
73.7%
Humidity - Differences between morning and afternoon humidity
48%
44%
Humidity - Maximum monthly morning or afternoon humidity
60%
90%
Humidity - Minimum monthly morning or afternoon humidity
12%
46%
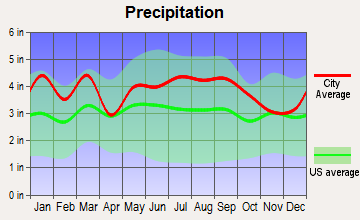
Precipitation - Yearly average
8.7 in
46.2 in
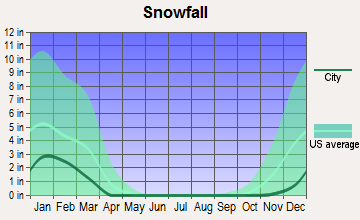
Snowfall - Yearly average
0 in
13.4 in
Clouds - Number of days clear of clouds
35.3%
18.5%
Sunshine amount - Average
92.8%
63.9%
Sunshine amount - Differences during a year
16%
13%
Sunshine amount - Maximum monthly
95%
64%
Sunshine amount - Minimum monthly
79%
51%
Wind speed - Average
6.6 mph
7.1 mph
Average climate in Phoenix, Arizona
Average climate in Raleigh, North Carolina
Air pollution
Type
AQI
CO
NO2
OZONE
PM10
PM25
SO2
Year
Phoenix
Raleigh
Phoenix
Raleigh
Phoenix
Raleigh
Phoenix
Raleigh
Phoenix
Raleigh
Phoenix
Raleigh
Phoenix
Raleigh
2018
156
71
0.38
0.23
15.2
4.9
28.5
27.5
34.8
14.6
8.6
9.5
0.6
0.2
2017
120
70
0.41
0.23
15.9
5.5
28.6
25.8
34.9
14.7
7.6
9.3
1.4
0.2
2016
114
80
0.44
0.23
15.8
5.6
27.3
26.9
30.6
8.7
7.7
10.0
0.4
0.3
2015
102
79
0.46
0.27
17.6
5.7
27.1
28.6
26.2
12.4
7.9
11.0
0.9
0.3
2014
117
74
0.46
0.26
19.6
6.0
27.6
29.9
37.0
N/A
8.5
11.2
1.1
0.3
2013
130
72
0.43
0.26
19.9
N/A
27.9
26.9
35.3
N/A
8.4
10.7
0.9
0.4
2012
157
80
0.44
0.28
21.2
N/A
28.1
29.7
41.9
N/A
8.8
9.5
1.3
0.6
2011
203
84
0.47
0.27
20.0
N/A
28.3
32.9
41.3
N/A
9.6
10.3
0.9
0.7
2010
100
89
0.48
0.30
19.9
N/A
26.9
32.4
31.2
N/A
8.3
10.9
0.9
1.0
2009
108
77
0.52
0.30
20.1
N/A
25.6
27.8
38.2
N/A
N/A
10.3
1.8
1.0
2008
106
99
0.48
0.36
21.4
N/A
26.6
32.3
39.6
N/A
N/A
12.5
2.4
1.4
2007
129
98
0.54
0.40
23.5
N/A
25.2
35.7
47.6
N/A
N/A
13.9
2.4
1.2
2006
131
90
0.66
0.44
25.3
N/A
24.4
31.9
50.8
N/A
N/A
13.5
2.3
0.9
2005
109
80
0.74
0.38
25.9
N/A
22.2
33.9
44.6
N/A
N/A
N/A
2.5
2.5
2004
98
82
0.77
0.40
25.5
N/A
23.4
28.4
32.8
N/A
N/A
N/A
1.4
2.6
2003
101
82
0.90
N/A
26.8
N/A
23.7
29.9
42.6
N/A
N/A
N/A
1.4
3.0
2002
111
89
0.98
N/A
28.7
N/A
23.6
36.1
41.8
N/A
N/A
N/A
1.6
2.6
2001
106
128
1.00
N/A
28.6
N/A
22.3
34.5
37.8
N/A
N/A
N/A
1.5
N/A
2000
117
115
1.14
0.64
29.9
N/A
24.6
34.1
45.6
N/A
N/A
N/A
1.7
N/A
Natural disasters
Type
Phoenix
Raleigh
Tornado activity compared to U.S. average
18.3%
95.1%
Earthquake activity compared to U.S. average
2,597.6%
52.6%
Natural disasters compared to U.S. average
16%
18%
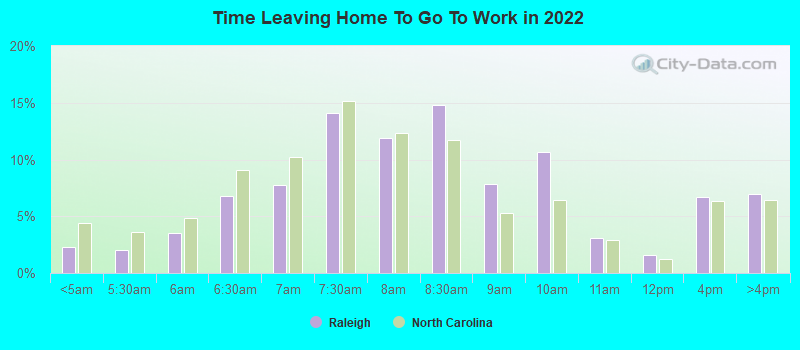
Transportation
Phoenix and Raleigh offer robust bus services around their metro areas; however, Phoenix has the edge with a light rail system. Commuting times in both cities are reasonable, with Raleigh boasting slightly shorter commute times typically.
Transport
Type
Phoenix
Raleigh
Amtrak stations
3
1
Amtrak stations nearby
3
3
FAA registered aircraft
1
499
FAA registered aircraft manufacturers and dealers
15
12
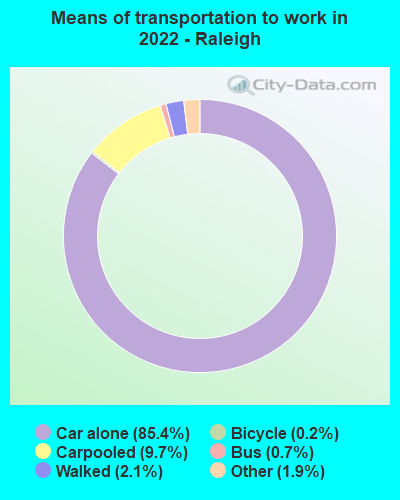
Means of transportation to work
Type
Phoenix
Raleigh
Bicycle
0.4%
0.2%
Bus
1.8%
1.1%
Carpooled
12.2%
8.5%
Car alone
81.8%
87.4%
Motorcycle
0.4%
0.1%
Railroad
0.2%
0%
Taxicab
0.1%
0.3%
Walked
1.4%
1.1%
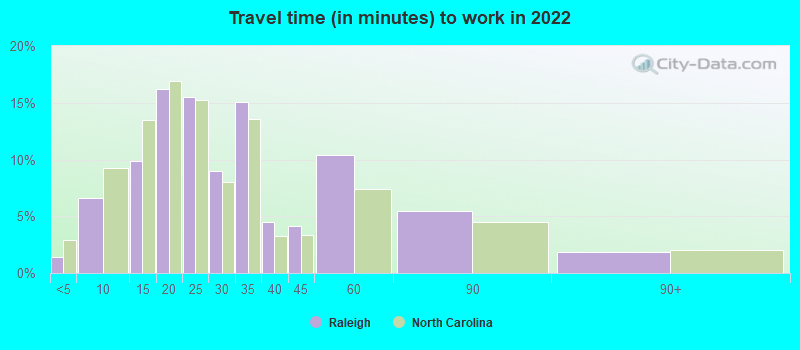
Average travel time to work
Type
Phoenix
Raleigh
Average
28.6 min
29.4 min
Other means
26.4 min
22.5 min
Public transportation
45.1 min
39.9 min
Private vehicle occupancy
Type
Phoenix
Raleigh
Average
1.2
1.1
Drove alone
86.4%
90.1%
In 2 person carpool
9.6%
7.6%
In 3 person carpool
2%
1.4%
In 4 person carpool
1.5%
0.3%
In 5-6 person carpool
0.3%
0.6%
In 7+ person carpool
0.3%
0.1%
How many people usually rode to work in the car, truck or van.
Real Estate
Real estate in Phoenix is known for its large homes with pools and scenic desert views. However, housing is more expensive than in Raleigh, which is recognized for a more relaxed, suburban environment that includes single-family homes and townhouses in tree-lined neighborhoods.
Neighborhoods
Neighborhoods like Scottsdale in Phoenix offer a mix of suburban and urban lifestyles. Phoenix also offers a strong Hispanic influence in its districts. Raleigh is home to North Hills and Cameron Village, featuring unique shopping and dining experiences in a family-oriented city with a small-town feel.
Houses and residents
Type
Phoenix
Raleigh
Houses
644,625
217,866
Average household size (people)
2.8
2.4
Median year apartment built
1987
1995
Median year house/condo built
1983
1995
Length of stay in the house since moving in
11.1 years
11.5 years
Houses occupied
602,039 (93.4%)
194,917 (89.5%)
Houses occupied by owners
354,237 (58.8%)
103,367 (53%)
Houses occupied by renters
247,802 (41.2%)
91,550 (47%)
Median rent asked for vacant for-rent units
$1,605
$1,740
Median monthly housing costs
$1,284
$1,298
Median price asked for vacant for-sale houses and condos
$375,817
$302,120
Estimated median house or condo value
$352,600
$340,200
Median numbers of rooms
5.2
5.1
Median number of rooms in apartments
4
3.9
Median number of rooms in houses and condos
6.1
6.7
Median house price - detached houses
$452,968
$446,507
Median house price - in 2-unit structures
Over $1,000,000
$403,968
Median house price - in 3-to-4-unit structures
$229,335
$170,635
Median house price - in 5 or more unit structures
$299,875
$306,998
Median house price - mobile homes
$159,046
$31,622
Median house price - Townhouses or other attached units
$300,398
$292,086
Median house price - All housing units
$429,075
$404,828
Median house age
36
26
Renting percentage
42.4%
46.5%
Housing density (houses/condos per square mile)
1,357.5
1,901.1
House value disparities
30.8%
30.8%
Household income disparities
43.9%
45.4%
Median household income for houses/condes with a mortgage
$96,609
$114,680
Median household income for apartments without a mortgage
$63,626
$81,716
Housing units without a mortgage
3,634 (1.5%)
1,689 (2.1%)
Housing units with both a second mortgage and home equity loan
12,949 (5.2%)
6,627 (8.2%)
Housing units with a mortgage
246,434 (98.5%)
78,923 (97.9%)
Housing units with a home equity loan
624 (0.2%)
0 (0%)
Housing units with a second mortgage
16,890 (6.8%)
7,783 (9.7%)
House/condo owner moved in on average (years ago)
8
8
House/condo renter moved in on average (years ago)
1
1
Housing units lacking complete kitchen facilities
1.2%
0.6%
Housing units lacking complete plumbing facilities
0.7%
0.5%
Housing units in structures
Housing units in structures
Phoenix
Raleigh
One, detached
60.3%
45.0%
One, attached
4.9%
14.0%
Two
1.4%
1.2%
3 or 4
4.4%
4.6%
5 to 9
5.0%
6.3%
10 to 19
5.3%
12.4%
20 to 49
4.1%
6.0%
50 or more
11.3%
9.2%
Mobile homes
3.1%
1.2%
Boats, RVs, vans, etc.
0.2%
0.0%
Median real estate property taxes paid for housing units
Self-employed workers in own not incorporated business
48,122
12,488
State government workers
30,385
19,792
Unpaid family workers
1,048
523
Industries and Occupations
Phoenix is recognized for its thriving tourism industry, healthcare, and real estate. It is home to diverse occupations spanning across retail, customer service, and administration. Raleigh, on the other hand, is known for its life sciences, information technology, clean tech, and advanced manufacturing, making it a beacon for tech-driven occupations.
Both Phoenix and Raleigh are known for their high-quality healthcare systems. Phoenix is home to the Mayo Clinic and Banner Health System, while Raleigh boasts top-rated Duke University Health System and UNC Health Care.
Health (county statistics)
Type
Phoenix
Raleigh
General health status score of residents in this county from 1 (poor) to 5 (excellent)
Phoenix's infrastructure includes a high-speed internet available citywide, efficient public transportation, and a vast network of highways and airports. On the other hand, Raleigh's infrastructure, including a well-paved system of roads and consistent utilities, remains a lure for potential inhabitants and visitors.
Infrastructure
Type
Phoenix
Raleigh
Hospitals
48
19
TV stations
22
20
Arenas or stadiums
2
3
Bank branches located here
263
136
Bank institutions located here
41
27
Main business address for public companies
41
21
Nuclear power plants nearby
0
1
Drinking water stations with no reported violations in the past
2
2
Drinking water stations with reported violations in the past
HMDA - Conventional home purchase loans - Applications denied
Year
Phoenix
Raleigh
1999
5,846
1,618
2000
4,847
890
2001
3,823
557
2002
3,472
510
2003
5,750
564
2004
9,848
700
2005
15,879
1,083
2006
18,392
1,097
2007
9,797
859
2008
3,130
424
2009
1,614
253
Culture and Food
Phoenix is best known for its Southwestern and Mexican cuisine while Raleigh features a mix of Southern comfort food and globally-inspired dishes. Both cities have a vibrant art scene, with many museums and galleries to visit.
Sports Teams
Phoenix and Raleigh both have a diverse array of sports teams. Phoenix is home to all four major sports leagues – the Suns (NBA), Diamondbacks (MLB), Cardinals (NFL), and Coyotes (NHL). Meanwhile, Raleigh hosts the Hurricanes (NHL), alongside highly competitive collegiate sports at North Carolina State University and nearby Duke University and the University of North Carolina at Chapel Hill.


 Phoenix, AZ
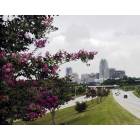
 Raleigh, NC